Noticias del mercado
-
08:25
Forex Today: US Dollar struggles to gather strength after Fed, attention turns to BoE
Here is what you need to know on Thursday, March 20:
The US Dollar (USD) finds it difficult to outperform its rivals on Thursday as markets digest the Federal Reserve's (Fed) policy announcements. The Bank of England (BoE) will release the interest rate decision later in the session and the US economic calendar will feature weekly Initial Jobless Claims data, alongside Existing Homes figures for February.
US Dollar PRICE This week
The table below shows the percentage change of US Dollar (USD) against listed major currencies this week. US Dollar was the weakest against the Swiss Franc.
USD EUR GBP JPY CAD AUD NZD CHF USD -0.06% -0.31% -0.19% -0.24% 0.23% -0.39% -0.91% EUR 0.06% -0.37% -0.52% -0.17% 0.16% -0.34% -0.88% GBP 0.31% 0.37% 0.15% -0.01% 0.51% 0.02% -0.58% JPY 0.19% 0.52% -0.15% -0.03% 0.22% -0.14% -0.85% CAD 0.24% 0.17% 0.01% 0.03% 0.27% -0.15% -1.22% AUD -0.23% -0.16% -0.51% -0.22% -0.27% -0.47% -1.02% NZD 0.39% 0.34% -0.02% 0.14% 0.15% 0.47% -0.54% CHF 0.91% 0.88% 0.58% 0.85% 1.22% 1.02% 0.54% The heat map shows percentage changes of major currencies against each other. The base currency is picked from the left column, while the quote currency is picked from the top row. For example, if you pick the US Dollar from the left column and move along the horizontal line to the Japanese Yen, the percentage change displayed in the box will represent USD (base)/JPY (quote).
The Fed left the interest rate unchanged at 4.25%-4.5% following the March meeting, as widely anticipated. The revised Summary of Economic Projections showed that policymakers still project a total of 50 basis points (bps) reduction in rates in 2025. The Gross Domestic Product (GDP) growth forecast for this year got revised lower to 1.7% from 2.1% in December's SEP. In the post-meeting press conference, Fed Chairman Powell reiterated that they will not be in a hurry to move on rate cuts, adding that they can maintain policy restraint for longer if the economy remains strong. The USD Index failed to make a decisive move in either direction following the Fed event and closed marginally higher on Wednesday. Early Thursday, the index moves sideways at around 103.50.
The UK's Office for National Statistics reported on Thursday that the ILO Unemployment Rate held steady at 4.4% in the three months to January, as expected. In this period, the Employment Change was up by 144,000. GBP/USD trades marginally lower on the day below 1.3000 following the UK jobs report. Later in the day, the BoE is widely anticipated to maintain its policy settings. There will not be a press conference following the release of the rate decision. Hence, investors are likely to pay close attention to the vote split.
The Swiss National Bank (SNB) will also announce policy decisions on Thursday, and it's expected to lower the policy rate by 25 bps to 0.25%. Following a two-day decline, USD/CHF found support and closed virtually unchanged on Wednesday. The pair fluctuates in a relatively tight channel above 0.8750 in the European morning.
EUR/USD lost about 0.4% on Wednesday and snapped a three-day winning streak. The pair struggles to gain traction and trades below 1.0900 to begin the European session. European Central Bank (ECB) President Christine Lagarde will deliver a speech before the European Parliament on Thursday.
After testing 150.00 on Wednesday, USD/JPY reversed its direction and ended the day in the red. The pair continues to edge lower and trades below 148.50 on Thursday.
Gold closed marginally higher on Wednesday and touched a new record-high above $3,050 in the Asian session on Thursday before going into a consolidation phase below this level.
BoE FAQs
The Bank of England (BoE) decides monetary policy for the United Kingdom. Its primary goal is to achieve ‘price stability’, or a steady inflation rate of 2%. Its tool for achieving this is via the adjustment of base lending rates. The BoE sets the rate at which it lends to commercial banks and banks lend to each other, determining the level of interest rates in the economy overall. This also impacts the value of the Pound Sterling (GBP).
When inflation is above the Bank of England’s target it responds by raising interest rates, making it more expensive for people and businesses to access credit. This is positive for the Pound Sterling because higher interest rates make the UK a more attractive place for global investors to park their money. When inflation falls below target, it is a sign economic growth is slowing, and the BoE will consider lowering interest rates to cheapen credit in the hope businesses will borrow to invest in growth-generating projects – a negative for the Pound Sterling.
In extreme situations, the Bank of England can enact a policy called Quantitative Easing (QE). QE is the process by which the BoE substantially increases the flow of credit in a stuck financial system. QE is a last resort policy when lowering interest rates will not achieve the necessary result. The process of QE involves the BoE printing money to buy assets – usually government or AAA-rated corporate bonds – from banks and other financial institutions. QE usually results in a weaker Pound Sterling.
Quantitative tightening (QT) is the reverse of QE, enacted when the economy is strengthening and inflation starts rising. Whilst in QE the Bank of England (BoE) purchases government and corporate bonds from financial institutions to encourage them to lend; in QT, the BoE stops buying more bonds, and stops reinvesting the principal maturing on the bonds it already holds. It is usually positive for the Pound Sterling.
-
08:15
EUR/GBP holds positive ground near 0.8400 after UK employment data
- EUR/GBP trades on a firmer note around 0.8390 in Thursday’s early European session.
- UK Unemployment Rate held steady at 4.4% in three months to January; Claimant Count Change came in at 44.2K in February.
- The BoE is expected to keep interest rates on hold at 4.5% on Thursday.
- German parliament approves Merz's historic spending surge.
The EUR/GBP cross holds positive ground near 0.8390 during the early European trading hours on Thursday. The Pound Sterling (GBP) softens against the Euro (EUR) after the UK employment report. The attention will shift to the Bank of England’s (BOE) interest rate decision, with no change in rate expected.
Data released by the UK Office for National Statistics on Thursday showed that the country’s ILO Unemployment Rate climbed to 4.4% in the three months to January. This figure came in line with the expectations of 4.4% during the reported period. Meanwhile, the Claimant Count Change rose by 44.2K in February versus 2.8K prior, missing the estimated 7.9K figure. The GBP remains weak in an immediate reaction to the UK employment report.
The BoE is expected to keep interest rates on hold on Thursday and stick to its mantra of gradual moves amid the heightened economic uncertainty. The markets anticipate the UK central bank to leave its benchmark interest rate on hold at 4.5%, with the next cut likely in May, followed by further reductions in August and November, according to the majority of economists polled by Reuters last week.
On the Euro front, Germany's parliament approved plans for a massive spending surge on Tuesday. This positive development could provide some support to the shared currency, as the plan would provide the chancellor-in-waiting with a windfall of hundreds of billions of euros to boost investment after two years of contraction in Europe's largest economy.Pound Sterling FAQs
The Pound Sterling (GBP) is the oldest currency in the world (886 AD) and the official currency of the United Kingdom. It is the fourth most traded unit for foreign exchange (FX) in the world, accounting for 12% of all transactions, averaging $630 billion a day, according to 2022 data. Its key trading pairs are GBP/USD, also known as ‘Cable’, which accounts for 11% of FX, GBP/JPY, or the ‘Dragon’ as it is known by traders (3%), and EUR/GBP (2%). The Pound Sterling is issued by the Bank of England (BoE).
The single most important factor influencing the value of the Pound Sterling is monetary policy decided by the Bank of England. The BoE bases its decisions on whether it has achieved its primary goal of “price stability” – a steady inflation rate of around 2%. Its primary tool for achieving this is the adjustment of interest rates. When inflation is too high, the BoE will try to rein it in by raising interest rates, making it more expensive for people and businesses to access credit. This is generally positive for GBP, as higher interest rates make the UK a more attractive place for global investors to park their money. When inflation falls too low it is a sign economic growth is slowing. In this scenario, the BoE will consider lowering interest rates to cheapen credit so businesses will borrow more to invest in growth-generating projects.
Data releases gauge the health of the economy and can impact the value of the Pound Sterling. Indicators such as GDP, Manufacturing and Services PMIs, and employment can all influence the direction of the GBP. A strong economy is good for Sterling. Not only does it attract more foreign investment but it may encourage the BoE to put up interest rates, which will directly strengthen GBP. Otherwise, if economic data is weak, the Pound Sterling is likely to fall.
Another significant data release for the Pound Sterling is the Trade Balance. This indicator measures the difference between what a country earns from its exports and what it spends on imports over a given period. If a country produces highly sought-after exports, its currency will benefit purely from the extra demand created from foreign buyers seeking to purchase these goods. Therefore, a positive net Trade Balance strengthens a currency and vice versa for a negative balance.
-
08:08
United Kingdom Claimant Count Rate: 4.7% (February) vs 4.6%
-
08:01
Germany Producer Price Index (YoY) came in at 0.7% below forecasts (1%) in February
-
08:01
UK Unemployment Rate steadies at 4.4% in the quarter to January as expected
- The UK Unemployment Rate stays at 4.4% in three months to January.
- The Claimant Count Change for Britain came in at 44.2K in January.
- GBP/USD remains below 1.3000 after mixed UK employment data.
The United Kingdom’s (UK) ILO Unemployment Rate stayed unchanged at 4.4% in the three months to January, data published by the Office for National Statistics (ONS) showed on Thursday. The market consensus was for a 4.4% reading in the reported period.
Additional details of the report showed that the number of people claiming jobless benefits increased by 44.2K in February, compared with a gain of 2.8K in January, missing the expected 7.9K figure.
The Employment Change data for January came in at 144K versus December’s 107K.
Meanwhile, Average Earnings, excluding Bonus, in the UK rose 5.9% three months year-over-year (3M YoY) in January versus a 5.9% growth booked previously. Markets expected a 5.9% print.
Another measure of wage inflation, Average Earnings, including Bonus, advanced 5.8% in the same period after accelerating by a revised 6.1% in the quarter through December. The data surpassed the market forecast of 5.9%.
GBP/USD reaction to the UK employment report
GBP/USD holds lower ground on the release of the UK employment data. The pair is trading 0.02% lower on the day at 1.2985, as of writing.
(This story was corrected on March 20 at 07:09 GMT to say that "Additional details of the report showed that the number of people claiming jobless benefits increased by 44.2K in February, compared with a gain of 2.8K in January," not 22K)
British Pound PRICE Last 7 days
The table below shows the percentage change of British Pound (GBP) against listed major currencies last 7 days. British Pound was the strongest against the Japanese Yen.
USD EUR GBP JPY CAD AUD NZD CHF USD -0.02% -0.16% 0.04% -0.18% -0.06% -0.81% -0.62% EUR 0.02% -0.14% 0.06% -0.17% -0.04% -0.77% -0.60% GBP 0.16% 0.14% 0.19% -0.03% 0.11% -0.63% -0.45% JPY -0.04% -0.06% -0.19% -0.26% -0.11% -0.86% -0.65% CAD 0.18% 0.17% 0.03% 0.26% 0.14% -0.61% -0.43% AUD 0.06% 0.04% -0.11% 0.11% -0.14% -0.73% -0.50% NZD 0.81% 0.77% 0.63% 0.86% 0.61% 0.73% 0.22% CHF 0.62% 0.60% 0.45% 0.65% 0.43% 0.50% -0.22% The heat map shows percentage changes of major currencies against each other. The base currency is picked from the left column, while the quote currency is picked from the top row. For example, if you pick the British Pound from the left column and move along the horizontal line to the US Dollar, the percentage change displayed in the box will represent GBP (base)/USD (quote).
-
08:01
Switzerland Exports (MoM) rose from previous 24450M to 24744M in February
-
08:01
Switzerland Imports (MoM) climbed from previous 18326M to 19941M in February
-
08:01
United Kingdom Average Earnings Excluding Bonus (3Mo/Yr) meets forecasts (5.9%) in January
-
08:00
United Kingdom Average Earnings Including Bonus (3Mo/Yr) below forecasts (5.9%) in January: Actual (5.8%)
-
08:00
Switzerland Trade Balance declined to 4803M in February from previous 6124M
-
08:00
United Kingdom Employment Change (3M) up to 144K in January from previous 107K
-
08:00
Germany Producer Price Index (MoM) below forecasts (0.1%) in February: Actual (-0.2%)
-
08:00
United Kingdom ILO Unemployment Rate (3M) meets forecasts (4.4%) in January
-
08:00
United Kingdom Claimant Count Change above expectations (7.9K) in February: Actual (44.2K)
-
08:00
United Kingdom Average Earnings Including Bonus (3Mo/Yr) in line with expectations (5.9%) in January
-
08:00
BoE expected to hold interest rate at 4.50% amid stubborn inflation and weak economic outlook
- The Bank of England is expected to hold its policy rate at 4.50%.
- UK inflation figures remain well above the BoE’s target.
- GBP/USD extends its rally past the psychological 1.3000 barrier.
The Bank of England (BoE) is set to reveal its monetary policy decision on Thursday, marking the second meeting of 2025.
Expectations are high among market watchers that the central bank will keep its benchmark rate at 4.50%, following a 25 basis point reduction in the previous month.
Alongside the decision, the BoE will publish the meeting Minutes, and Governor Andrew Bailey will hold a press conference to shed light on the reasoning behind the move.
Barring any surprises in the interest rate decision, all eyes will then shift to the bank’s forward guidance and economic outlook.
UK economic outlook: Stubborn inflation, fading growth
The Bank of England (BoE) lived up to expectations in February, delivering a hawkish rate cut backed unanimously by the nine-member Monetary Policy Committee (MPC).
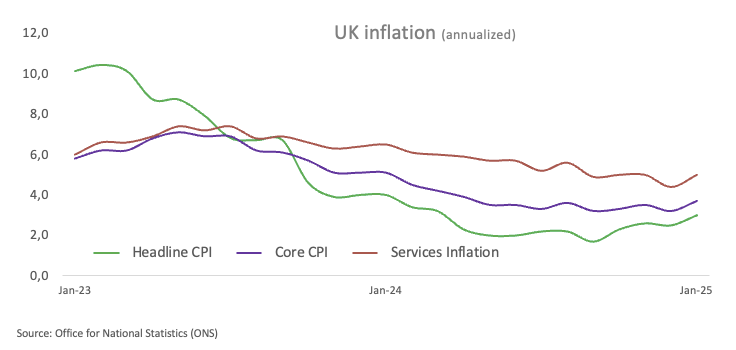
Meanwhile, fresh data from the Office for National Statistics (ONS) revealed an unexpected uptick in the UK’s annual headline inflation, which climbed to 3.0% in January from 2.5% in December. Core inflation, which excludes food and energy costs, also rose, hitting 3.7% over the last 12 months.
In addition, growth figures painted a less optimistic picture. The UK’s Gross Domestic Product (GDP) unexpectedly shrank by 0.1% in January. Furthermore, downbeat Industrial and Manufacturing Production data also added to the gloomy picture, while the S&P Global Manufacturing PMI remained stuck in contraction territory during the same month.
Following these disheartening prints, the swaps market now sees around 56 basis points of easing by the BoE through year-end.
At the BoE’s latest monetary policy gathering, Governor Andrew Bailey explained that global economic uncertainty played a key role in the decision to add the word "careful" to the bank's future interest rate guidance.
At a news conference, he remarked that this uncertainty was "two-sided" — suggesting it could either hinder the disinflation process or, conversely, accelerate it.
"It could lead to conditions which actually make the path of disinflation less assured," Bailey noted, before adding that it "frankly could also... lead to conditions which have the opposite effect and lead to it being a faster path for disinflation."
How will the BoE interest rate decision impact GBP/USD?
As previously mentioned, investors widely anticipate the BoE keeping its interest rate unchanged on Thursday at 12:00 GMT.
With that in mind, the British Pound (GBP) will likely stand pat to the decision, but it could show some reaction to how rate-setters vote. Investors will also pay close attention to Governor Andrew Bailey’s remarks.
Ahead of the event, GBP/USD managed to trespass, albeit briefly, the psychological 1.3000 barrier, with the pair closely following USD dynamics as well as developments in the US tariff narrative.
Pablo Piovano, Senior Analyst at FXStreet, noted that GBP/USD managed to break above the critical 1.3000 hurdle earlier in the week, coming under some renewed downside pressure since then.
“Once Cable clears its 2025 high of 1.3009 (set on March 18), it could embark on a potential visit to the November 2024 top at 1.3047”, Piovano added.
“On the downside, the 200-day SMA at 1.2795 serves as the initial safety net, supported by the transitory 100-day SMA at 1.2621 and the weekly low of 1.2558 (February 28). If selling pressure accelerates, the pair could dip toward the 55-day SMA at 1.2552, followed by deeper support at the February trough of 1.2248 (February 3) and the 2025 bottom at 1.2099 (January 13)”, Piovano concluded.
Economic Indicator
BoE Interest Rate Decision
The Bank of England (BoE) announces its interest rate decision at the end of its eight scheduled meetings per year. If the BoE is hawkish about the inflationary outlook of the economy and raises interest rates it is usually bullish for the Pound Sterling (GBP). Likewise, if the BoE adopts a dovish view on the UK economy and keeps interest rates unchanged, or cuts them, it is seen as bearish for GBP.
Read more.Next release: Thu Mar 20, 2025 12:00
Frequency: Irregular
Consensus: 4.5%
Previous: 4.5%
Source: Bank of England
UK gilt yields FAQs
UK Gilt Yields measure the annual return an investor can expect from holding UK government bonds, or Gilts. Like other bonds, Gilts pay interest to holders at regular intervals, the ‘coupon’, followed by the full value of the bond at maturity. The coupon is fixed but the Yield varies as it takes into account changes in the bond's price. For example, a Gilt worth 100 Pounds Sterling might have a coupon of 5.0%. If the Gilt's price were to fall to 98 Pounds, the coupon would still be 5.0%, but the Gilt Yield would rise to 5.102% to reflect the decline in price.
Many factors influence Gilt yields, but the main ones are interest rates, the strength of the British economy, the liquidity of the bond market and the value of the Pound Sterling. Rising inflation will generally weaken Gilt prices and lead to higher Gilt yields because Gilts are long-term investments susceptible to inflation, which erodes their value. Higher interest rates impact existing Gilt yields because newly-issued Gilts will carry a higher, more attractive coupon. Liquidity can be a risk when there is a lack of buyers or sellers due to panic or preference for riskier assets.
Probably the most important factor influencing the level of Gilt yields is interest rates. These are set by the Bank of England (BoE) to ensure price stability. Higher interest rates will raise yields and lower the price of Gilts because new Gilts issued will bear a higher, more attractive coupon, reducing demand for older Gilts, which will see a corresponding decline in price.
Inflation is a key factor affecting Gilt yields as it impacts the value of the principal received by the holder at the end of the term, as well as the relative value of the repayments. Higher inflation deteriorates the value of Gilts over time, reflected in a higher yield (lower price). The opposite is true of lower inflation. In rare cases of deflation, a Gilt may rise in price – represented by a negative yield.
Foreign holders of Gilts are exposed to exchange-rate risk since Gilts are denominated in Pound Sterling. If the currency strengthens investors will realize a higher return and vice versa if it weakens. In addition, Gilt yields are highly correlated to the Pound Sterling. This is because yields are a reflection of interest rates and interest rate expectations, a key driver of Pound Sterling. Higher interest rates, raise the coupon on newly-issued Gilts, attracting more global investors. Since they are priced in Pounds, this increases demand for Pound Sterling.
-
06:56
US Dollar Index Price Forecast: Bearish outlook remains in play near 103.50
- The US Dollar Index recovers some lost ground to near 103.50 in Thursday’s early European session.
- The DXY keeps the negative outlook below the 100-day EMA with a bearish RSI indicator.
- The first downside target to watch is 103.20; the immediate upside barrier is seen at 104.10.
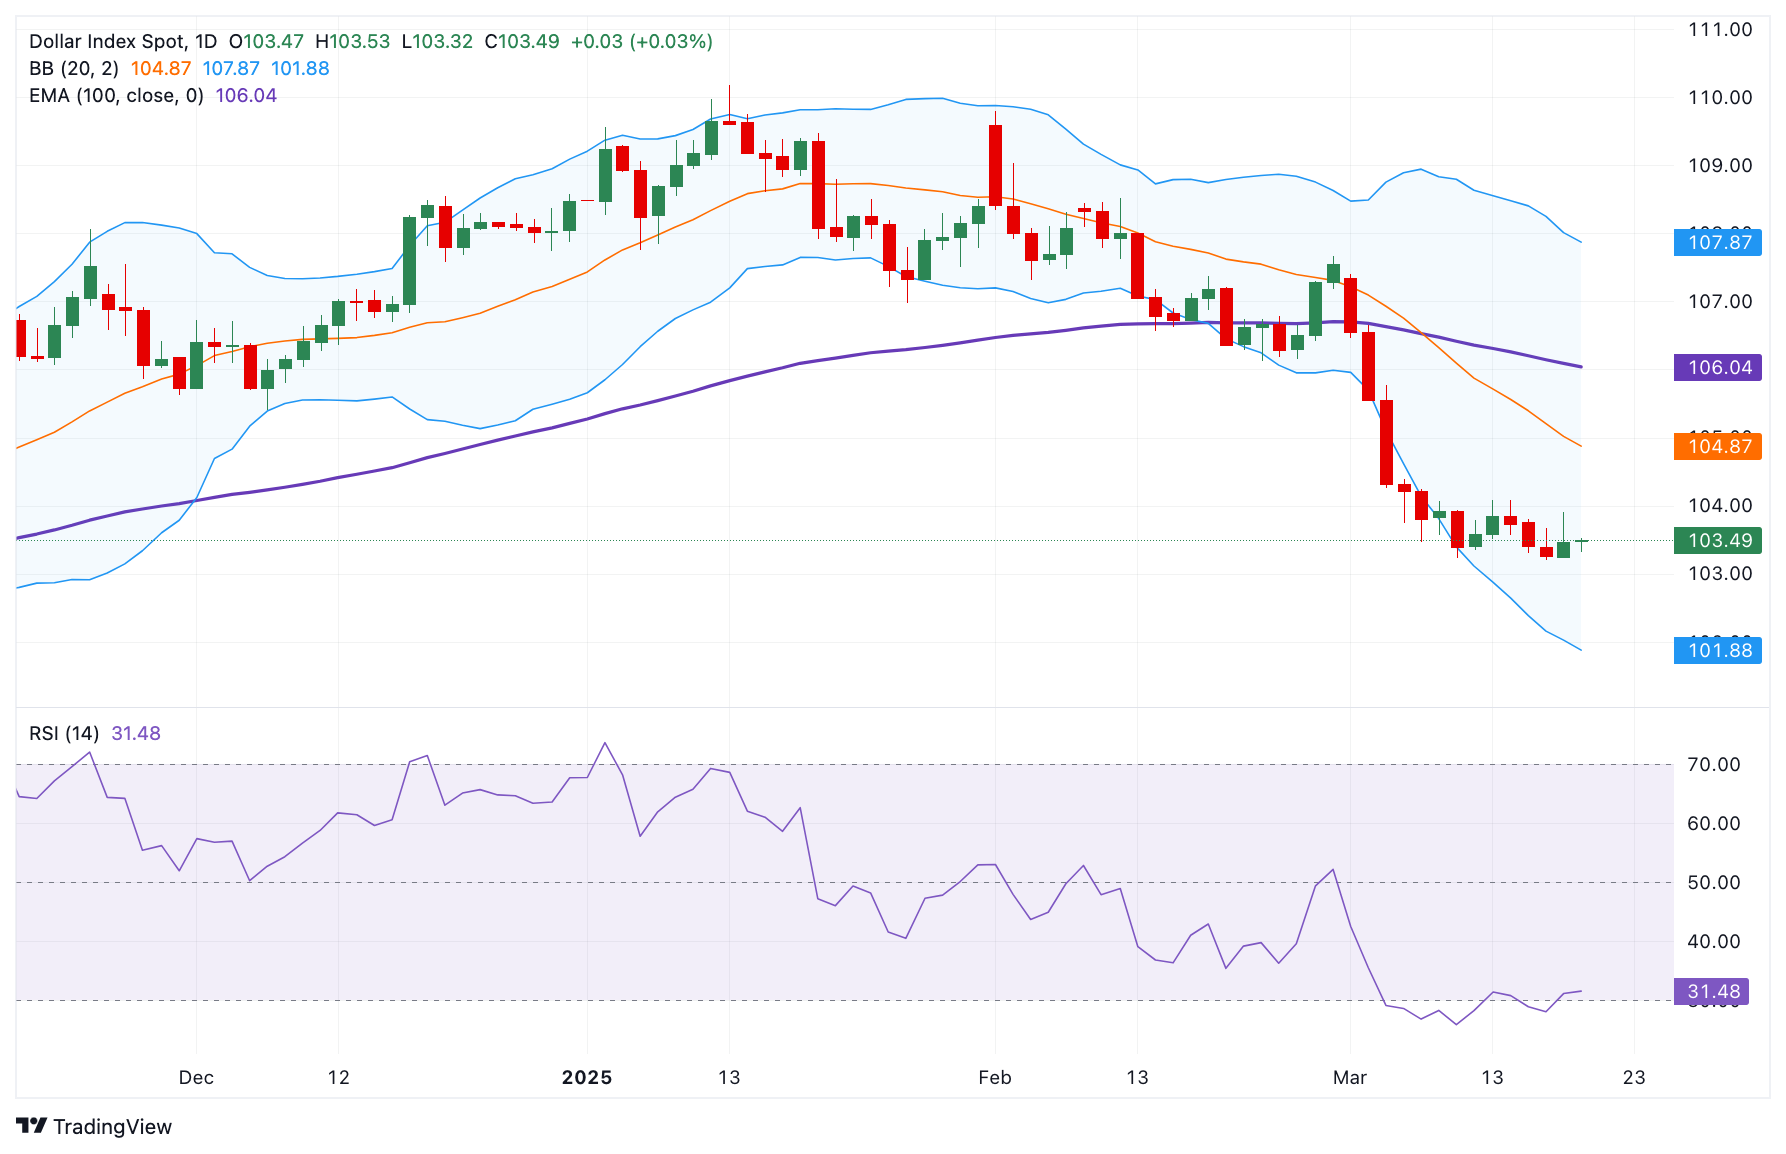
The US Dollar Index (DXY), an index of the value of the US Dollar (USD) measured against a basket of six world currencies, trades in positive territory near 103.50 during the early European session on Thursday.
However, the upside of the DXY might be limited as the Federal Reserve (Fed) indicated interest rate cuts were likely later this year. Additionally, the Fed officials lowered its forecast for economic growth and revised both its inflation projection and unemployment estimates higher.
According to the daily chart, the bearish outlook of the DXY remains intact, with the index holding below the key 100-day Exponential Moving Average (EMA). Further downside looks favorable as the 14-day Relative Strength Index (RSI), which stands below the midline near 31.75.
The initial support level for the USD index is located at 103.20, the low of March 18. Sustained trading below the mentioned level could expose 101.88, the lower limit of the Bollinger Band. A breach of this level could see a drop to 100.53, the low of August 28, 2024.
On the other hand, the high of March 14 at 104.10 acts as an immediate resistance level for the DXY. The additional upside filter to watch is 105.45, the high of November 6, 2024. The key upside barrier is seen at 106.00, representing the 100-day EMA and the psychological level.US Dollar Index (DXY) daily chart
US Dollar FAQs
The US Dollar (USD) is the official currency of the United States of America, and the ‘de facto’ currency of a significant number of other countries where it is found in circulation alongside local notes. It is the most heavily traded currency in the world, accounting for over 88% of all global foreign exchange turnover, or an average of $6.6 trillion in transactions per day, according to data from 2022. Following the second world war, the USD took over from the British Pound as the world’s reserve currency. For most of its history, the US Dollar was backed by Gold, until the Bretton Woods Agreement in 1971 when the Gold Standard went away.
The most important single factor impacting on the value of the US Dollar is monetary policy, which is shaped by the Federal Reserve (Fed). The Fed has two mandates: to achieve price stability (control inflation) and foster full employment. Its primary tool to achieve these two goals is by adjusting interest rates. When prices are rising too quickly and inflation is above the Fed’s 2% target, the Fed will raise rates, which helps the USD value. When inflation falls below 2% or the Unemployment Rate is too high, the Fed may lower interest rates, which weighs on the Greenback.
In extreme situations, the Federal Reserve can also print more Dollars and enact quantitative easing (QE). QE is the process by which the Fed substantially increases the flow of credit in a stuck financial system. It is a non-standard policy measure used when credit has dried up because banks will not lend to each other (out of the fear of counterparty default). It is a last resort when simply lowering interest rates is unlikely to achieve the necessary result. It was the Fed’s weapon of choice to combat the credit crunch that occurred during the Great Financial Crisis in 2008. It involves the Fed printing more Dollars and using them to buy US government bonds predominantly from financial institutions. QE usually leads to a weaker US Dollar.
Quantitative tightening (QT) is the reverse process whereby the Federal Reserve stops buying bonds from financial institutions and does not reinvest the principal from the bonds it holds maturing in new purchases. It is usually positive for the US Dollar.
-
06:31
Netherlands, The Unemployment Rate s.a (3M): 3.8% (February)
-
06:12
EUR/USD remains subdued around 1.0900 ahead of ECB’s Lagarde speech
- EUR/USD continues to decline ahead of ECB President Christine Lagarde’s speech at the European Parliament in Brussels.
- The US Dollar struggled as US yields weakened, following Fed’s reaffirmation of its outlook for two rate cuts in 2025.
- Germany’s proposed economic plan, aimed at stimulating growth and boosting defense spending, could contribute to rising inflation and broader economic expansion.
EUR/USD loses ground for the second successive day, trading around 1.0900 during Asian hours on Thursday. However, the pair strengthened as the US Dollar (USD) remained under pressure, weighed down by declining yields after the Federal Reserve (Fed) reaffirmed its outlook for two rate cuts later this year. However, uncertainty surrounding US President Donald Trump’s tariff policies adds a layer of caution.
Meanwhile, US Treasury bonds gained traction following the Fed’s decision to slow the pace of quantitative tightening, citing concerns over reduced liquidity and potential risks tied to government debt limits.
The US Dollar Index (DXY), which tracks the USD against six major currencies, is hovering near 103.40, while US Treasury yields continue to decline. The 2-year yield stands at 3.97%, and the 10-year yield at 4.24%.
On Wednesday, as expected, the Federal Reserve held the federal funds rate steady at 4.25%–4.5% during its March meeting. Fed Chair Jerome Powell noted, “Labor market conditions are solid, and inflation has moved closer to our 2% longer-run goal, though it remains somewhat elevated.”
In Europe, German leaders approved a debt restructuring plan proposed by likely Chancellor Friedrich Merz on Tuesday. The plan aims to stimulate economic growth and increase defense spending. Market participants anticipate that a shift away from Germany’s long-standing fiscal conservatism could drive inflation and economic expansion, prompting the European Central Bank (ECB) to reassess its current monetary policy.
Traders will likely observe ECB President Christine Lagarde on Thursday, who is scheduled to deliver an introductory statement on Economic and Monetary Affairs (ECON) at the European Parliament in Brussels, Belgium.
Euro PRICE Today
The table below shows the percentage change of Euro (EUR) against listed major currencies today. Euro was the weakest against the Japanese Yen.
USD EUR GBP JPY CAD AUD NZD CHF USD 0.07% 0.08% -0.19% 0.06% 0.28% 0.47% -0.05% EUR -0.07% 0.00% -0.24% -0.01% 0.20% 0.40% -0.12% GBP -0.08% -0.00% -0.25% -0.06% 0.20% 0.39% -0.14% JPY 0.19% 0.24% 0.25% 0.24% 0.46% 0.63% 0.18% CAD -0.06% 0.01% 0.06% -0.24% 0.23% 0.41% -0.15% AUD -0.28% -0.20% -0.20% -0.46% -0.23% 0.20% -0.35% NZD -0.47% -0.40% -0.39% -0.63% -0.41% -0.20% -0.56% CHF 0.05% 0.12% 0.14% -0.18% 0.15% 0.35% 0.56% The heat map shows percentage changes of major currencies against each other. The base currency is picked from the left column, while the quote currency is picked from the top row. For example, if you pick the Euro from the left column and move along the horizontal line to the US Dollar, the percentage change displayed in the box will represent EUR (base)/USD (quote).
-
06:06
FX option expiries for Mar 20 NY cut
FX option expiries for Mar 20 NY cut at 10:00 Eastern Time via DTCC can be found below.
EUR/USD: EUR amounts
- 1.0800 1.6b
- 1.0860 834m
- 1.0875 1.6b
- 1.0900 2.7b
- 1.0910 1.5b
GBP/USD: GBP amounts
- 1.3000 452m
USD/JPY: USD amounts
- 150.00 813m
- 150.70 905m
USD/CHF: USD amounts
- 0.8800 419m
AUD/USD: AUD amounts
- 0.6400 1b
- 0.6405 639m
USD/CAD: USD amounts
- 1.4125 485m
- 1.4500 731m
NZD/USD: NZD amounts
- 0.5670 1.5b
EUR/GBP: EUR amounts
- 0.8400 655m
-
05:54
GBP/JPY Price Forecast: Slides below 193.00 ahead of BoE; set up warrants caution for bears
- GBP/JPY extends the overnight pullback from the vicinity of over a two-month high.
- BoJ rate hike bets and the flight to safety underpin the JPY, exerting some pressure.
- A mixed technical setup warrants caution for bulls ahead of the BoE policy decision.
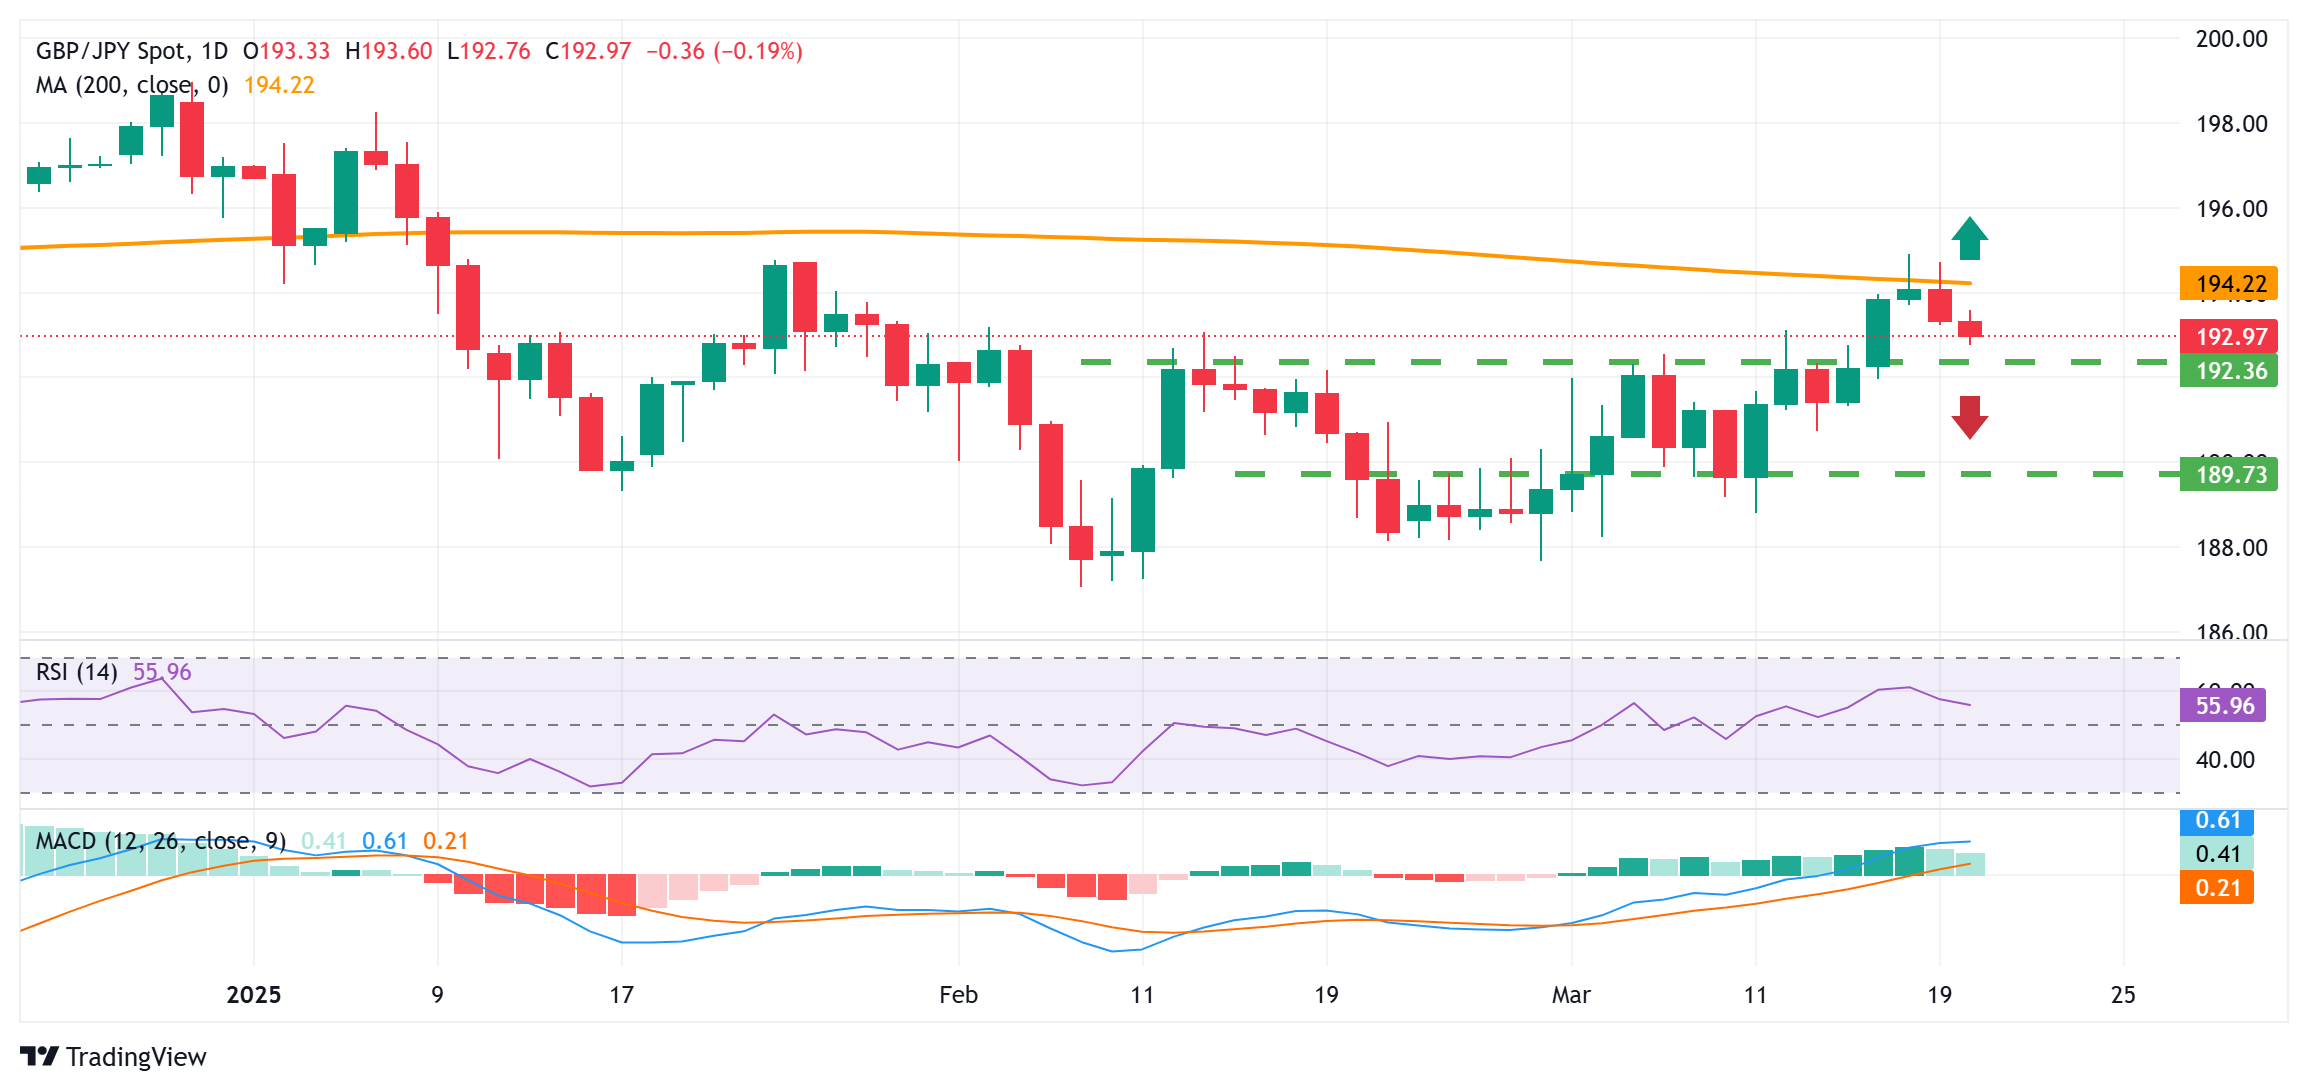
The GBP/JPY cross attracts sellers for the second successive day on Thursday and extends this week's retracement slide from the vicinity of the 195.00 psychological mark, or over a two-month high. Spot prices weaken further below the 193.00 round figure during the Asian session and seem vulnerable to slide further amid a broadly stronger Japanese Yen (JPY).
Expectations that strong wage growth could boost consumer spending and contribute to rising inflation give the Bank of Japan (BoJ) headroom to keep hiking interest rates. Apart from this, the uncertainty over US President Donald Trump's trade policies and geopolitical risks underpin the safe-haven JPY, which, in turn, is seen exerting pressure on the GBP/JPY cross. The British Pound (GBP), on the other hand, struggles to gain any traction as traders opt to wait for the Bank of England (BoE) decision.
From a technical perspective, spot price earlier this week struggled to find acceptance above the very important 200-day Simple Moving Average (SMA) and the subsequent fall could be seen as a key trigger for bearish traders. That said, oscillators on the daily chart are still holding in positive territory. Adding to this, the recent breakout through the 192.50 horizontal resistance warrants some caution before positioning for any further depreciating move heading into the key central bank event risk.
In the meantime, the aforementioned resistance breakpoint could protect the immediate downside, below which the GBP/JPY cross could accelerate the slide towards the 192.00 mark en route to the 191.35-191.30 support zone. Some follow-through selling has the potential to drag spot prices below the 191.00 round figure, towards the next relevant support near the 190.45-190.40 area en route to the 190.00 psychological mark and the 189.70-189.65 region.
On the flip side, any positive move might now confront resistance near the 194.00 round-figure mark ahead of the 200-day SMA, currently pegged around the 194.30 region. This is followed by the 194.90 region, or a multi-month peak touched earlier this week, which if cleared decisively should pave the way for additional gains. The GBP/JPY cross might then climb to the 196.00 mark en route to the 196.40 horizontal zone before aiming to reclaim the 197.00 round figure for the first time since January.
GBP/JPY daily chart
Economic Indicator
BoE Interest Rate Decision
The Bank of England (BoE) announces its interest rate decision at the end of its eight scheduled meetings per year. If the BoE is hawkish about the inflationary outlook of the economy and raises interest rates it is usually bullish for the Pound Sterling (GBP). Likewise, if the BoE adopts a dovish view on the UK economy and keeps interest rates unchanged, or cuts them, it is seen as bearish for GBP.
Read more.Next release: Thu Mar 20, 2025 12:00
Frequency: Irregular
Consensus: 4.5%
Previous: 4.5%
Source: Bank of England
-
05:53
USD/CHF attracts some sellers to near 0.8750 ahead of SNB rate decision
- USD/CHF weakens to around 0.8760 in Thursday’s Asian session.
- The Fed held its benchmark overnight rate steady in the 4.25%-4.50% range.
- The SNB is expected to cut rates by 25 bps at its March meeting on Thursday.
The USD/CHF pair attracts some sellers to near 0.8760 during the Asian trading hours on Thursday. The Greenback edges lower after the Federal Reserve (Fed) indicated interest rate cuts were likely later this year despite the high degree of uncertainty around US tariff policies. Later on Thursday, the Swiss National Bank (SNB) interest rate decision will be in the spotlight.
On Wednesday, the Fed kept interest rates unchanged in a range of 4.25% to 4.5% at its March meeting, as widely expected. The US central bank signaled it will cut rates two more times this year, in line with its previous projection from December.
However, the Fed officials lowered its forecast for economic growth and revised both its inflation projection and unemployment estimates higher. This, in turn, weighs on the USD against the Swiss Franc (CHF). Traders are now pricing in nearly 66 basis points (bps) of rate cuts this year from the Fed, about two rate reductions of 25 bps each, with a cut in July fully priced in, according to the LSEG data.
On the Swiss front, the markets expect the SNB to lower its benchmark interest rate by 25 bps to 0.25% at its policy meeting on Thursday. The decision follows a 50 bps reduction in December and comes amid subdued inflation, a strong CHF, and an uncertain global economic outlook. Nonetheless, worries about the CHF's strength remain, and the Swiss central bank could attempt to alleviate this pressure by cutting interest rates and maybe intervening in the foreign currency market.Swiss Franc FAQs
The Swiss Franc (CHF) is Switzerland’s official currency. It is among the top ten most traded currencies globally, reaching volumes that well exceed the size of the Swiss economy. Its value is determined by the broad market sentiment, the country’s economic health or action taken by the Swiss National Bank (SNB), among other factors. Between 2011 and 2015, the Swiss Franc was pegged to the Euro (EUR). The peg was abruptly removed, resulting in a more than 20% increase in the Franc’s value, causing a turmoil in markets. Even though the peg isn’t in force anymore, CHF fortunes tend to be highly correlated with the Euro ones due to the high dependency of the Swiss economy on the neighboring Eurozone.
The Swiss Franc (CHF) is considered a safe-haven asset, or a currency that investors tend to buy in times of market stress. This is due to the perceived status of Switzerland in the world: a stable economy, a strong export sector, big central bank reserves or a longstanding political stance towards neutrality in global conflicts make the country’s currency a good choice for investors fleeing from risks. Turbulent times are likely to strengthen CHF value against other currencies that are seen as more risky to invest in.
The Swiss National Bank (SNB) meets four times a year – once every quarter, less than other major central banks – to decide on monetary policy. The bank aims for an annual inflation rate of less than 2%. When inflation is above target or forecasted to be above target in the foreseeable future, the bank will attempt to tame price growth by raising its policy rate. Higher interest rates are generally positive for the Swiss Franc (CHF) as they lead to higher yields, making the country a more attractive place for investors. On the contrary, lower interest rates tend to weaken CHF.
Macroeconomic data releases in Switzerland are key to assessing the state of the economy and can impact the Swiss Franc’s (CHF) valuation. The Swiss economy is broadly stable, but any sudden change in economic growth, inflation, current account or the central bank’s currency reserves have the potential to trigger moves in CHF. Generally, high economic growth, low unemployment and high confidence are good for CHF. Conversely, if economic data points to weakening momentum, CHF is likely to depreciate.
As a small and open economy, Switzerland is heavily dependent on the health of the neighboring Eurozone economies. The broader European Union is Switzerland’s main economic partner and a key political ally, so macroeconomic and monetary policy stability in the Eurozone is essential for Switzerland and, thus, for the Swiss Franc (CHF). With such dependency, some models suggest that the correlation between the fortunes of the Euro (EUR) and the CHF is more than 90%, or close to perfect.
-
05:35
India Gold price today: Gold rises, according to FXStreet data
Gold prices rose in India on Thursday, according to data compiled by FXStreet.
The price for Gold stood at 8,472.91 Indian Rupees (INR) per gram, up compared with the INR 8,452.50 it cost on Wednesday.
The price for Gold increased to INR 98,821.50 per tola from INR 98,588.26 per tola a day earlier.
Unit measure Gold Price in INR 1 Gram 8,472.91 10 Grams 84,724.63 Tola 98,821.50 Troy Ounce 263,538.00 Daily Digest Market Movers: Gold price continues to attract safe-haven flows amid trade jitters, geopolitical risks
-
Asian equity markets track the overnight gains on Wall Street, bolstered by the Federal Reserve's decision to keep interest rates unchanged and maintain its rate cut forecast for the year. As was widely expected, the US central bank held interest rates steady for the second straight meeting and signaled that it would deliver two 25 basis points rate cuts by the end of this year.
-
Adding to this, US President Donald Trump and Russian President Vladimir Putin agreed on Tuesday for an immediate pause in strikes against energy infrastructure in the Ukraine war. Moreover, Ukrainian President Volodymyr Zelenskiy and Trump also agreed to work together to end the protracted Russia-Ukraine war, which further boosted investors' confidence.
-
Meanwhile, Fed officials trimmed their growth forecast for the year amid the growing uncertainty over the impact of the Trump administration's aggressive trade policies on economic activity. Trump imposed a flat 25% duty on steel and aluminum since February and has threatened to impose reciprocal and sectoral tariffs, fueling worries about a global trade war.
-
Traders now see over a 65% chance that the Fed would resume its rate-cutting cycle at the June policy meeting. This, in turn, fails to assist the US Dollar in registering any meaningful recovery from a multi-month low touched earlier this week and should lend some support to the non-yielding Gold price amid the risk of a further escalation of tensions in the Middle East.
-
The Israeli military said that it launched a limited ground incursion into Gaza, a day after an aerial bombardment of the strip that shattered the two-month-old ceasefire with Hamas. Moreover, Israeli Prime Minister Benjamin Netanyahu warned of fierce war expansion, which should continue to underpin the safe-haven precious metal and limit any corrective slide.
-
Traders now look forward to the latest monetary policy updates from the Bank of England and the Swiss National Bank. Later during the North American session, the US economic docket – featuring the usual Weekly Initial Jobless Claims, the Philly Fed Manufacturing Index, and Existing Home Sales data – could produce short-term opportunities around the XAU/USD.
FXStreet calculates Gold prices in India by adapting international prices (USD/INR) to the local currency and measurement units. Prices are updated daily based on the market rates taken at the time of publication. Prices are just for reference and local rates could diverge slightly.
Gold FAQs
Gold has played a key role in human’s history as it has been widely used as a store of value and medium of exchange. Currently, apart from its shine and usage for jewelry, the precious metal is widely seen as a safe-haven asset, meaning that it is considered a good investment during turbulent times. Gold is also widely seen as a hedge against inflation and against depreciating currencies as it doesn’t rely on any specific issuer or government.
Central banks are the biggest Gold holders. In their aim to support their currencies in turbulent times, central banks tend to diversify their reserves and buy Gold to improve the perceived strength of the economy and the currency. High Gold reserves can be a source of trust for a country’s solvency. Central banks added 1,136 tonnes of Gold worth around $70 billion to their reserves in 2022, according to data from the World Gold Council. This is the highest yearly purchase since records began. Central banks from emerging economies such as China, India and Turkey are quickly increasing their Gold reserves.
Gold has an inverse correlation with the US Dollar and US Treasuries, which are both major reserve and safe-haven assets. When the Dollar depreciates, Gold tends to rise, enabling investors and central banks to diversify their assets in turbulent times. Gold is also inversely correlated with risk assets. A rally in the stock market tends to weaken Gold price, while sell-offs in riskier markets tend to favor the precious metal.
The price can move due to a wide range of factors. Geopolitical instability or fears of a deep recession can quickly make Gold price escalate due to its safe-haven status. As a yield-less asset, Gold tends to rise with lower interest rates, while higher cost of money usually weighs down on the yellow metal. Still, most moves depend on how the US Dollar (USD) behaves as the asset is priced in dollars (XAU/USD). A strong Dollar tends to keep the price of Gold controlled, whereas a weaker Dollar is likely to push Gold prices up.
(An automation tool was used in creating this post.)
-
-
05:11
Gold price bulls retain control near all-time peak amid the flight to safety
- Gold price hits fresh record high as a combination of factors continues to boost safe-haven demand.
- The Fed’s dovish outlook keeps the USD bulls on the defensive and further underpins the XAU/USD.
- Slightly overbought conditions and a positive risk tone act as a headwind for the precious metal.
Gold price (XAU/USD) enters a bullish consolidation phase after touching a fresh all-time peak during the Asian session on Thursday. Bulls now seem reluctant to place fresh bets amid slightly overbought conditions and a positive risk tone, which tends to undermine the safe-haven precious metal. Any meaningful corrective decline, however, still seems elusive in the wake of the growing uncertainty over US President Donald Trump's trade policies and their impact on the global economy.
Apart from this, geopolitical risk and dovish Federal Reserve (Fed) expectations should act as a tailwind for the non-yielding Gold price. Meanwhile, the US Dollar (USD) struggles to gain any meaningful traction and languishes near its lowest level since October touched earlier this week amid bets that the Fed will resume its rate-cutting cycle soon. This could further contribute to limiting the downside for the commodity and warrants caution before confirming a near-term top for the bullion.
Daily Digest Market Movers: Gold price continues to attract safe-haven flows amid trade jitters, geopolitical risks
- Asian equity markets track the overnight gains on Wall Street, bolstered by the Federal Reserve's decision to keep interest rates unchanged and maintain its rate cut forecast for the year. As was widely expected, the US central bank held interest rates steady for the second straight meeting and signaled that it would deliver two 25 basis points rate cuts by the end of this year.
- Adding to this, US President Donald Trump and Russian President Vladimir Putin agreed on Tuesday for an immediate pause in strikes against energy infrastructure in the Ukraine war. Moreover, Ukrainian President Volodymyr Zelenskiy and Trump also agreed to work together to end the protracted Russia-Ukraine war, which further boosted investors' confidence.
- Meanwhile, Fed officials trimmed their growth forecast for the year amid the growing uncertainty over the impact of the Trump administration's aggressive trade policies on economic activity. Trump imposed a flat 25% duty on steel and aluminum since February and has threatened to impose reciprocal and sectoral tariffs, fueling worries about a global trade war.
- Traders now see over a 65% chance that the Fed would resume its rate-cutting cycle at the June policy meeting. This, in turn, fails to assist the US Dollar in registering any meaningful recovery from a multi-month low touched earlier this week and should lend some support to the non-yielding Gold price amid the risk of a further escalation of tensions in the Middle East.
- The Israeli military said that it launched a limited ground incursion into Gaza, a day after an aerial bombardment of the strip that shattered the two-month-old ceasefire with Hamas. Moreover, Israeli Prime Minister Benjamin Netanyahu warned of fierce war expansion, which should continue to underpin the safe-haven precious metal and limit any corrective slide.
- Traders now look forward to the latest monetary policy updates from the Bank of England and the Swiss National Bank. Later during the North American session, the US economic docket – featuring the usual Weekly Initial Jobless Claims, the Philly Fed Manufacturing Index, and Existing Home Sales data – could produce short-term opportunities around the XAU/USD.
Gold price needs to consolidate before the next leg up amid slightly overbought conditions on the daily chart
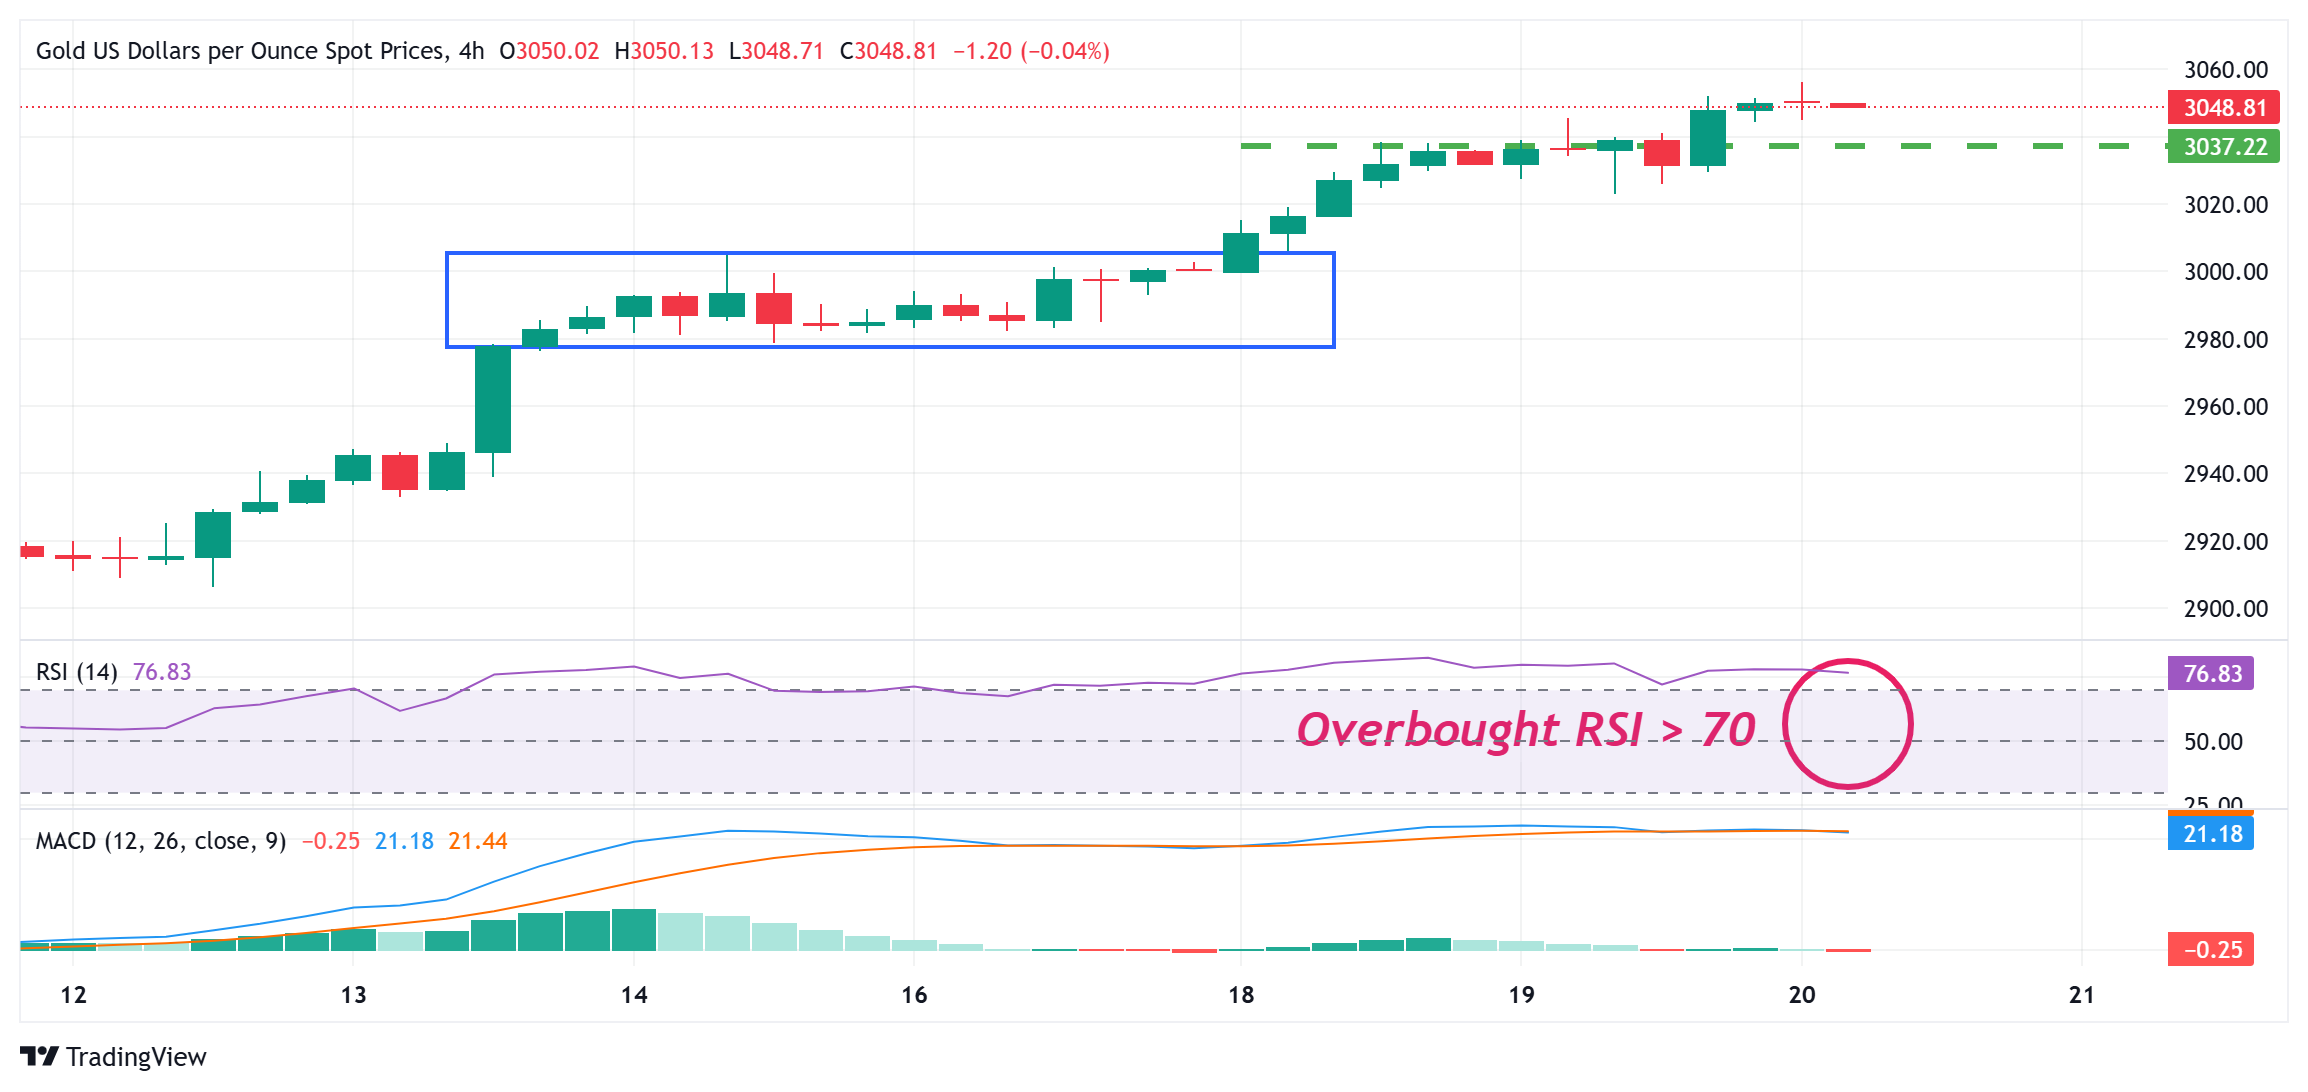
The daily Relative Strength Index (RSI) remains above the 70 mark, flashing overbought conditions and holding back bulls from placing fresh bets. Hence, it will be prudent to wait for some near-term consolidation or a modest pullback before traders start positioning for an extension of the recent well-established uptrend witnessed over the past three months or so. That said, the recent breakout through the $3,000 psychological mark and the subsequent move up suggest that the path of least resistance for the Gold price remains to the upside.
Meanwhile, any meaningful corrective slide is likely to attract some dip-buyers around the $3,023-3,022 area. This should help limit the downside near the $3,000 mark, which should now act as a key pivotal point for short-term traders. A convincing break below the latter might prompt some technical selling and drag the Gold price to the $2,980-2,978 intermediate support en route to the $2,956 region. The downward trajectory could extend further towards the $2,930 support before the XAU/USD drops to the $2,900 mark and last week's swing low, around the $2.880 area.
Gold FAQs
Gold has played a key role in human’s history as it has been widely used as a store of value and medium of exchange. Currently, apart from its shine and usage for jewelry, the precious metal is widely seen as a safe-haven asset, meaning that it is considered a good investment during turbulent times. Gold is also widely seen as a hedge against inflation and against depreciating currencies as it doesn’t rely on any specific issuer or government.
Central banks are the biggest Gold holders. In their aim to support their currencies in turbulent times, central banks tend to diversify their reserves and buy Gold to improve the perceived strength of the economy and the currency. High Gold reserves can be a source of trust for a country’s solvency. Central banks added 1,136 tonnes of Gold worth around $70 billion to their reserves in 2022, according to data from the World Gold Council. This is the highest yearly purchase since records began. Central banks from emerging economies such as China, India and Turkey are quickly increasing their Gold reserves.
Gold has an inverse correlation with the US Dollar and US Treasuries, which are both major reserve and safe-haven assets. When the Dollar depreciates, Gold tends to rise, enabling investors and central banks to diversify their assets in turbulent times. Gold is also inversely correlated with risk assets. A rally in the stock market tends to weaken Gold price, while sell-offs in riskier markets tend to favor the precious metal.
The price can move due to a wide range of factors. Geopolitical instability or fears of a deep recession can quickly make Gold price escalate due to its safe-haven status. As a yield-less asset, Gold tends to rise with lower interest rates, while higher cost of money usually weighs down on the yellow metal. Still, most moves depend on how the US Dollar (USD) behaves as the asset is priced in dollars (XAU/USD). A strong Dollar tends to keep the price of Gold controlled, whereas a weaker Dollar is likely to push Gold prices up.
-
04:53
GBP/USD Price Forecast: Holds position above 1.3000 near five-month highs
- GBP/USD may target the immediate resistance at the five-month high at 1.3048.
- The 14-day RSI indicates an overbought situation and a potential downward correction.
- The primary support appears at a nine-day EMA of 1.2955.
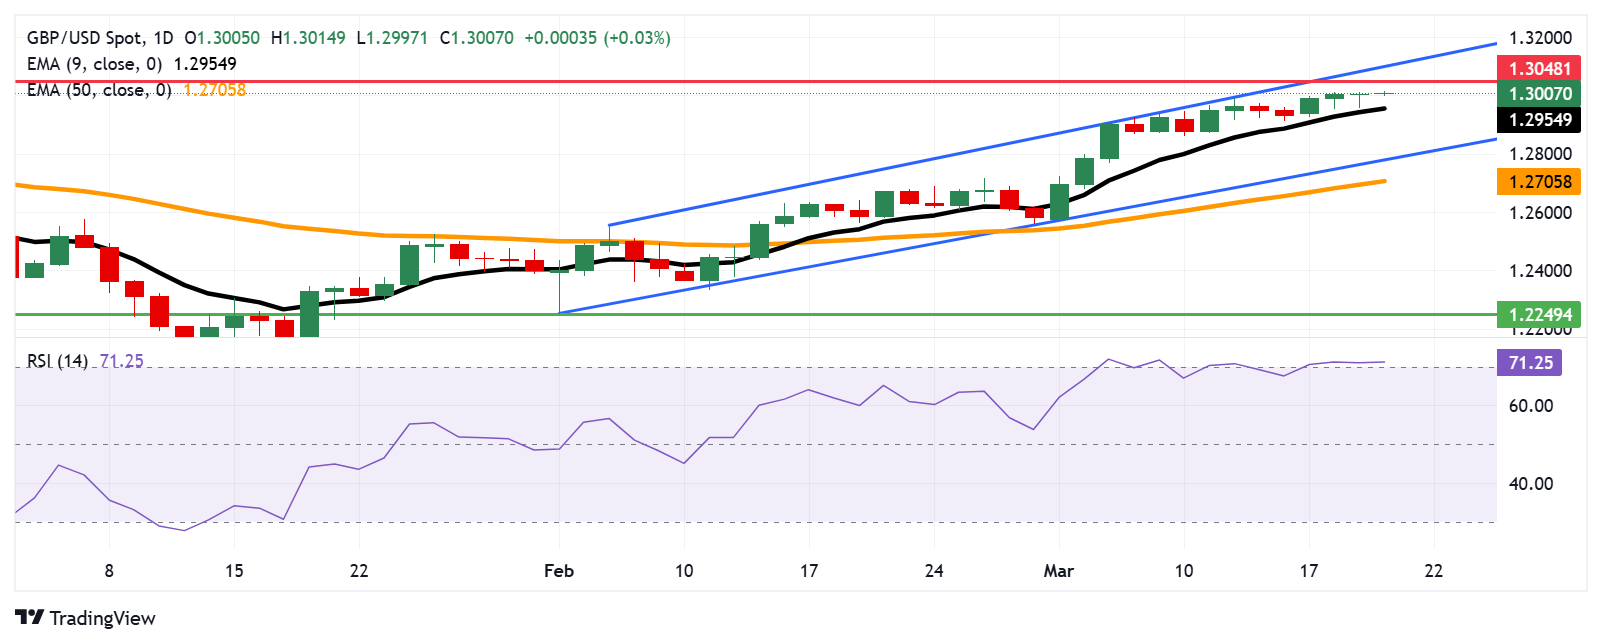
The GBP/USD pair remains in positive territory for the fourth successive session, trading around 1.3010 during the Asian hours on Thursday. Technical analysis of the daily chart indicates a continued bullish bias, with the pair moving upwards within an ascending channel pattern.
The 14-day Relative Strength Index (RSI) is slightly above 70, signaling strong bullish momentum but also suggesting that the GBP/USD pair is overbought, potentially leading to a downward correction.
Moreover, the GBP/USD pair continues to trade above the nine-day Exponential Moving Average (EMA), reinforcing strong short-term price dynamics and confirming the ongoing upward trend.
On the upside, the GBP/USD pair may challenge primary resistance at the five-month high at 1.3048, recorded on November 6, followed by the ascending channel’s upper boundary near 1.3090.
The GBP/USD pair is likely to find immediate support at the nine-day EMA of 1.2954. A break below this level could weaken short-term price momentum, potentially driving the pair toward the ascending channel’s lower boundary near 1.2770, followed by the 50-day EMA at 1.2705.
GBP/USD: Daily Chart
British Pound PRICE Today
The table below shows the percentage change of British Pound (GBP) against listed major currencies today. British Pound was the strongest against the New Zealand Dollar.
USD EUR GBP JPY CAD AUD NZD CHF USD -0.06% -0.02% -0.21% -0.01% 0.20% 0.33% -0.19% EUR 0.06% 0.03% -0.13% 0.05% 0.26% 0.39% -0.14% GBP 0.02% -0.03% -0.17% 0.00% 0.23% 0.36% -0.16% JPY 0.21% 0.13% 0.17% 0.18% 0.39% 0.51% 0.08% CAD 0.00% -0.05% -0.00% -0.18% 0.21% 0.36% -0.18% AUD -0.20% -0.26% -0.23% -0.39% -0.21% 0.14% -0.39% NZD -0.33% -0.39% -0.36% -0.51% -0.36% -0.14% -0.55% CHF 0.19% 0.14% 0.16% -0.08% 0.18% 0.39% 0.55% The heat map shows percentage changes of major currencies against each other. The base currency is picked from the left column, while the quote currency is picked from the top row. For example, if you pick the British Pound from the left column and move along the horizontal line to the US Dollar, the percentage change displayed in the box will represent GBP (base)/USD (quote).
-
04:13
Silver Price Forecast: XAG/USD remains below $34.00 after Fed rate decision
- Silver price faced headwinds as the Fed maintained the federal funds rate at 4.25%–4.5% on Wednesday
- The non-yielding Silver may have found support as US Treasury yields declined.
- Silver lease rates have surged due to shrinking stockpiles in London.
Silver price (XAG/USD) holds onto gains after a previous session of losses, trading around $33.80 per troy ounce during Asian hours on Thursday. However, the non-interest-bearing metal faces pressure following the Federal Reserve’s (Fed) interest rate decision.
As widely expected, the Fed maintained the federal funds rate at 4.25%–4.5% during its March meeting but reaffirmed its outlook for two rate cuts later this year. This stance aligns with forecasts of slower GDP growth and higher unemployment, counterbalancing concerns over rising inflation in the United States (US), potentially driven by aggressive tariffs imposed by President Donald Trump.
Silver, a non-yielding asset, may have found support as US Treasury yields declined, with the 2-year yield at 3.97% and the 10-year yield at 4.24%. Meanwhile, bonds gained traction following the Fed’s decision to slow the pace of quantitative tightening, citing concerns over reduced liquidity and potential risks tied to government debt limits.
Silver lease rates have surged due to shrinking stockpiles, particularly in London, as Silver flows toward the US to capitalize on higher prices. Banks and traders lease Silver to ensure short-term liquidity for trading or operational needs.
This shift has widened price gaps between major markets, with spot silver up 17% this year, outperforming other commodities. Additionally, physical Silver transfers from Canada and Mexico are strained by tariffs, further tightening supply. Growing fears of a “silver squeeze” could disrupt trade for months.
Silver FAQs
Silver is a precious metal highly traded among investors. It has been historically used as a store of value and a medium of exchange. Although less popular than Gold, traders may turn to Silver to diversify their investment portfolio, for its intrinsic value or as a potential hedge during high-inflation periods. Investors can buy physical Silver, in coins or in bars, or trade it through vehicles such as Exchange Traded Funds, which track its price on international markets.
Silver prices can move due to a wide range of factors. Geopolitical instability or fears of a deep recession can make Silver price escalate due to its safe-haven status, although to a lesser extent than Gold's. As a yieldless asset, Silver tends to rise with lower interest rates. Its moves also depend on how the US Dollar (USD) behaves as the asset is priced in dollars (XAG/USD). A strong Dollar tends to keep the price of Silver at bay, whereas a weaker Dollar is likely to propel prices up. Other factors such as investment demand, mining supply – Silver is much more abundant than Gold – and recycling rates can also affect prices.
Silver is widely used in industry, particularly in sectors such as electronics or solar energy, as it has one of the highest electric conductivity of all metals – more than Copper and Gold. A surge in demand can increase prices, while a decline tends to lower them. Dynamics in the US, Chinese and Indian economies can also contribute to price swings: for the US and particularly China, their big industrial sectors use Silver in various processes; in India, consumers’ demand for the precious metal for jewellery also plays a key role in setting prices.
Silver prices tend to follow Gold's moves. When Gold prices rise, Silver typically follows suit, as their status as safe-haven assets is similar. The Gold/Silver ratio, which shows the number of ounces of Silver needed to equal the value of one ounce of Gold, may help to determine the relative valuation between both metals. Some investors may consider a high ratio as an indicator that Silver is undervalued, or Gold is overvalued. On the contrary, a low ratio might suggest that Gold is undervalued relative to Silver.
-
03:59
Japanese Yen hits fresh weekly high against USD amid divergent BoJ-Fed expectations
- The Japanese Yen draws support from BoJ rate hike bets and the global flight to safety.
- Trade jitters and escalating geopolitical tensions continue to benefit safe-haven assets.
- The divergent BoJ-Fed expectations also exert downward pressure on the USD/JPY pair.
The Japanese Yen (JPY) attracts buyers for the second straight day and strengthens to a fresh weekly high against its American counterpart during the Asian session on Thursday. Expectations that strong wage growth could boost consumer spending and contribute to rising inflation give the Bank of Japan (BoJ) headroom to keep hiking interest rates. This led to the recent sharp narrowing of the rate differential between Japan and other countries, which continues to support the lower-yielding JPY.
Apart from this, the uncertainty over US President Donald Trump's trade policies and their impact on the global economy, along with geopolitical risks and the Turkish political crisis, drive some safe-haven flows toward the JPY. The US Dollar (USD), on the other hand, struggles to gain any meaningful traction amid increased economic uncertainty on the back of US President Donald Trump’s trade tariffs. This, in turn, exerts pressure on the USD/JPY pair and contributes to the intraday downfall.
Japanese Yen is underpinned by hawkish BoJ expectations and persistent safe-haven demand
- The Bank of Japan decided to keep its key policy rate steady at the end of a two-day review meeting on Wednesday and noted that the uncertainty surrounding Japan's economy, and prices remains high.
- In the post-meeting presser, BoJ Governor Kazuo Ueda said that the central bank wants to conduct policies before it is too late and that achieving a 2% inflation target is important for long-term credibility.
- The Federal Reserve, as was widely anticipated, also held interest rates steady for the second meeting in a row and signaled that it is likely to deliver two 25 basis points rate cuts by the end of this year.
- Meanwhile, policymakers trimmed their growth forecast for the year amid the growing uncertainty over the impact of US President Donald Trump's aggressive trade policies on economic activity.
- Furthermore, the Fed gave a bump higher to its inflation projection. Traders, however, still see over a 65% chance that the US central bank would resume its rate-cutting cycle at the June policy meeting.
- Ukrainian President Volodymyr Zelenskiy and Trump agreed to work together to end the Russia-Ukraine war. Russian President Vladimir Putin, however, rejected a proposed full 30-day ceasefire.
- The Israeli military said that it launched a limited ground incursion into Gaza, a day after an aerial bombardment of the strip that shattered the two-month-old ceasefire with Hamas.
- Israeli Prime Minister Benjamin Netanyahu warned of fierce war expansion, raising the risk of a further escalation of Middle East tensions and benefiting safe-haven assets, including the Japanese Yen.
USD/JPY seems vulnerable to weaken further and aim to test the 147.75 next relevant support
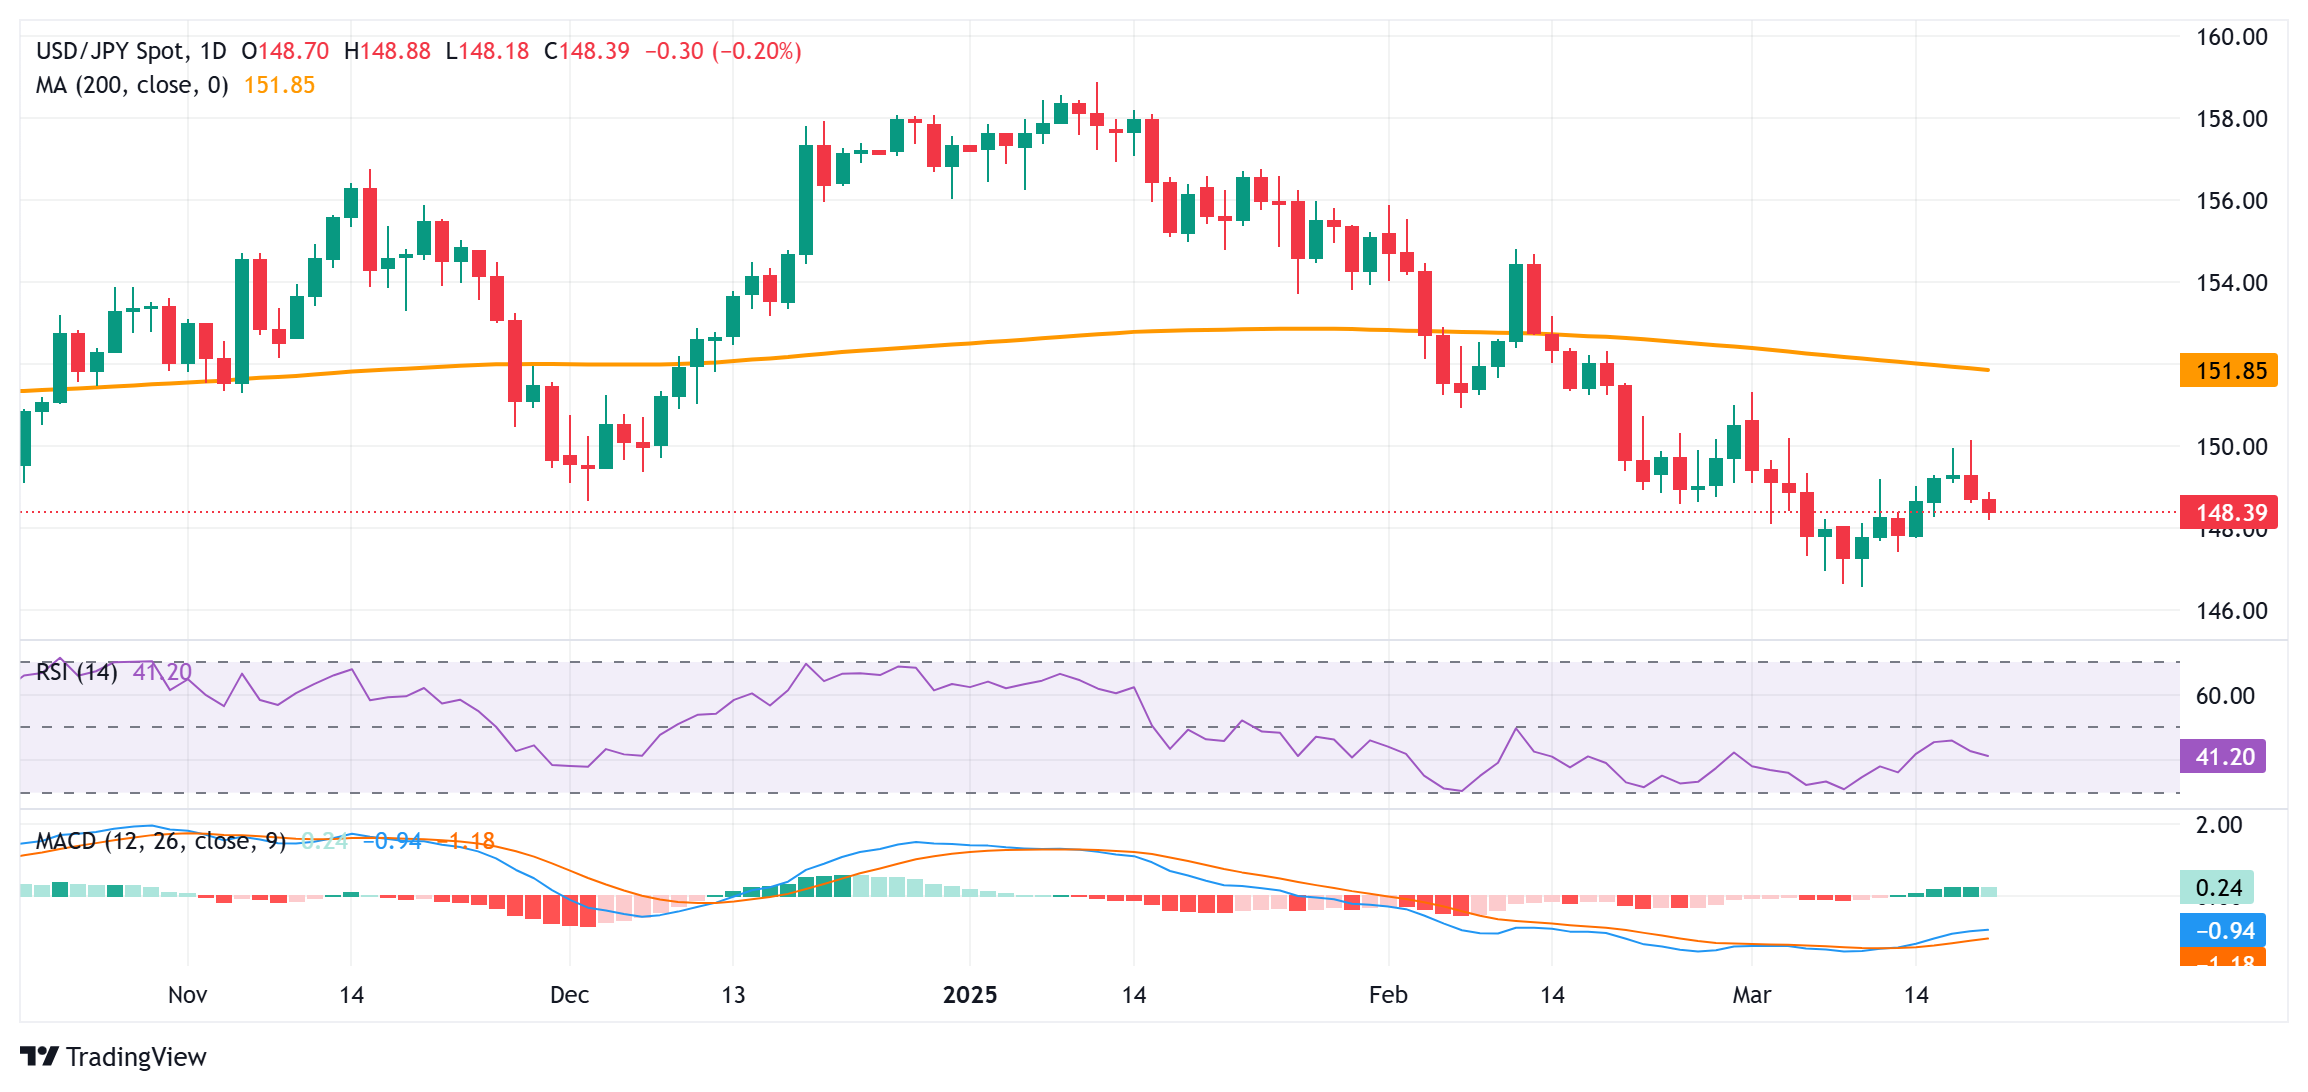
From a technical perspective, the overnight failure to find acceptance above the 150.00 psychological mark and the subsequent decline suggests that the recent bounce from a multi-month low has run out of steam. Moreover, negative oscillators on the daily chart support prospects for a further depreciating move for the USD/JPY pair. Hence, some follow-through weakness below the 148.00 mark, towards the next relevant support near the 147.75 horizontal support, looks like a distinct possibility. The downward trajectory could extend further towards the 147.30 region en route to the 147.00 round figure and the 146.55-146.50 area, or the lowest level since early October touched earlier this month.
On the flip side, any attempted recovery might now confront an immediate hurdle near the Asian session high, just ahead of the 149.00 mark. This is followed by the 149.25-149.30 supply zone, above which the USD/JPY pair could aim to reclaim the 150.00 mark. Some follow-through buying beyond the overnight swing high, around the 150.15 region, could prompt a short-covering rally and lift spot prices to the 150.60 intermediate barrier en route to the 151.00 mark and the monthly peak, around the 151.30 region.
Japanese Yen FAQs
The Japanese Yen (JPY) is one of the world’s most traded currencies. Its value is broadly determined by the performance of the Japanese economy, but more specifically by the Bank of Japan’s policy, the differential between Japanese and US bond yields, or risk sentiment among traders, among other factors.
One of the Bank of Japan’s mandates is currency control, so its moves are key for the Yen. The BoJ has directly intervened in currency markets sometimes, generally to lower the value of the Yen, although it refrains from doing it often due to political concerns of its main trading partners. The BoJ ultra-loose monetary policy between 2013 and 2024 caused the Yen to depreciate against its main currency peers due to an increasing policy divergence between the Bank of Japan and other main central banks. More recently, the gradually unwinding of this ultra-loose policy has given some support to the Yen.
Over the last decade, the BoJ’s stance of sticking to ultra-loose monetary policy has led to a widening policy divergence with other central banks, particularly with the US Federal Reserve. This supported a widening of the differential between the 10-year US and Japanese bonds, which favored the US Dollar against the Japanese Yen. The BoJ decision in 2024 to gradually abandon the ultra-loose policy, coupled with interest-rate cuts in other major central banks, is narrowing this differential.
The Japanese Yen is often seen as a safe-haven investment. This means that in times of market stress, investors are more likely to put their money in the Japanese currency due to its supposed reliability and stability. Turbulent times are likely to strengthen the Yen’s value against other currencies seen as more risky to invest in.
-
03:45
USD/INR remains strong after Fed leaves interest rates unchanged
- The Indian Rupee softens in Thursday’s Asian session.
- A rebound in oil prices and the Fed’s hawkish stance drag the INR lower.
- Investors await the US weekly Initial Jobless Claims data, which is due later on Thursday.
The Indian Rupee (INR) trades in negative territory on Thursday. A rise in Crude Oil prices amid the ongoing geopolitical tensions in the Middle East weighs on the local currency as India is the world's third-largest oil consumer. Furthermore, the more hawkish stance from the US Federal Reserve (Fed) at its March meeting on Wednesday lifts the US Dollar (USD) and undermines the Indian currency.
However, India’s latest current account data, which showed a surplus in February, might help limit the INR’s losses. The Reserve Bank of India (RBI) has likely been "opportunistically" absorbing USD inflows over the past few sessions, probably to replenish the foreign exchange reserve expanded to support the INR over the past few months, according to reports. Looking ahead, the US weekly Initial Jobless Claims will be released later on Thursday, followed by the Philly Fed Manufacturing Index, Existing Home Sales, and the CB Leading Index.Indian Rupee remains fragile amid multiple headwinds
- India's foreign exchange reserves have risen from $624 billion in January to $654 billion by early March, though they remain $50 billion below their peak in October.
- The Fed held rates steady at the 4.25%-4.50% range at the March meeting on Wednesday, as widely anticipated.
- Fed officials still see reducing borrowing costs by half a percentage point by the end of this year due to slowing economic growth and a downturn in inflation.
- Fed Chair Jerome Powell highlighted the high degree of uncertainty from US President Donald Trump’s significant policy changes, adding that the Fed officials can wait for more clarity on the impact of those policies on the economy before acting.
- Powell stated during a press conference, “Labor market conditions are solid, and inflation has moved closer to our 2% longer-run goal, though it remains somewhat elevated.”
USD/INR keeps the bullish vibe in the longer term
The Indian Rupee trades on a softer note on the day. In the longer term, the USD/INR pair maintains its constructive outlook on the daily timeframe. Nonetheless, in the near term, the pair has broken out of a symmetrical triangle, while the 14-day Relative Strength Index (RSI) stands below the midline near 37.00, suggesting that further downside looks favorable.
The 87.00 psychological level appears to be a tough nut to crack for USD/INR. A decisive break above this level could see a rally to 87.38, the high of March 11, en route to 87.53, the high of February 28.
On the downside, the crucial support level is located at 86.00, the round mark and the 100-day EMA. A breach of the mentioned level could attract some sellers and drag the pair lower to 85.60, the low of January 6.Indian Rupee FAQs
The Indian Rupee (INR) is one of the most sensitive currencies to external factors. The price of Crude Oil (the country is highly dependent on imported Oil), the value of the US Dollar – most trade is conducted in USD – and the level of foreign investment, are all influential. Direct intervention by the Reserve Bank of India (RBI) in FX markets to keep the exchange rate stable, as well as the level of interest rates set by the RBI, are further major influencing factors on the Rupee.
The Reserve Bank of India (RBI) actively intervenes in forex markets to maintain a stable exchange rate, to help facilitate trade. In addition, the RBI tries to maintain the inflation rate at its 4% target by adjusting interest rates. Higher interest rates usually strengthen the Rupee. This is due to the role of the ‘carry trade’ in which investors borrow in countries with lower interest rates so as to place their money in countries’ offering relatively higher interest rates and profit from the difference.
Macroeconomic factors that influence the value of the Rupee include inflation, interest rates, the economic growth rate (GDP), the balance of trade, and inflows from foreign investment. A higher growth rate can lead to more overseas investment, pushing up demand for the Rupee. A less negative balance of trade will eventually lead to a stronger Rupee. Higher interest rates, especially real rates (interest rates less inflation) are also positive for the Rupee. A risk-on environment can lead to greater inflows of Foreign Direct and Indirect Investment (FDI and FII), which also benefit the Rupee.
Higher inflation, particularly, if it is comparatively higher than India’s peers, is generally negative for the currency as it reflects devaluation through oversupply. Inflation also increases the cost of exports, leading to more Rupees being sold to purchase foreign imports, which is Rupee-negative. At the same time, higher inflation usually leads to the Reserve Bank of India (RBI) raising interest rates and this can be positive for the Rupee, due to increased demand from international investors. The opposite effect is true of lower inflation.
-
03:39
US President Trump: Federal Reserve would benefit from reducing rates
In his latest post on the Truth Social platform, US President Donald Trump called on the Federal Reserve (Fed) to lower interest rates, as tariffs are hurting the economy.
Key quotes
"The Fed would be MUCH better off CUTTING RATES as US tariffs start to transition (ease!) their way into the economy.”
“Do the right thing.”
“April 2nd is Liberation Day in America!!!"
Market reaction
The US Dollar Index (DXY) loses 0.11% on the day, trading near 103.40, following Trump’s comments.
US Dollar PRICE Today
The table below shows the percentage change of US Dollar (USD) against listed major currencies today. US Dollar was the weakest against the Japanese Yen.
USD EUR GBP JPY CAD AUD NZD CHF USD -0.09% -0.03% -0.31% 0.03% 0.28% 0.37% -0.19% EUR 0.09% 0.05% -0.19% 0.11% 0.38% 0.45% -0.10% GBP 0.03% -0.05% -0.25% 0.05% 0.32% 0.41% -0.15% JPY 0.31% 0.19% 0.25% 0.31% 0.57% 0.63% 0.17% CAD -0.03% -0.11% -0.05% -0.31% 0.26% 0.34% -0.22% AUD -0.28% -0.38% -0.32% -0.57% -0.26% 0.08% -0.47% NZD -0.37% -0.45% -0.41% -0.63% -0.34% -0.08% -0.58% CHF 0.19% 0.10% 0.15% -0.17% 0.22% 0.47% 0.58% The heat map shows percentage changes of major currencies against each other. The base currency is picked from the left column, while the quote currency is picked from the top row. For example, if you pick the US Dollar from the left column and move along the horizontal line to the Japanese Yen, the percentage change displayed in the box will represent USD (base)/JPY (quote).
-
03:30
Commodities. Daily history for Wednesday, March 19, 2025
Raw materials Closed Change, % Silver 33.785 -0.59 Gold 3046.9 0.43 Palladium 958.59 -0.64 -
03:22
AUD/JPY falls to near 94.00 following disappointing Australia’s Employment Change
- AUD/JPY loses ground as Australia’s Employment Change declined by 52.8K in February, missing the expected 30.0K increase.
- The PBOC maintained its one- and five-year Loan Prime Rates (LPRs) at 3.10% and 3.60%, respectively.
- The Japanese Yen strengthens as traders continue to factor in the possibility of a BoJ rate hike in 2025.
AUD/JPY continues its losing streak for the third consecutive session, trading around 94.00 during Asian hours on Thursday. The currency cross weakens as the Australian Dollar (AUD) faces downward pressure following disappointing domestic employment data.
Australia’s Employment Change fell by 52.8K in February, a sharp decline from the revised 44K increase in January and well below the expected 30.0K rise. However, the seasonally adjusted Unemployment Rate remained steady at 4.1%, in line with market expectations.
Meanwhile, in China, a key trading partner for Australia, the People’s Bank of China (PBOC) kept its Loan Prime Rates (LPRs) unchanged on Thursday, maintaining the one-year rate at 3.10% and the five-year rate at 3.60%. Developments in the Chinese economy often influence the China-proxy AUD.
The Japanese Yen (JPY) strengthens, contributing to the decline in the AUD/JPY cross, as traders continue to price in the possibility of a Bank of Japan (BoJ) rate hike in 2025. On Wednesday, the BoJ maintained its short-term interest rate target within the 0.40%-0.50% range.
The BoJ’s Monetary Policy Statement indicated that Japan's economy is experiencing moderate recovery, despite some lingering weaknesses. Consumption gradually increases, and inflation expectations are rising at a measured pace. In a post-meeting press conference, BoJ Governor Kazuo Ueda emphasized that the central bank will adjust its policy to ensure the sustainable and stable achievement of its price targets.
Economic Indicator
Employment Change s.a.
The Employment Change released by the Australian Bureau of Statistics is a measure of the change in the number of employed people in Australia. The statistic is adjusted to remove the influence of seasonal trends. Generally speaking, a rise in Employment Change has positive implications for consumer spending, stimulates economic growth, and is bullish for the Australian Dollar (AUD). A low reading, on the other hand, is seen as bearish.
Read more.Last release: Thu Mar 20, 2025 00:30
Frequency: Monthly
Actual: -52.8K
Consensus: 30K
Previous: 44K
Source: Australian Bureau of Statistics
-
02:43
Australian Dollar declines following employment figures, China’s rate decision
- The Australian Dollar depreciated as Employment Change declined by 52.8K in February, missing the consensus forecast of a 30.0K increase.
- The PBOC kept its Loan Prime Rates (LPRs) unchanged, with the one- and five-year rates at 3.10% and 3.60%, respectively.
- The Fed reaffirmed its expectation of two rate cuts later this year but highlighted uncertainty arising from Trump’s tariff policies.
The Australian Dollar (AUD) weakens against the US Dollar (USD) on Thursday, reversing gains from the previous session. The AUD/USD pair declines as the AUD receives downward pressure following the release of domestic employment data.
Australia’s Employment Change dropped by 52.8K in February against the 30.5K increase in January (revised from 44K), falling short of the consensus forecast of 30.0K rise. Meanwhile, the seasonally adjusted Unemployment Rate remained steady at 4.1% in February, aligning with market expectations.
In China, the People’s Bank of China (PBOC) kept its Loan Prime Rates (LPRs) unchanged on Thursday, with the one-year rate at 3.10% and the five-year rate at 3.60%.
The Federal Reserve maintained the federal funds rate at 4.25%–4.5% in its March meeting, as widely expected. The Fed reaffirmed its outlook for two rate cuts later this year but cited uncertainty stemming from US President Donald Trump’s tariff policies.
Australian Dollar could find support as US Dollar struggles following Fed decision
- The US Dollar Index (DXY), which measures the USD against six major currencies, is trading lower near 103.40. The Greenback faced pressure as yields on US Treasury bonds declined, with the 2-year yield at 3.97% and the 10-year yield at 4.24%.
- However, the US Dollar found some stability after hawkish remarks from Fed Chair Jerome Powell, who stated, “Labor market conditions are solid, and inflation has moved closer to our 2% longer-run goal, though it remains somewhat elevated.”
- President Trump and Russian President Vladimir Putin, on Tuesday, agreed to an immediate pause in strikes targeting energy infrastructure in the Ukraine war. In a Truth Social post following his call with Putin, Trump stated that both sides had committed to a 30-day halt on attacks against each other's energy infrastructure, mirroring statements from the Kremlin.
- Putin declined to endorse a broader month-long ceasefire negotiated by Trump’s team with Ukrainian officials in Saudi Arabia, signaling continued tensions despite the temporary agreement on energy targets.
- Trump reaffirmed plans to impose reciprocal and sectoral tariffs on April 2. Trump confirmed that there would be no exemptions for steel and aluminum and mentioned that reciprocal tariffs on specific countries would be implemented alongside auto duties.
- According to Reuters, Trump’s proposal to boost US shipbuilding by imposing steep fees on China-linked vessels entering American ports is causing a buildup of US coal inventories and increasing uncertainty in the already struggling agriculture sector.
- Treasurer Jim Chalmers addressed trade tensions in a speech on Tuesday, rejecting a "race to the bottom" on tariffs. Chalmers criticized the Trump administration’s trade policies as "self-defeating and self-sabotaging," emphasizing Australia’s need to focus on economic resilience rather than retaliation. He also condemned the US decision to exclude Australia from steel and aluminum tariff exemptions, calling it "disappointing, unnecessary, senseless, and wrong," as per "The Guardian".
- On Monday, Reserve Bank of Australia (RBA) Assistant Governor (Economic) Sarah Hunter reiterated the central bank’s cautious stance on rate cuts. The RBA’s February statement signaled a more conservative approach than market expectations, with a strong focus on monitoring US policy decisions and their potential impact on Australia’s inflation outlook.
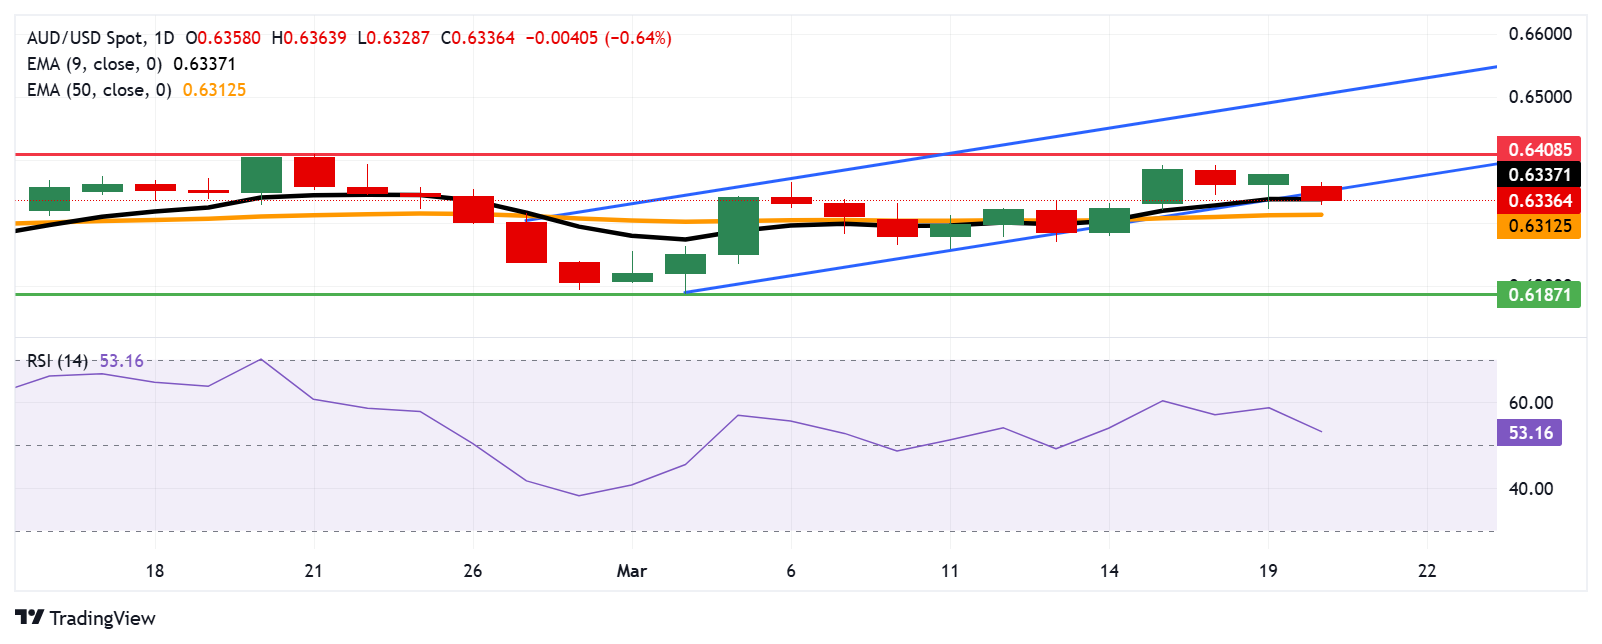
Australian Dollar breaks below 0.6350, ascending channel’s lower boundary
AUD/USD is trading near 0.6330 on Thursday, with technical analysis suggesting a weakening bullish bias as the pair breaks below the ascending channel pattern. However, the 14-day Relative Strength Index (RSI) remains above 50, indicating that bullish momentum is still in play.
The pair may attempt to surpass the immediate resistance at the nine-day Exponential Moving Average (EMA) of 0.6337, which aligns with the lower boundary of the ascending channel. A return to the channel could reinforce the bullish outlook, potentially leading AUD/USD to retest its three-month high of 0.6408, last reached on February 21. Further resistance is seen at the upper boundary of the channel near 0.6490.
On the downside, immediate support lies at the 50-day EMA at 0.6312. A decisive break below this key level could weaken the medium-term price momentum, exposing the AUD/USD pair to further downside pressure toward the six-week low of 0.6187, recorded on March 5.
AUD/USD: Daily Chart
Australian Dollar PRICE Today
The table below shows the percentage change of Australian Dollar (AUD) against listed major currencies today. Australian Dollar was the weakest against the Japanese Yen.
USD EUR GBP JPY CAD AUD NZD CHF USD -0.05% -0.01% -0.30% 0.02% 0.32% 0.36% -0.15% EUR 0.05% 0.03% -0.23% 0.06% 0.36% 0.41% -0.10% GBP 0.00% -0.03% -0.25% 0.02% 0.33% 0.38% -0.13% JPY 0.30% 0.23% 0.25% 0.30% 0.59% 0.62% 0.21% CAD -0.02% -0.06% -0.02% -0.30% 0.31% 0.35% -0.17% AUD -0.32% -0.36% -0.33% -0.59% -0.31% 0.05% -0.46% NZD -0.36% -0.41% -0.38% -0.62% -0.35% -0.05% -0.54% CHF 0.15% 0.10% 0.13% -0.21% 0.17% 0.46% 0.54% The heat map shows percentage changes of major currencies against each other. The base currency is picked from the left column, while the quote currency is picked from the top row. For example, if you pick the Australian Dollar from the left column and move along the horizontal line to the US Dollar, the percentage change displayed in the box will represent AUD (base)/USD (quote).
Economic Indicator
Employment Change s.a.
The Employment Change released by the Australian Bureau of Statistics is a measure of the change in the number of employed people in Australia. The statistic is adjusted to remove the influence of seasonal trends. Generally speaking, a rise in Employment Change has positive implications for consumer spending, stimulates economic growth, and is bullish for the Australian Dollar (AUD). A low reading, on the other hand, is seen as bearish.
Read more.Last release: Thu Mar 20, 2025 00:30
Frequency: Monthly
Actual: -52.8K
Consensus: 30K
Previous: 44K
Source: Australian Bureau of Statistics
-
02:34
WTI rises above $67.00 on geopolitical risks, Fed rate decision might cap gains
- WTI price drifts higher to $67.20 in Thursday’s early Asian session.
- The Israeli military resumed ground operations in central and southern Gaza, underpinning the WTI price.
- Crude oil stockpiles in the US rose by 1.745 million barrels last week, according to the EIA.
West Texas Intermediate (WTI), the US crude oil benchmark, is trading around $67.20 during the early Asian session on Thursday. The WTI price edges higher amid the ongoing geopolitical tensions in the Middle East. However, the Federal Reserve's (Fed) decision to hold interest rates steady might cap the upside for WTI price.
The Israeli military resumed ground operations in the central and southern Gaza Strip. US President Donald Trump threatened to continue his country’s attack on Yemen's Houthis and said he would hold Iran responsible for any attacks carried out by the group that has disrupted shipping in the Red Sea. The Red Sea disruption has caused an increase in energy transportation prices and the WTI price since oil and gas cargo shipments have been forced to take longer routes.
"Traders are being forced to refocus on Mideast geopolitical risks as Israel and the United States launch attacks on Gaza and Yemen, respectively," said Clay Seigle, senior fellow for energy security at the Center for Strategic and International Studies.
Crude Oil inventories climbed last week. The US Energy Information Administration (EIA) weekly report showed crude oil stockpiles in the United States for the week ending March 14 rose by 1.745 million barrels, compared to an increase of 1.448 million barrels in the previous week. The market consensus estimated that stocks would increase by 1.17 million barrels.
The US Federal Reserve (Fed) held rates steady at the 4.25%-4.50% range at the March meeting on Wednesday, as widely anticipated. Nonetheless, Fed officials still see reducing borrowing costs by half a percentage point by the end of this year due to slowing economic growth and a downturn in inflation. This, in turn, raises concerns about slower energy demand and weighs on WTI price.WTI Oil FAQs
WTI Oil is a type of Crude Oil sold on international markets. The WTI stands for West Texas Intermediate, one of three major types including Brent and Dubai Crude. WTI is also referred to as “light” and “sweet” because of its relatively low gravity and sulfur content respectively. It is considered a high quality Oil that is easily refined. It is sourced in the United States and distributed via the Cushing hub, which is considered “The Pipeline Crossroads of the World”. It is a benchmark for the Oil market and WTI price is frequently quoted in the media.
Like all assets, supply and demand are the key drivers of WTI Oil price. As such, global growth can be a driver of increased demand and vice versa for weak global growth. Political instability, wars, and sanctions can disrupt supply and impact prices. The decisions of OPEC, a group of major Oil-producing countries, is another key driver of price. The value of the US Dollar influences the price of WTI Crude Oil, since Oil is predominantly traded in US Dollars, thus a weaker US Dollar can make Oil more affordable and vice versa.
The weekly Oil inventory reports published by the American Petroleum Institute (API) and the Energy Information Agency (EIA) impact the price of WTI Oil. Changes in inventories reflect fluctuating supply and demand. If the data shows a drop in inventories it can indicate increased demand, pushing up Oil price. Higher inventories can reflect increased supply, pushing down prices. API’s report is published every Tuesday and EIA’s the day after. Their results are usually similar, falling within 1% of each other 75% of the time. The EIA data is considered more reliable, since it is a government agency.
OPEC (Organization of the Petroleum Exporting Countries) is a group of 12 Oil-producing nations who collectively decide production quotas for member countries at twice-yearly meetings. Their decisions often impact WTI Oil prices. When OPEC decides to lower quotas, it can tighten supply, pushing up Oil prices. When OPEC increases production, it has the opposite effect. OPEC+ refers to an expanded group that includes ten extra non-OPEC members, the most notable of which is Russia.
-
02:17
PBOC sets USD/CNY reference rate at 7.1754 vs. 7.1697 previous
The People’s Bank of China (PBOC) set the USD/CNY central rate for the trading session ahead on Thursday at 7.1754 as compared to the previous day's fix of 7.1697 and 7.2402 Reuters estimate.
PBOC FAQs
The primary monetary policy objectives of the People's Bank of China (PBoC) are to safeguard price stability, including exchange rate stability, and promote economic growth. China’s central bank also aims to implement financial reforms, such as opening and developing the financial market.
The PBoC is owned by the state of the People's Republic of China (PRC), so it is not considered an autonomous institution. The Chinese Communist Party (CCP) Committee Secretary, nominated by the Chairman of the State Council, has a key influence on the PBoC’s management and direction, not the governor. However, Mr. Pan Gongsheng currently holds both of these posts.
Unlike the Western economies, the PBoC uses a broader set of monetary policy instruments to achieve its objectives. The primary tools include a seven-day Reverse Repo Rate (RRR), Medium-term Lending Facility (MLF), foreign exchange interventions and Reserve Requirement Ratio (RRR). However, The Loan Prime Rate (LPR) is China’s benchmark interest rate. Changes to the LPR directly influence the rates that need to be paid in the market for loans and mortgages and the interest paid on savings. By changing the LPR, China’s central bank can also influence the exchange rates of the Chinese Renminbi.
Yes, China has 19 private banks – a small fraction of the financial system. The largest private banks are digital lenders WeBank and MYbank, which are backed by tech giants Tencent and Ant Group, per The Straits Times. In 2014, China allowed domestic lenders fully capitalized by private funds to operate in the state-dominated financial sector.
-
02:04
PBOC leaves Loan Prime Rates unchanged in March
The People’s Bank of China (PBOC), China's central bank, announced to leave its Loan Prime Rates (LPRs) unchanged on Thursday. The one-year and five-year LPRs were at 3.10% and 3.60%, respectively.
Market reaction
At the time of writing, the AUD/USD pair is trading 0.64% lower on the day to trade at 0.6336.
PBOC FAQs
The primary monetary policy objectives of the People's Bank of China (PBoC) are to safeguard price stability, including exchange rate stability, and promote economic growth. China’s central bank also aims to implement financial reforms, such as opening and developing the financial market.
The PBoC is owned by the state of the People's Republic of China (PRC), so it is not considered an autonomous institution. The Chinese Communist Party (CCP) Committee Secretary, nominated by the Chairman of the State Council, has a key influence on the PBoC’s management and direction, not the governor. However, Mr. Pan Gongsheng currently holds both of these posts.
Unlike the Western economies, the PBoC uses a broader set of monetary policy instruments to achieve its objectives. The primary tools include a seven-day Reverse Repo Rate (RRR), Medium-term Lending Facility (MLF), foreign exchange interventions and Reserve Requirement Ratio (RRR). However, The Loan Prime Rate (LPR) is China’s benchmark interest rate. Changes to the LPR directly influence the rates that need to be paid in the market for loans and mortgages and the interest paid on savings. By changing the LPR, China’s central bank can also influence the exchange rates of the Chinese Renminbi.
Yes, China has 19 private banks – a small fraction of the financial system. The largest private banks are digital lenders WeBank and MYbank, which are backed by tech giants Tencent and Ant Group, per The Straits Times. In 2014, China allowed domestic lenders fully capitalized by private funds to operate in the state-dominated financial sector.
-
02:00
China PBoC Interest Rate Decision in line with forecasts (3.1%)
-
01:39
Australia Part-Time Employment dipped from previous -10.1K to -17K in February
-
01:39
Australia Part-Time Employment dipped from previous -10.1K to -17K in February
-
01:39
Australia Part-Time Employment up to 17K in February from previous -10.1K
-
01:39
Australia Part-Time Employment up to 17K in February from previous -10.1K
-
01:32
Breaking: Australia’s Unemployment Rate steadies at 4.1% in February vs. 4.1% expected
Australia’s Unemployment Rate steadied at 4.1% in in February from 4.1% in January, according to the official data released by the Australian Bureau of Statistics (ABS) on Thursday. The figure came in line with the market consensus.
Furthermore, the Australian Employment Change arrived at -52.8K in February from 30.5K in January (revised from 44K), compared with the consensus forecast of 30K.
The participation rate in Australia declined to 66.8% in February, compared to 67.2% in February (revised from 67.3%). Meanwhile, Full-Time Employment decreased by 35.7K in the same period from a rise of 36.9K in the previous reading (revised from 54.1K). The Part-Time Employment decreased by 17K in February versus -6.5K prior (revised from -10.1K).Market reaction to the Australia’s employment data
The Australian Dollar (AUD) attracts some sellers following the employment data. At the time of writing, the AUD/USD pair is trading 0.52% lower on the day to trade at 0.6343.
Employment FAQs
Labor market conditions are a key element to assess the health of an economy and thus a key driver for currency valuation. High employment, or low unemployment, has positive implications for consumer spending and thus economic growth, boosting the value of the local currency. Moreover, a very tight labor market – a situation in which there is a shortage of workers to fill open positions – can also have implications on inflation levels and thus monetary policy as low labor supply and high demand leads to higher wages.
The pace at which salaries are growing in an economy is key for policymakers. High wage growth means that households have more money to spend, usually leading to price increases in consumer goods. In contrast to more volatile sources of inflation such as energy prices, wage growth is seen as a key component of underlying and persisting inflation as salary increases are unlikely to be undone. Central banks around the world pay close attention to wage growth data when deciding on monetary policy.
The weight that each central bank assigns to labor market conditions depends on its objectives. Some central banks explicitly have mandates related to the labor market beyond controlling inflation levels. The US Federal Reserve (Fed), for example, has the dual mandate of promoting maximum employment and stable prices. Meanwhile, the European Central Bank’s (ECB) sole mandate is to keep inflation under control. Still, and despite whatever mandates they have, labor market conditions are an important factor for policymakers given its significance as a gauge of the health of the economy and their direct relationship to inflation.
-
01:30
Australia Unemployment Rate s.a. in line with forecasts (4.1%) in February
-
01:30
Australia Unemployment Rate s.a. in line with forecasts (4.1%) in February
-
01:30
Australia Participation Rate came in at 66.8%, below expectations (67.3%) in February
-
01:30
Australia Participation Rate came in at 66.8%, below expectations (67.3%) in February
-
01:30
Australia Employment Change s.a. below expectations (30K) in February: Actual (-52.8K)
-
01:30
Australia Employment Change s.a. below expectations (30K) in February: Actual (-52.8K)
-
01:30
Stocks. Daily history for Wednesday, March 19, 2025
Index Change, points Closed Change, % NIKKEI 225 -93.54 37751.88 -0.25 Hang Seng 30.57 24771.14 0.12 KOSPI 16.28 2628.62 0.62 ASX 200 -32.1 7828.3 -0.41 DAX -92.64 23288.06 -0.4 CAC 40 56.9 8171.47 0.7 Dow Jones 383.32 41964.63 0.92 S&P 500 60.63 5675.29 1.08 NASDAQ Composite 246.67 17750.79 1.41 -
01:30
Australia Full-Time Employment dipped from previous 54.1K to -35.7K in February
-
01:30
Australia Full-Time Employment dipped from previous 54.1K to -35.7K in February
-
01:15
Currencies. Daily history for Wednesday, March 19, 2025
Pare Closed Change, % AUDUSD 0.63586 -0.04 EURJPY 162.256 -0.66 EURUSD 1.09033 -0.37 GBPJPY 193.497 -0.26 GBPUSD 1.30022 0.01 NZDUSD 0.5821 0.04 USDCAD 1.43184 0.13 USDCHF 0.8775 0.1 USDJPY 148.803 -0.28 -
01:11
NZD/USD gathers strength above 0.5800 as New Zealand exits recession
- NZD/USD drifts higher to near 0.5820 in Wednesday's early Asian session.
- New Zealand’s GDP rose 0.7% QoQ in Q4, stronger than expected.
- Fed held interest rates steady and still sees two reductions coming this year.
The NZD/USD pair trades in a positive territory around 0.5820 during the early Asian session on Thursday. The New Zealand Dollar (NZD) gains ground after the stronger-than-expected growth data in the fourth quarter of 2024. However, the upside for the pair might be limited as the Federal Reserve (Fed) maintained its interest rates at its meeting, which supports the Greenback.
Data released by Statistics New Zealand on Thursday showed that New Zealand's Gross Domestic Product (GDP) grew by 0.7% QoQ in the fourth quarter (Q4) versus -1.1% prior (revised from -1.0%). This reading came in above the consensus of 0.4%. The annual Q4 GDP contracted by 1.1%, following a decline of 0.3% in Q3, while beating the estimation of a 1.4% fall. Kiwibank chief economist Jarrod Kerr said New Zealand was crawling out of recession. The Kiwi trades slightly firmer in an immediate reaction to the upbeat GDP data.
The Fed kept the federal funds rate at a range of 4.25% to 4.5% at its March meeting on Wednesday, as widely expected. That said, the US central bank maintained its outlook at two rate cuts coming in the remainder of this year, citing the uncertainty from US President Donald Trump’s tariff policies.
During a press conference, Federal Chair Jerome Powell noted, “Labor market conditions are solid, and inflation has moved closer to our 2% longer-run goal, though it remains somewhat elevated.” The more hawkish comments from the Fed officials could support the Greenback and act as a headwind for the NZD/USD pair in the near term.New Zealand Dollar FAQs
The New Zealand Dollar (NZD), also known as the Kiwi, is a well-known traded currency among investors. Its value is broadly determined by the health of the New Zealand economy and the country’s central bank policy. Still, there are some unique particularities that also can make NZD move. The performance of the Chinese economy tends to move the Kiwi because China is New Zealand’s biggest trading partner. Bad news for the Chinese economy likely means less New Zealand exports to the country, hitting the economy and thus its currency. Another factor moving NZD is dairy prices as the dairy industry is New Zealand’s main export. High dairy prices boost export income, contributing positively to the economy and thus to the NZD.
The Reserve Bank of New Zealand (RBNZ) aims to achieve and maintain an inflation rate between 1% and 3% over the medium term, with a focus to keep it near the 2% mid-point. To this end, the bank sets an appropriate level of interest rates. When inflation is too high, the RBNZ will increase interest rates to cool the economy, but the move will also make bond yields higher, increasing investors’ appeal to invest in the country and thus boosting NZD. On the contrary, lower interest rates tend to weaken NZD. The so-called rate differential, or how rates in New Zealand are or are expected to be compared to the ones set by the US Federal Reserve, can also play a key role in moving the NZD/USD pair.
Macroeconomic data releases in New Zealand are key to assess the state of the economy and can impact the New Zealand Dollar’s (NZD) valuation. A strong economy, based on high economic growth, low unemployment and high confidence is good for NZD. High economic growth attracts foreign investment and may encourage the Reserve Bank of New Zealand to increase interest rates, if this economic strength comes together with elevated inflation. Conversely, if economic data is weak, NZD is likely to depreciate.
The New Zealand Dollar (NZD) tends to strengthen during risk-on periods, or when investors perceive that broader market risks are low and are optimistic about growth. This tends to lead to a more favorable outlook for commodities and so-called ‘commodity currencies’ such as the Kiwi. Conversely, NZD tends to weaken at times of market turbulence or economic uncertainty as investors tend to sell higher-risk assets and flee to the more-stable safe havens.
-
01:10
EUR/USD holds steady after Fed treads water on rates
- EUR/USD remains hobbled on the south side of 1.1000.
- The Fed held interest rate steady, as investors expected.
- Despite downside risks to growth and inflation, Fed still sees rate cuts in 2025.
EUR/USD remained bolstered above the 1.0900 handle on Wednesday, propped up by a general easing in Greenback flows after the Federal Reserve (Fed) met markets in the middle and held rates steady for another meeting. Fed Chair Jerome Powell noted that growth projections for 2025 have been significantly hindered by the Trump administration's erratic policy of announcing trade tariffs on social media only to later retract them. As a result, the Federal Open Market Committee (FOMC) revised its end-2025 Gross Domestic Product (GDP) forecast to 1.7%, a sharp decline from the 2.1% estimate shared in December.
Fed's Powell: We are not going to be in any hurry to move on rate cuts
Additionally, the median dot plot suggests that the end-2025 interest rate will remain at 3.9%, indicating little change since the last policy meeting. The FOMC plans to begin slowing down its balance sheet runoff starting in April. Rate markets continue to signal a greater than 50% chance of a quarter-point rate cut in June, with most rate traders assigning a 65% probability of a quarter-point or larger cut on June 18.
Despite rising risks to the US economy from lagging growth metrics and increasing concerns that the US's erratic tariff policy could trigger both new inflation and an economic recession simultaneously, Fed Chair Jerome Powell stated on Wednesday that the current economic outlook remains generally healthy, and the Fed is not in a hurry to alter its expectations of at least two more rate cuts later in the year.
European Central Bank (ECB) President Christine Lagarde will be making an appearance on Thursday, and the latest round of the EU’s Leadership Summit also kicks off. ECB talking points are highly unlikely to produce nearly as many sparks as the Fed’s outing on Wednesday, so Fiber impacts are set to remain muted.
EUR/USD price forecast
From a technical viewpoint, the Stochastic Oscillator is currently in overbought territory above 80.00, though it is showing signs of flattening, indicating a reduction in bullish momentum. Meanwhile, the Moving Average Convergence Divergence (MACD) displays flat green bars, suggesting a lack of strong trend conviction. Collectively, these indicators imply that the pair may enter a consolidation phase prior to making a definitive move.
Looking ahead, resistance is positioned at the 1.1000 level, which has historically served as a significant barrier. On the downside, initial support can be found around 1.0850, with more substantial support near the 20-day moving average close to 1.0800. A decline below these thresholds could trigger a corrective reaction, while consistent trading above 1.0900 would maintain the overall bullish outlook.
EUR/USD daily chart
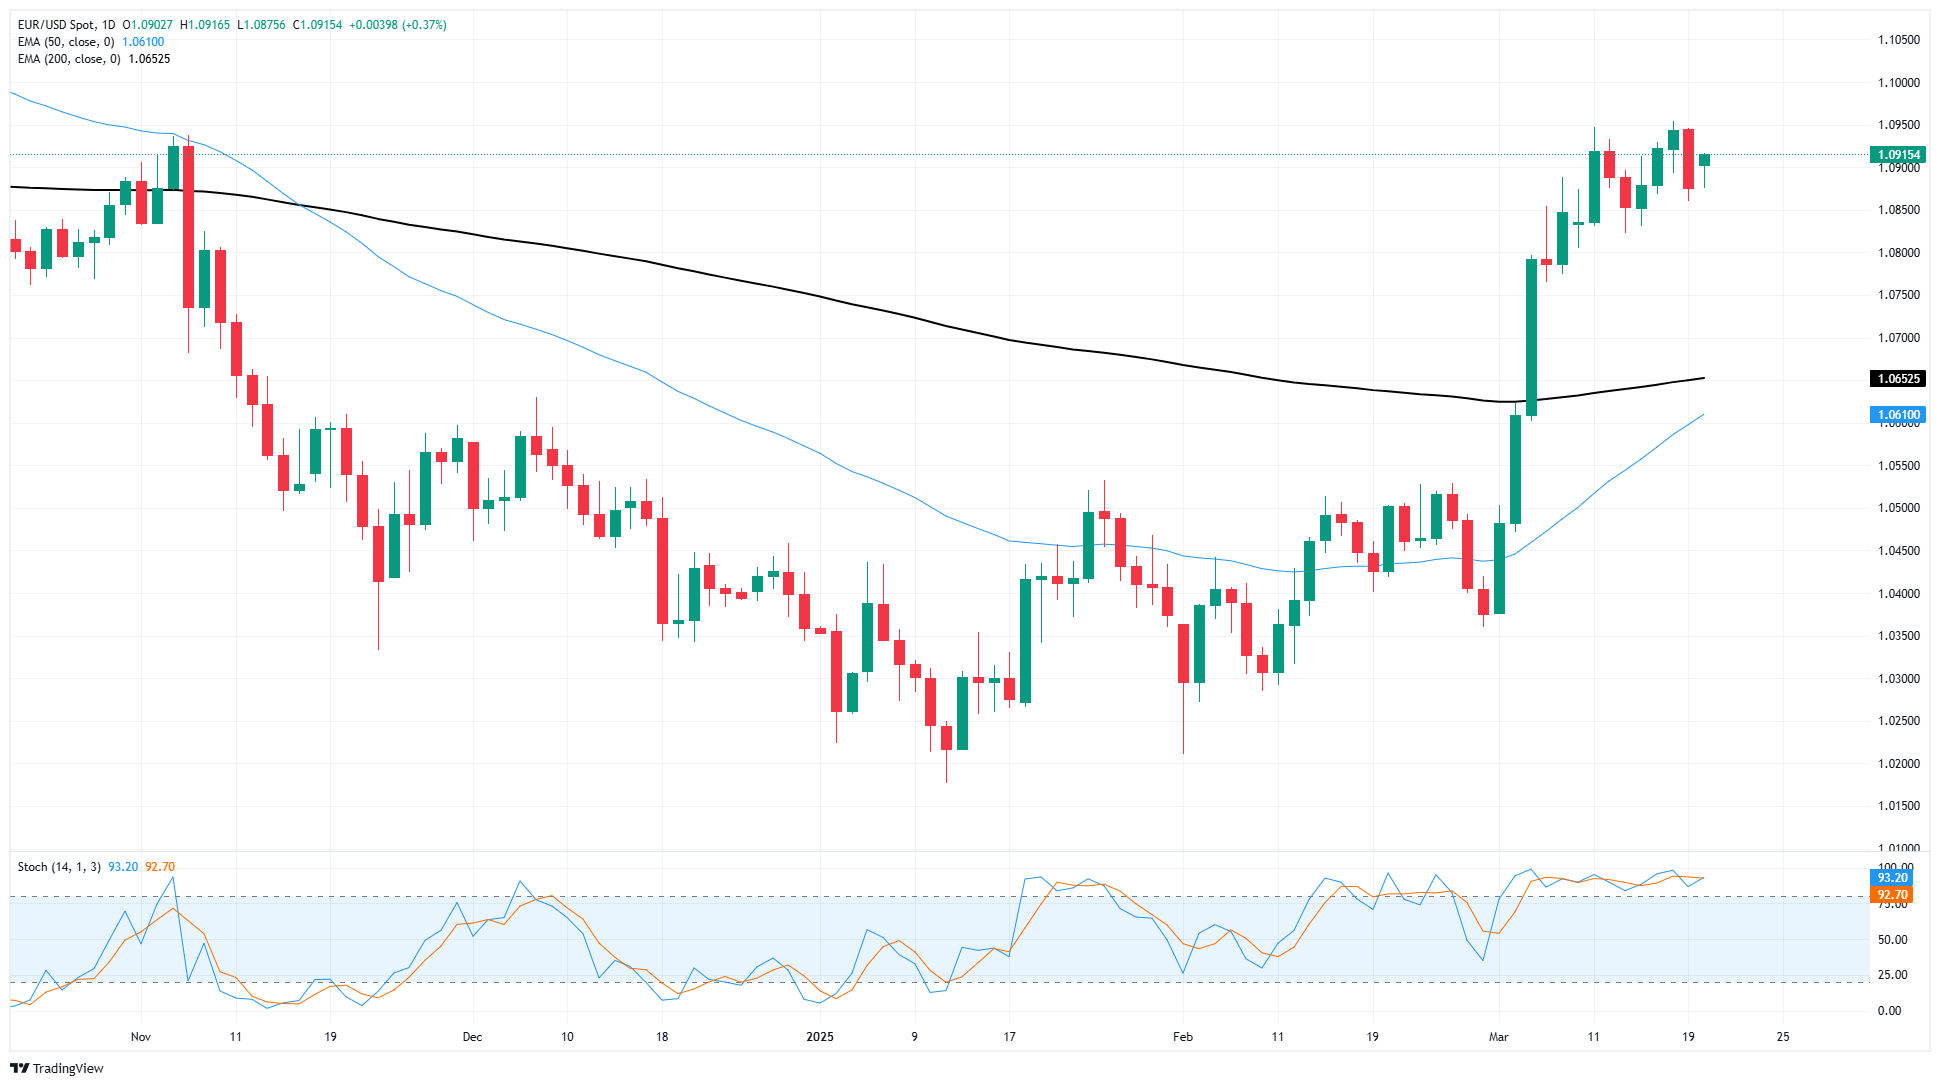
Euro FAQs
The Euro is the currency for the 19 European Union countries that belong to the Eurozone. It is the second most heavily traded currency in the world behind the US Dollar. In 2022, it accounted for 31% of all foreign exchange transactions, with an average daily turnover of over $2.2 trillion a day. EUR/USD is the most heavily traded currency pair in the world, accounting for an estimated 30% off all transactions, followed by EUR/JPY (4%), EUR/GBP (3%) and EUR/AUD (2%).
The European Central Bank (ECB) in Frankfurt, Germany, is the reserve bank for the Eurozone. The ECB sets interest rates and manages monetary policy. The ECB’s primary mandate is to maintain price stability, which means either controlling inflation or stimulating growth. Its primary tool is the raising or lowering of interest rates. Relatively high interest rates – or the expectation of higher rates – will usually benefit the Euro and vice versa. The ECB Governing Council makes monetary policy decisions at meetings held eight times a year. Decisions are made by heads of the Eurozone national banks and six permanent members, including the President of the ECB, Christine Lagarde.
Eurozone inflation data, measured by the Harmonized Index of Consumer Prices (HICP), is an important econometric for the Euro. If inflation rises more than expected, especially if above the ECB’s 2% target, it obliges the ECB to raise interest rates to bring it back under control. Relatively high interest rates compared to its counterparts will usually benefit the Euro, as it makes the region more attractive as a place for global investors to park their money.
Data releases gauge the health of the economy and can impact on the Euro. Indicators such as GDP, Manufacturing and Services PMIs, employment, and consumer sentiment surveys can all influence the direction of the single currency. A strong economy is good for the Euro. Not only does it attract more foreign investment but it may encourage the ECB to put up interest rates, which will directly strengthen the Euro. Otherwise, if economic data is weak, the Euro is likely to fall. Economic data for the four largest economies in the euro area (Germany, France, Italy and Spain) are especially significant, as they account for 75% of the Eurozone’s economy.
Another significant data release for the Euro is the Trade Balance. This indicator measures the difference between what a country earns from its exports and what it spends on imports over a given period. If a country produces highly sought after exports then its currency will gain in value purely from the extra demand created from foreign buyers seeking to purchase these goods. Therefore, a positive net Trade Balance strengthens a currency and vice versa for a negative balance.
-
00:48
GBP/USD remains attached to 1.3000 after Fed rate hold
- GBP/USD continues to anchor near 1.3000 after Fed keeps rates steady.
- Despite generally acknowledging that risks have increased, the Fed is still set to deliver two more rate cuts in 2025.
- Markets are betting that the next quarter-point rate trim will come in June.
GBP/USD remained pinned to recent highs near the 1.3000 handle on Wednesday, with market sentiment bolstered into the high side after the Federal Reserve (Fed) held steady on its plans to deliver more rate cuts in 2025, albeit later in the year. Rate markets are still pricing in another quarter-point cut from the Fed at the US central bank’s June meeting, and Fed Chair Jerome Powell reiterated that the Fed still strong growth and a healthy labor market underpinning the US economy.
However, not all is rosy in the Fed’s outlook: Fed policymakers have trimmed their growth outlook for the year, with US Gross Domestic Product (GDP) growth to slow to just 1.7% through 2025, several points below December’s forecast of 2.1%. Fed Chair Powell also nodded a head at downside risks at the hands of the Trump administration’s trade policies, however the Fed thus far continues to bet that inflationary effects from global tariff-fueled trade wars will be mild and temporary.
The Bank of England (BoE) is up next with their own interest rate call during Thursday’s European market session. Market fireworks will be notably thinner as the BoE is slated to again stand pat on interest rates for the time being.
Friday will close out the week with mid-tier UK GfK Consumer Confidence, expected to dip further into the negative and forecast to clock in at -21.0 versus the previous print of -20.0.
GBP/USD price forecast
GBP/USD continues to churn chart paper at the top end of near-term price action. Bids remain trapped near the 1.3000 major technical handle, and Cable is on pace to close higher for a third straight week.
The pair is trading into four-month highs, a mere third of a percent away from cracking into its highest levels since last October.GBP/USD daily chart
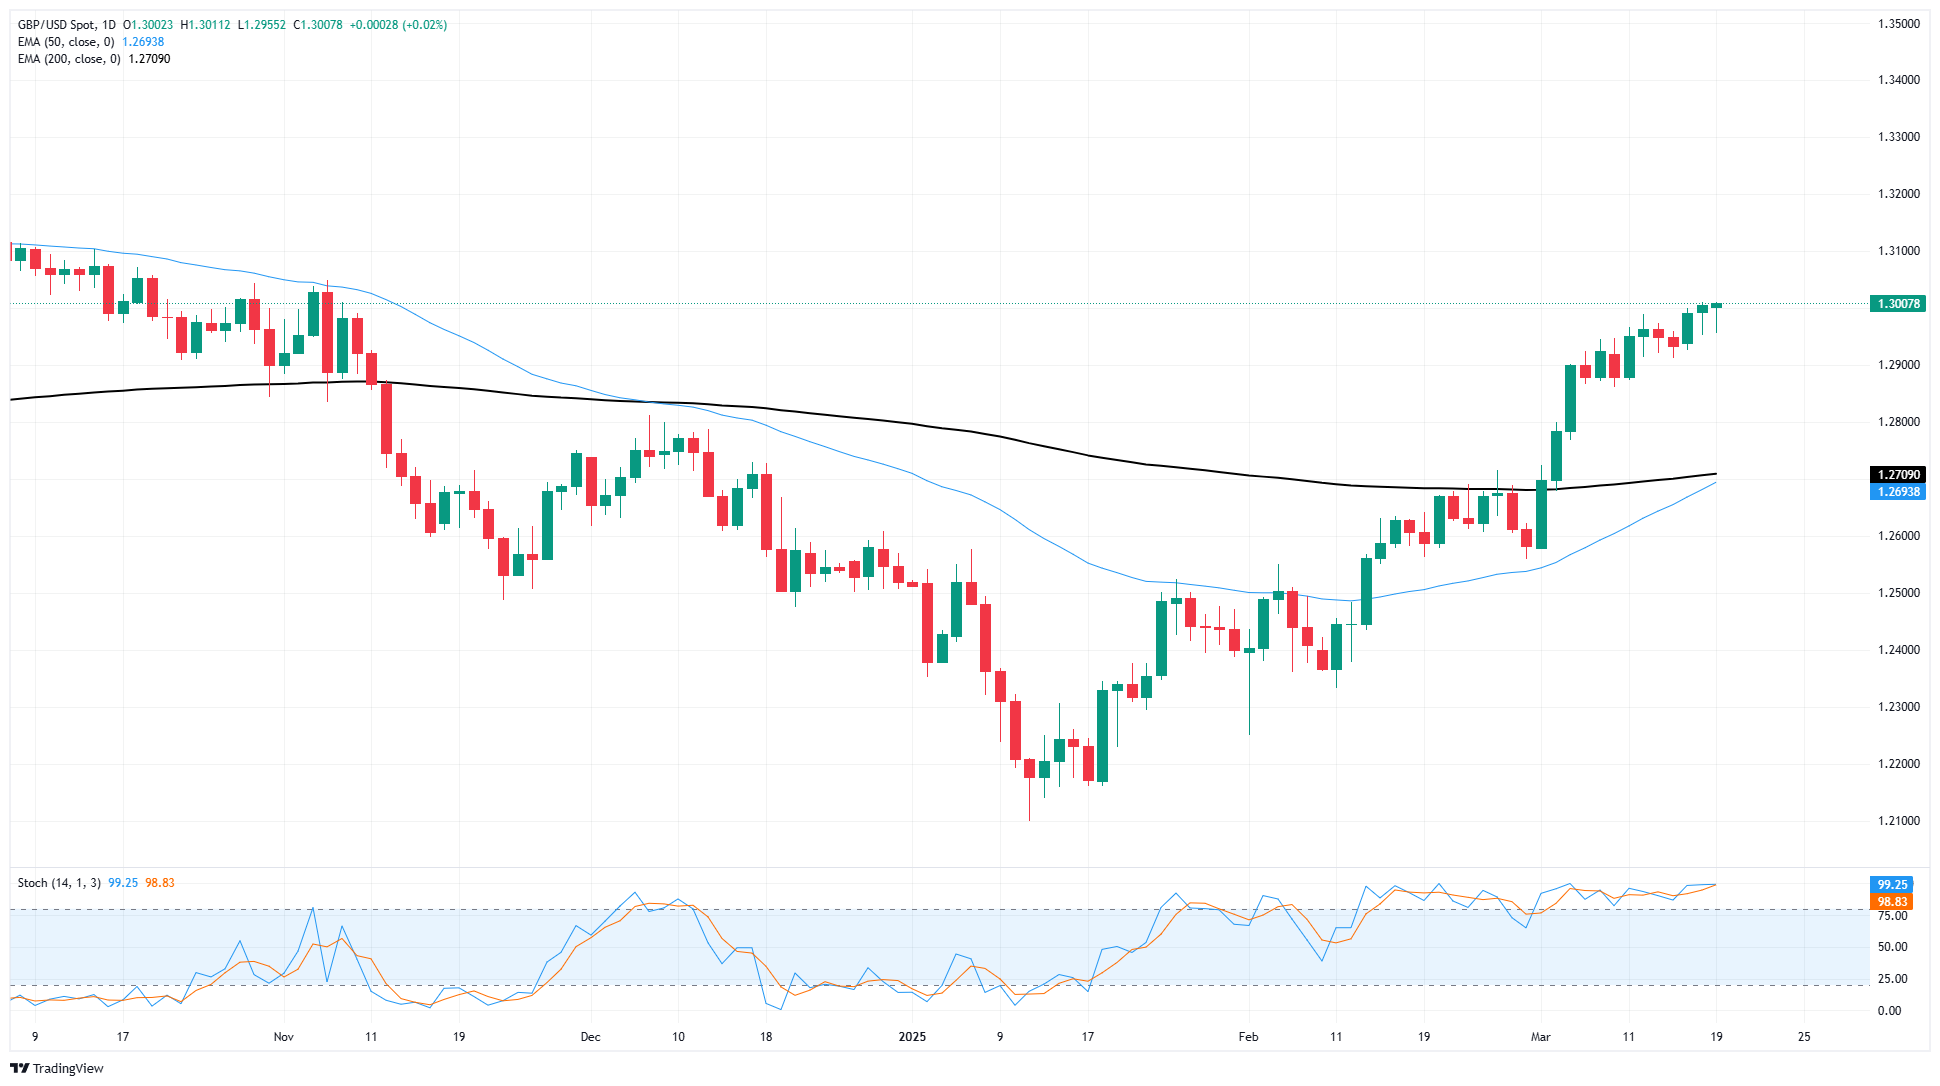
Pound Sterling FAQs
The Pound Sterling (GBP) is the oldest currency in the world (886 AD) and the official currency of the United Kingdom. It is the fourth most traded unit for foreign exchange (FX) in the world, accounting for 12% of all transactions, averaging $630 billion a day, according to 2022 data. Its key trading pairs are GBP/USD, also known as ‘Cable’, which accounts for 11% of FX, GBP/JPY, or the ‘Dragon’ as it is known by traders (3%), and EUR/GBP (2%). The Pound Sterling is issued by the Bank of England (BoE).
The single most important factor influencing the value of the Pound Sterling is monetary policy decided by the Bank of England. The BoE bases its decisions on whether it has achieved its primary goal of “price stability” – a steady inflation rate of around 2%. Its primary tool for achieving this is the adjustment of interest rates. When inflation is too high, the BoE will try to rein it in by raising interest rates, making it more expensive for people and businesses to access credit. This is generally positive for GBP, as higher interest rates make the UK a more attractive place for global investors to park their money. When inflation falls too low it is a sign economic growth is slowing. In this scenario, the BoE will consider lowering interest rates to cheapen credit so businesses will borrow more to invest in growth-generating projects.
Data releases gauge the health of the economy and can impact the value of the Pound Sterling. Indicators such as GDP, Manufacturing and Services PMIs, and employment can all influence the direction of the GBP. A strong economy is good for Sterling. Not only does it attract more foreign investment but it may encourage the BoE to put up interest rates, which will directly strengthen GBP. Otherwise, if economic data is weak, the Pound Sterling is likely to fall.
Another significant data release for the Pound Sterling is the Trade Balance. This indicator measures the difference between what a country earns from its exports and what it spends on imports over a given period. If a country produces highly sought-after exports, its currency will benefit purely from the extra demand created from foreign buyers seeking to purchase these goods. Therefore, a positive net Trade Balance strengthens a currency and vice versa for a negative balance.
-
00:15
USD/CAD edges higher above 1.4300 as Fed holds rates steady, eyes on BoC’s Macklem speech
- USD/CAD gains ground to around 1.4320 in Wednesday’s late American session.
- The Fed kept its benchmark federal funds rate in a range of 4.25%-4.5% at its March meeting on Wednesday.
- Traders brace for the BoC's Governor Macklem speech.
The USD/CAD pair gathers strength to around 1.4320 during the late American session on Wednesday. The Greenback edges higher against the Canadian Dollar (CAD) as the Federal Reserve (Fed) held the interest rate steady at the March meeting, as expected. The Bank of Canada (BoC) Governor Tiff Macklem is scheduled to speak later on Thursday about tariff-related uncertainty.
The US central bank decided to hold its benchmark interest rate steady for a second straight meeting on Wednesday amid mounting concerns that the economy is slowing and inflation could remain stubbornly high. Fed Chair Jerome Powell emphasized the high degree of uncertainty from US President Donald Trump’s significant policy changes, adding that the Fed officials can wait for more clarity on the impact of those policies on the economy before acting.
New economic projections indicated that Fed officials marked down their forecasts for growth this year, but they still see another half percentage point of rate cuts through 2025. The more hawkish remarks from Fed officials on rates from December provide some support to the US Dollar (USD) broadly.
On the other hand, a rebound in Crude Oil prices amid the rising geopolitical tensions in the Middle East could boost the commodity-linked Loonie and create a headwind for USD/CAD. It’s worth noting that Canada is the largest oil exporter to the United States (US), and higher crude oil prices tend to have a positive impact on the CAD value.Canadian Dollar FAQs
The key factors driving the Canadian Dollar (CAD) are the level of interest rates set by the Bank of Canada (BoC), the price of Oil, Canada’s largest export, the health of its economy, inflation and the Trade Balance, which is the difference between the value of Canada’s exports versus its imports. Other factors include market sentiment – whether investors are taking on more risky assets (risk-on) or seeking safe-havens (risk-off) – with risk-on being CAD-positive. As its largest trading partner, the health of the US economy is also a key factor influencing the Canadian Dollar.
The Bank of Canada (BoC) has a significant influence on the Canadian Dollar by setting the level of interest rates that banks can lend to one another. This influences the level of interest rates for everyone. The main goal of the BoC is to maintain inflation at 1-3% by adjusting interest rates up or down. Relatively higher interest rates tend to be positive for the CAD. The Bank of Canada can also use quantitative easing and tightening to influence credit conditions, with the former CAD-negative and the latter CAD-positive.
The price of Oil is a key factor impacting the value of the Canadian Dollar. Petroleum is Canada’s biggest export, so Oil price tends to have an immediate impact on the CAD value. Generally, if Oil price rises CAD also goes up, as aggregate demand for the currency increases. The opposite is the case if the price of Oil falls. Higher Oil prices also tend to result in a greater likelihood of a positive Trade Balance, which is also supportive of the CAD.
While inflation had always traditionally been thought of as a negative factor for a currency since it lowers the value of money, the opposite has actually been the case in modern times with the relaxation of cross-border capital controls. Higher inflation tends to lead central banks to put up interest rates which attracts more capital inflows from global investors seeking a lucrative place to keep their money. This increases demand for the local currency, which in Canada’s case is the Canadian Dollar.
Macroeconomic data releases gauge the health of the economy and can have an impact on the Canadian Dollar. Indicators such as GDP, Manufacturing and Services PMIs, employment, and consumer sentiment surveys can all influence the direction of the CAD. A strong economy is good for the Canadian Dollar. Not only does it attract more foreign investment but it may encourage the Bank of Canada to put up interest rates, leading to a stronger currency. If economic data is weak, however, the CAD is likely to fall.
-