Noticias del mercado
-
22:47
United States API Weekly Crude Oil Stock increased to 1M in January 17 from previous -2.6M
-
22:46
NZD/USD Price Analysis: Pair struggles to find direction within range
- NZD/USD edges slightly lower to 0.5670 on Wednesday, maintaining its position within a narrow trading band.
- RSI dips, showing a mild loss of momentum while staying in positive territory.
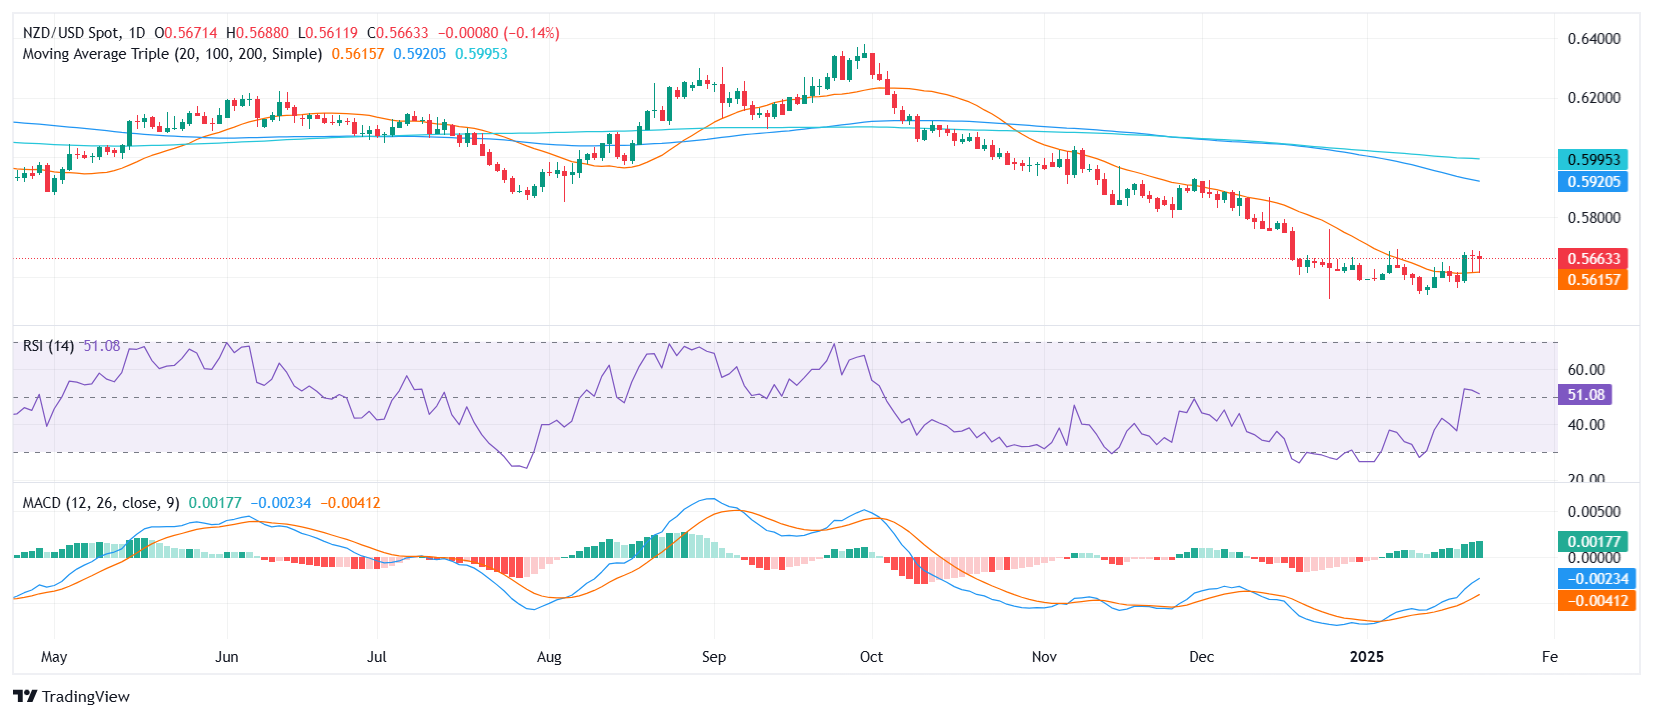
The NZD/USD pair continued its range-bound behavior on Wednesday, slipping marginally to 0.5670 after testing the upper boundary of its recent 0.5540–0.5690 consolidation zone. While the pair has experienced pockets of volatility, it has yet to establish a definitive directional bias, leaving traders cautious about committing to either side.
Technical indicators reflect the pair’s current state of indecision. The Relative Strength Index (RSI) has softened slightly to 51, staying within positive territory but pointing to waning bullish enthusiasm. Conversely, the Moving Average Convergence Divergence (MACD) histogram remains supportive, with rising green bars signaling a potential shift toward upward momentum if buyers can sustain their efforts.
To escape its current range, the pair would need to break decisively above the 0.5690 resistance, potentially opening the door for a move toward the 0.5730 level. On the flip side, a retreat below 0.5540 could pave the way for further downside, with 0.5500 emerging as a key support level to watch.
NZD/USD daily chart
-
22:20
Gold price surges amid escalating US trade policies
- Gold hits new 2025 highs amid rising investor anxiety from Trump's trade rhetoric.
- Despite a rise in the US Dollar Index, Gold's ascent signals strong safe-haven demand.
- Geopolitical tensions in the Middle East escalate, alongside potential US economic measures against Russia.
Gold price advances over 0.39% late in the North American session, with the precious metal climbing decisively above the psychological $2,650 figure with buyers setting their sights at the record high of $2,790. At the time of writing, the XAU/SD trades at $2,755 after bouncing off daily lows of $2,741.
The non-yielding metal extended its gains as United States (US) President Donald Trump trade rhetoric broadened from Mexico, Canada and China to the Eurozone. Consequently, as traders grow uncertain about the “trade war” outcome, bought Bullion which has climbed to its highest level during 2025, at $2,763.
The US Dollar Index (DXY), which measures the performance of the Greenback against a basket of six peers and usually correlates inversely to Gold, rises 0.08%, up at 108.16.
A scarce economic docket in the United States keeps traders adrift to geopolitical developments, with Trump grabbing the headlines.
In his Truth account, President Trump said that he’s not looking to hurt Russia, invited President Vladimir Putin to end the war soon and warned that if he doesn’t, he would have to impose taxes, tariffs and sanctions on Russian goods imported to the US.
The US 10-year Treasury bond yield was marginally up during the day, capping Bullion prices advance.
In the Middle East, the ceasefire agreement between Israel and Hamas was set aside as Israel launched a drone attack in the Hasbaya area in southern Lebanon, according to Lebanese press cited by an Israeli journalist Kai.
This week, the US economic docket will feature Initial Jobless Claims data, S&P Global Flash PMIs and housing data.
Daily digest market movers: Gold price soars amid high US yields
- Gold price rises as real yields ascends one basis points. Measured by the 10-year Treasury Inflation-Protected Securities (TIPS) yield sits at 2.18%.
- President Trump confirmed that universal tariffs on all imports to the US are under consideration as well and will come at a later stage, Reuters reports.
- "(Trump) has been perhaps just a shade less hawkish on tariffs as feared, which helps — less/lower tariffs is taken to indicate lower inflation hence potential for more rate cuts," said Tai Wong, an independent metals trader quoted by Reuters.
- Market participants are pricing in near-even odds that the Fed will cut rates twice by the end of 2025, with the first reduction occurring in June.
XAU/USD technical outlook: Gold price clears $2,750, bulls eye record high
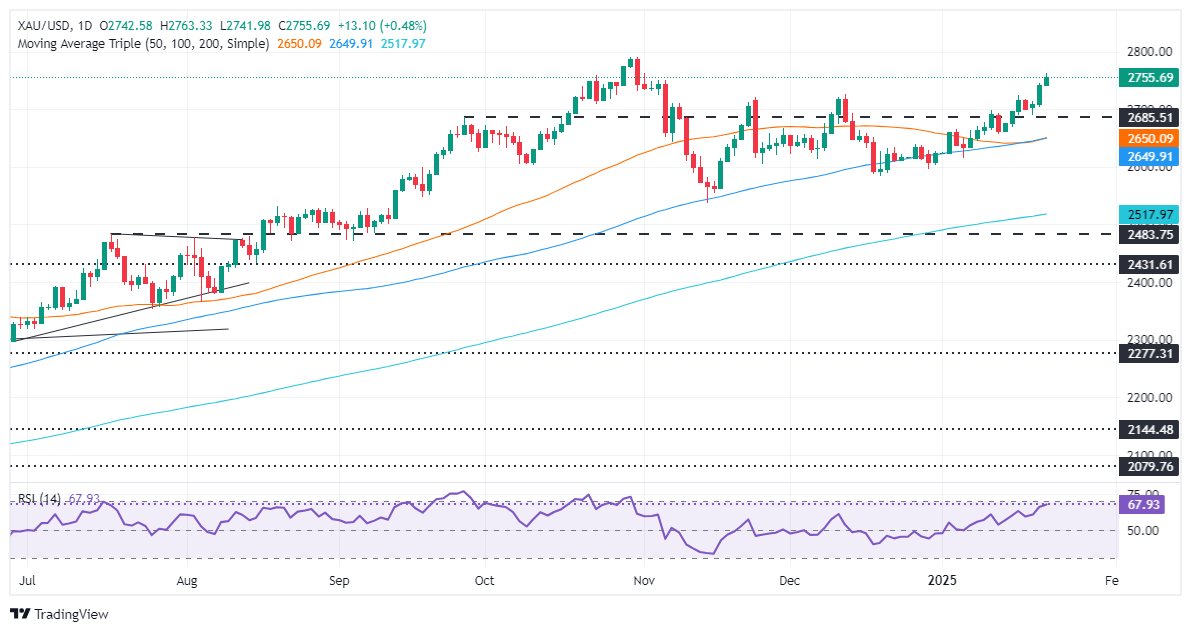
Gold prices are set to challenge record high of $2,790 amid ongoing US trade policies uncertainty. The daily chart suggests that XAU/USD could touch the $2,800 level sooner rather than later. A decisive breach of the latter would expose the psychological $2,850 and $2,900 price levels.
On the downside, if bears drag Bullion prices below the $2,750 figure, the 50 and 100-day Simple Moving Averages (SMAs) emerge as support levels, each at $2,648 and $2,647. If surpassed, up next lies the 200-day SMA at $2,515.
Gold FAQs
Gold has played a key role in human’s history as it has been widely used as a store of value and medium of exchange. Currently, apart from its shine and usage for jewelry, the precious metal is widely seen as a safe-haven asset, meaning that it is considered a good investment during turbulent times. Gold is also widely seen as a hedge against inflation and against depreciating currencies as it doesn’t rely on any specific issuer or government.
Central banks are the biggest Gold holders. In their aim to support their currencies in turbulent times, central banks tend to diversify their reserves and buy Gold to improve the perceived strength of the economy and the currency. High Gold reserves can be a source of trust for a country’s solvency. Central banks added 1,136 tonnes of Gold worth around $70 billion to their reserves in 2022, according to data from the World Gold Council. This is the highest yearly purchase since records began. Central banks from emerging economies such as China, India and Turkey are quickly increasing their Gold reserves.
Gold has an inverse correlation with the US Dollar and US Treasuries, which are both major reserve and safe-haven assets. When the Dollar depreciates, Gold tends to rise, enabling investors and central banks to diversify their assets in turbulent times. Gold is also inversely correlated with risk assets. A rally in the stock market tends to weaken Gold price, while sell-offs in riskier markets tend to favor the precious metal.
The price can move due to a wide range of factors. Geopolitical instability or fears of a deep recession can quickly make Gold price escalate due to its safe-haven status. As a yield-less asset, Gold tends to rise with lower interest rates, while higher cost of money usually weighs down on the yellow metal. Still, most moves depend on how the US Dollar (USD) behaves as the asset is priced in dollars (XAU/USD). A strong Dollar tends to keep the price of Gold controlled, whereas a weaker Dollar is likely to push Gold prices up.
-
22:11
Canadian Dollar waffles back into familiar midrange as Loonie bids sputter
- The Canadian Dollar stumbled again on Wednesday, hung out to dry near 1.4400.
- Economic data from Canada remains thin and the BoC is poised for another rate cut.
- The Fed has hunkered down ahead of its own rate call next week.
The Canadian Dollar (CAD) fell flat on Wednesday, churning back into familiar midrange levels with USD/CAD stuck in the mud near the 1.4400 handle. Data prints on both sides of the 49th parallel are limited through the midweek market sessions, leaving both Loonie and Greenback traders to wait for the next round of central bank action on interest rates for next week.
Both the Bank of Canada (BoC) and the Federal Reserve (Fed) will be making rate statements next week, but the outcomes are set to diverge firmly. The BoC is barreling toward yet another quarter-point rate trim to wrap up this month, while the Fed is broadly expected to stand pat on rates for the first half of 2025. Canadian Retail Sales figures are due on Thursday, but the long-dated numbers from November are unlikely to spark much volatility. US Purchasing Managers Index (PMI) survey results are slated for Friday, but not much is expected from those, either.
Daily digest market movers: Canadian Dollar treads water as markets await signals
- BoC is overwhelmingly expected to deliver another 25 bps rate trim next week.
- The Fed is expected to hold through most of H1, pushing the USD/CAD rate differential even wider.
- The Canadian Dollar shed another third of a percent against the Greenback, remains trapped in familiar congestion.
- CAD traders are keeping one eye out for anymore headlines from US President Donald Trump about possible trade tariffs on all Canadian goods being exported to the US.
- Canadian Retail Sales figures due on Thursday are unlikely to move the needle, unless figures deviate wildly from expectations.
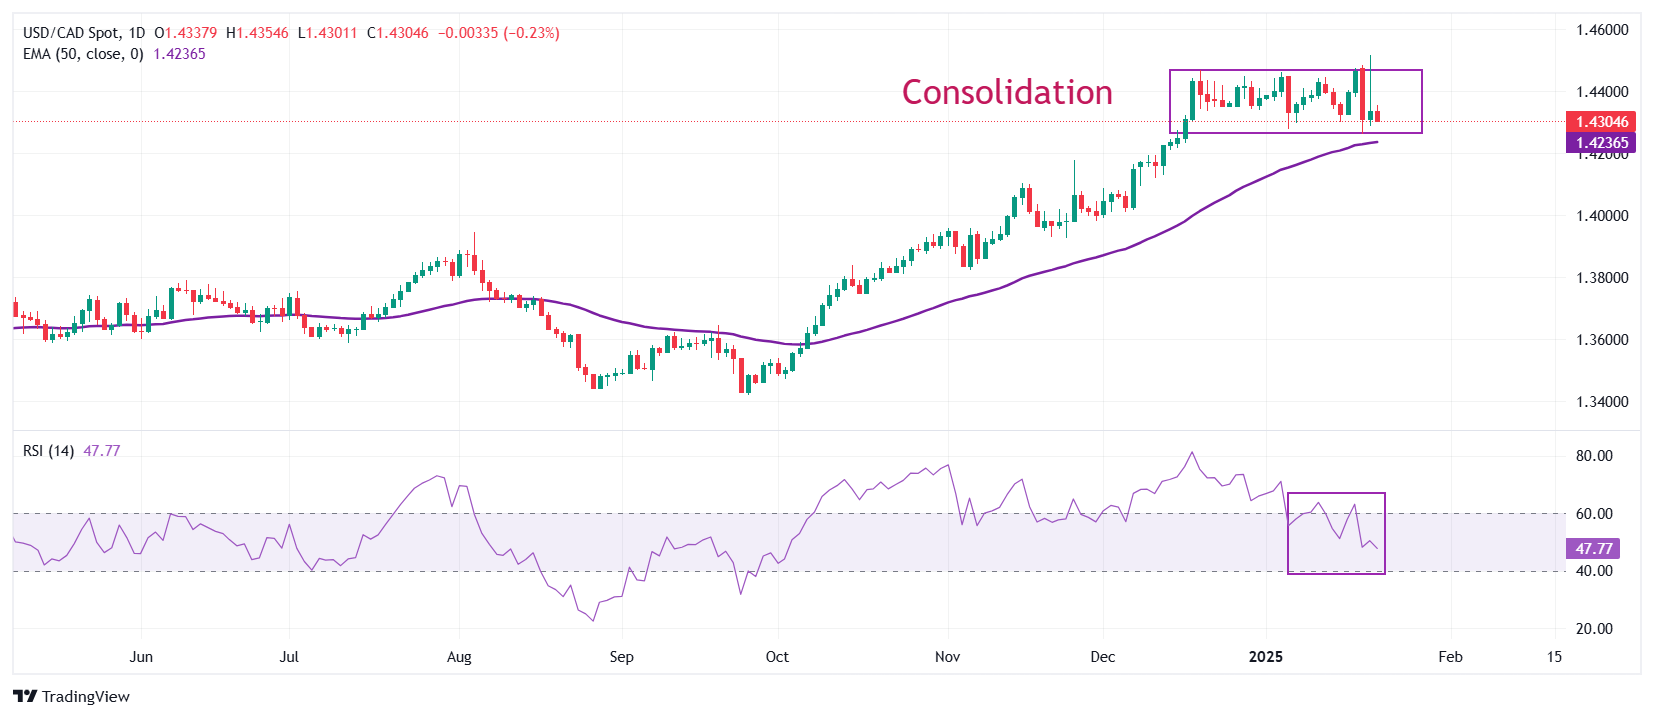
Canadian Dollar price forecast
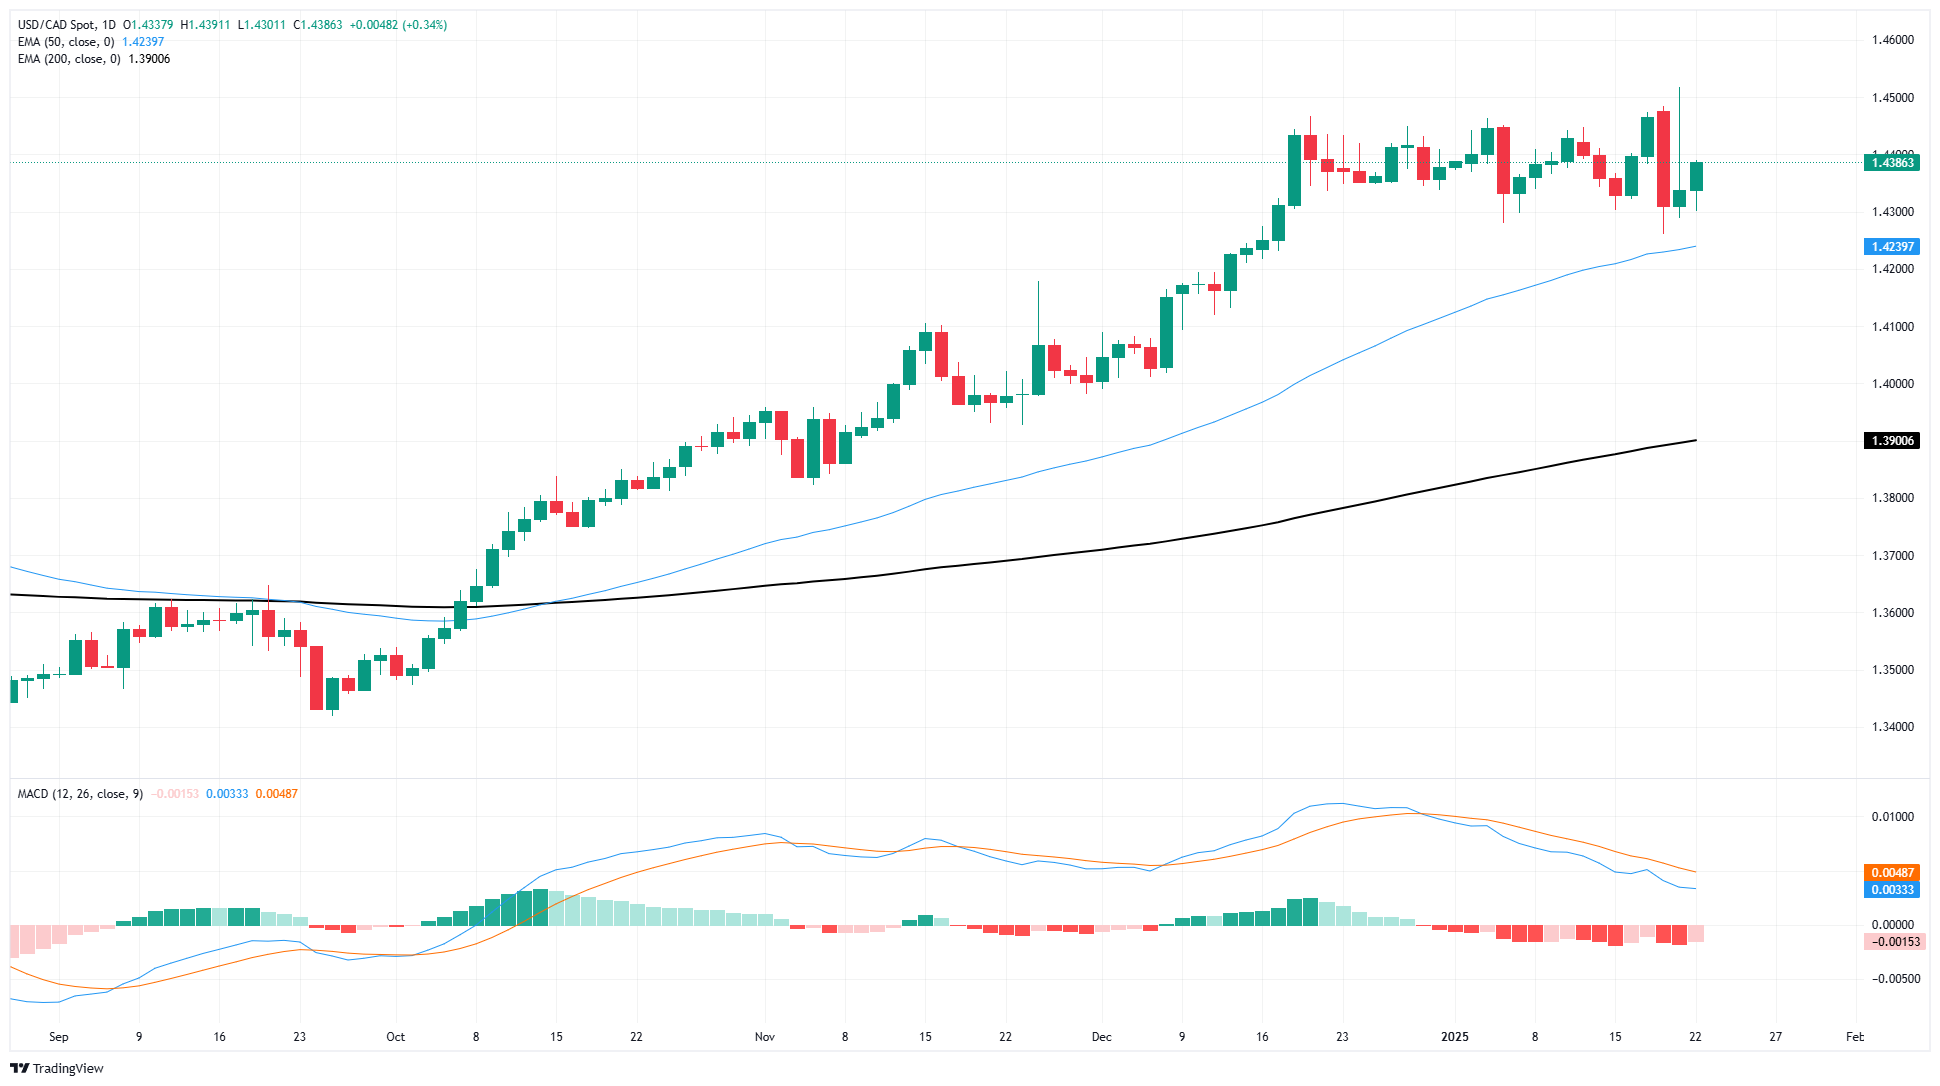
The Canadian Dollar is trapped in a consolidation phase against the US Dollar, driving USD/CAD in a slow circle around the 1.4400 handle. Midweek price action remains muted, and Wednesday’s 0.35% shuffle only sees the Loonie further entrenched in a sideways grind.
Topside bidding action on USD/CAD continues to see the Canadian Dollar testing into multi-year lows, and technical indicators are beginning to break, drifting into the midrange as the pair goes nowhere and bearish momentum fumbles an opportunity to grab a pivot from overbought conditions.
USD/CAD daily chart
Canadian Dollar FAQs
The key factors driving the Canadian Dollar (CAD) are the level of interest rates set by the Bank of Canada (BoC), the price of Oil, Canada’s largest export, the health of its economy, inflation and the Trade Balance, which is the difference between the value of Canada’s exports versus its imports. Other factors include market sentiment – whether investors are taking on more risky assets (risk-on) or seeking safe-havens (risk-off) – with risk-on being CAD-positive. As its largest trading partner, the health of the US economy is also a key factor influencing the Canadian Dollar.
The Bank of Canada (BoC) has a significant influence on the Canadian Dollar by setting the level of interest rates that banks can lend to one another. This influences the level of interest rates for everyone. The main goal of the BoC is to maintain inflation at 1-3% by adjusting interest rates up or down. Relatively higher interest rates tend to be positive for the CAD. The Bank of Canada can also use quantitative easing and tightening to influence credit conditions, with the former CAD-negative and the latter CAD-positive.
The price of Oil is a key factor impacting the value of the Canadian Dollar. Petroleum is Canada’s biggest export, so Oil price tends to have an immediate impact on the CAD value. Generally, if Oil price rises CAD also goes up, as aggregate demand for the currency increases. The opposite is the case if the price of Oil falls. Higher Oil prices also tend to result in a greater likelihood of a positive Trade Balance, which is also supportive of the CAD.
While inflation had always traditionally been thought of as a negative factor for a currency since it lowers the value of money, the opposite has actually been the case in modern times with the relaxation of cross-border capital controls. Higher inflation tends to lead central banks to put up interest rates which attracts more capital inflows from global investors seeking a lucrative place to keep their money. This increases demand for the local currency, which in Canada’s case is the Canadian Dollar.
Macroeconomic data releases gauge the health of the economy and can have an impact on the Canadian Dollar. Indicators such as GDP, Manufacturing and Services PMIs, employment, and consumer sentiment surveys can all influence the direction of the CAD. A strong economy is good for the Canadian Dollar. Not only does it attract more foreign investment but it may encourage the Bank of Canada to put up interest rates, leading to a stronger currency. If economic data is weak, however, the CAD is likely to fall.
-
21:50
Australian Dollar holds near monthly highs as tariffs worries cool
- The Aussie inches up to 0.6280 on Wednesday.
- Trump’s softer-than-expected China tariffs stance underpins mild risk appetite.
- Investors await January’s flash US S&P Global PMI data for fresh direction.
AUD/USD rises to a new monthly high just below 0.6300, helped by signs that United States (US) tariffs on China may not be as harsh as initially feared. Meanwhile, the US Dollar (USD) recovers slightly from multi-day lows, reflecting ongoing uncertainty regarding future US trade policies. Market participants look forward to the upcoming flash S&P Global PMI numbers for January to gauge broader economic sentiment.
Daily digest market movers: Aussie extends gains while markets await fresh drivers
- The amount of China-specific tariffs proposed under Donald Trump’s revised plan appears significantly smaller than originally anticipated, calming some market nerves.
- The US Dollar briefly slumped to a fresh two-week low near 107.75 before staging an intraday rebound, with the Dollar Index (DXY) edging higher.
- Traders brace for the US S&P Global PMI for January release on Friday for clues about near-term economic trends.
- On the negative tone for the Aussie, the Reserve Bank of Australia (RBA) is considering a potential rate cut at its upcoming February meeting to counter moderate domestic growth and receding inflation.
- In addition, the AUD also contends with subdued consumer sentiment, softer commodity performance, and sluggish demand from key trade partner China.
AUD/USD technical outlook: The pair stays in a 0.6180–0.6280 range with a mildly positive bias
AUD/USD mildly rose to 0.6280 on Wednesday, extending its choppy price action and the pair has oscillated between 0.6180 and 0.6280 in the first weeks of January. The Moving Average Convergence Divergence (MACD) histogram prints rising green bars but remains fairly flat, signaling modest bullish momentum. The Relative Strength Index (RSI) stands at 60, climbing upward yet flattening slightly, indicating a cautious tilt toward buyers. A sustained push above 0.6300 could strengthen the recovery, whereas a dip beneath 0.6180 might rekindle near-term selling pressure.
Australian Dollar FAQs
One of the most significant factors for the Australian Dollar (AUD) is the level of interest rates set by the Reserve Bank of Australia (RBA). Because Australia is a resource-rich country another key driver is the price of its biggest export, Iron Ore. The health of the Chinese economy, its largest trading partner, is a factor, as well as inflation in Australia, its growth rate and Trade Balance. Market sentiment – whether investors are taking on more risky assets (risk-on) or seeking safe-havens (risk-off) – is also a factor, with risk-on positive for AUD.
The Reserve Bank of Australia (RBA) influences the Australian Dollar (AUD) by setting the level of interest rates that Australian banks can lend to each other. This influences the level of interest rates in the economy as a whole. The main goal of the RBA is to maintain a stable inflation rate of 2-3% by adjusting interest rates up or down. Relatively high interest rates compared to other major central banks support the AUD, and the opposite for relatively low. The RBA can also use quantitative easing and tightening to influence credit conditions, with the former AUD-negative and the latter AUD-positive.
China is Australia’s largest trading partner so the health of the Chinese economy is a major influence on the value of the Australian Dollar (AUD). When the Chinese economy is doing well it purchases more raw materials, goods and services from Australia, lifting demand for the AUD, and pushing up its value. The opposite is the case when the Chinese economy is not growing as fast as expected. Positive or negative surprises in Chinese growth data, therefore, often have a direct impact on the Australian Dollar and its pairs.
Iron Ore is Australia’s largest export, accounting for $118 billion a year according to data from 2021, with China as its primary destination. The price of Iron Ore, therefore, can be a driver of the Australian Dollar. Generally, if the price of Iron Ore rises, AUD also goes up, as aggregate demand for the currency increases. The opposite is the case if the price of Iron Ore falls. Higher Iron Ore prices also tend to result in a greater likelihood of a positive Trade Balance for Australia, which is also positive of the AUD.
The Trade Balance, which is the difference between what a country earns from its exports versus what it pays for its imports, is another factor that can influence the value of the Australian Dollar. If Australia produces highly sought after exports, then its currency will gain in value purely from the surplus demand created from foreign buyers seeking to purchase its exports versus what it spends to purchase imports. Therefore, a positive net Trade Balance strengthens the AUD, with the opposite effect if the Trade Balance is negative.
-
19:46
Forex Today: US data and Trump dictate the sentiment in the FX galaxy
The US Dollar regained some balance and managed to set aside part of the weekly pullback as market participants continued to assess headlines around Trump 2.0.
Here is what you need to know on Thursday, January 23:
The US Dollar Index (DXY) clawed back some gains, although a move above the 108.00 hurdle appeared elusive for the time being. The usual weekly initial Jobless Claims take centre stage, seconded by the EIA’s report on US crude oil inventories.
EUR/USD’s upside momentum lost some impetus in the area of multi-week peaks north of 1.0400 the figure. The European Commission will publish its advanced Consumer Confidence gauge for the month of January.
GBP/USD traded on the back foot in response to the modest uptick in the Greenback. The CBI Business Optimism Index and the CBI Industrial Trends Orders will be in the spotlight.
USD/JPY maintained its weekly choppiness well in place, this time surpassing the 156.00 barrier as investors kept warming up for the BoJ meeting on January 24. The Balance of Trade results come next, followed by weekly Foreign Bond Investment prints.
Another inconclusive session left AUD/USD hovering around the vicinity of the key 0.6300 area. The preliminary S&P Global Manufacturing and Services PMIs will grab all the attention in Oz.
Prices of WTI extended their leg lower and flirted once again with the $75.00 region per barrel as investors continued to adjust to Trump’s policies.
Prices of Gold advanced for the third session in a row, surpassing $2,760 per ounce troy amid persistent uncertainty surrounding President Trump’s announcements. Silver prices met some selling pressure after faltering just ahead of the key $31.00 mark per ounce.
-
19:25
Mexican Peso stages recovery amid easing Trump’s tariffs concerns
- Mexican Peso stabilizes after a volatile session due to Trump’s review of US trade policy.
- Mexican Foreign Affairs Minister and US Secretary of State discuss security and immigration in first diplomatic contact.
- Market anticipates upcoming Mexican economic reports on mid-month Inflation and Economic Activity.
The Mexican Peso (MXN) recovered on Wednesday after depreciating by 0.65% against the Greenback on Tuesday. Fears over Unites States (US) President Donald Trump's threats of imposing tariffs on Mexico faded and sponsored a leg-down in the USD/MXN pair, which trades at 20.50, down 0.24%.
Trump’s first days in office have kept the Peso volatile as traders assess his trade policy threats. In the meantime, President Trump ordered a comprehensive review of US trade policy, setting an April 1 deadline for recommendations that could significantly transform the country’s trade relations, including the US-Mexico-Canada Agreement (USMCA), which is set for its first revision in 2026.
Meanwhile, Mexican Foreign Affairs Minister Juan Ramon de la Fuente spoke with US Secretary of State Marco Rubio about security and immigration issues in the first official contact between the two diplomats.
Data-wise the Mexican and US economic dockets remained scarce. However, Citi revealed its Expectations Survey, which witnessed Mexican private economists downward review Gross Domestic Product (GDP) figures for 2025. Regarding inflation expectations, analysts estimate both headlines and core to dip below 4%, and the exchange rate to hoover near 21.00.
On Thursday, Mexico’s docket will feature January’s mid-month inflation figures and the November Economic Activity Indicator.
Daily digest market movers: Mexican Peso rises ahead of inflation data
- The Mexican Peso shrugs off harsh Trump’s tariffs rhetoric and appreciates against the Greenback.
- Citi Mexico Expectations Survey suggests that economists expect 2025 GDP to be 1%, while headline inflation will dip to 3.91% by the year’s end. Underlying inflation is foreseen to dip to 3.68%, while the USD/MXN is expected to finish the year at 20.95.
- Economists estimate that Banco de Mexico (Banxico) will lower rates by 25 basis points (bps) from 10.00% to 9.75%, though some analysts expect a 50 bps cut at the February 6 meeting.
- Reuters revealed, “In an interview following the central bank's December rate decision, Banxico Deputy Governor Jonathan Heath said the monetary authority may consider a rate cut of up to 50 basis points in its next session, scheduled for Feb. 6.”
- The divergence between Banxico and the US Federal Reserve (Fed) favors further upside in the USD/MXN pair.
- Mid-month inflation in January is foreseen to drop from 4.44% to 3.93%. Underlying inflation is expected to rise modestly from 3.62% to 3.69%.
- Money market futures have priced in 41.5 bps of Fed rate cuts in 2025, according to CME FedWatch Tool data.
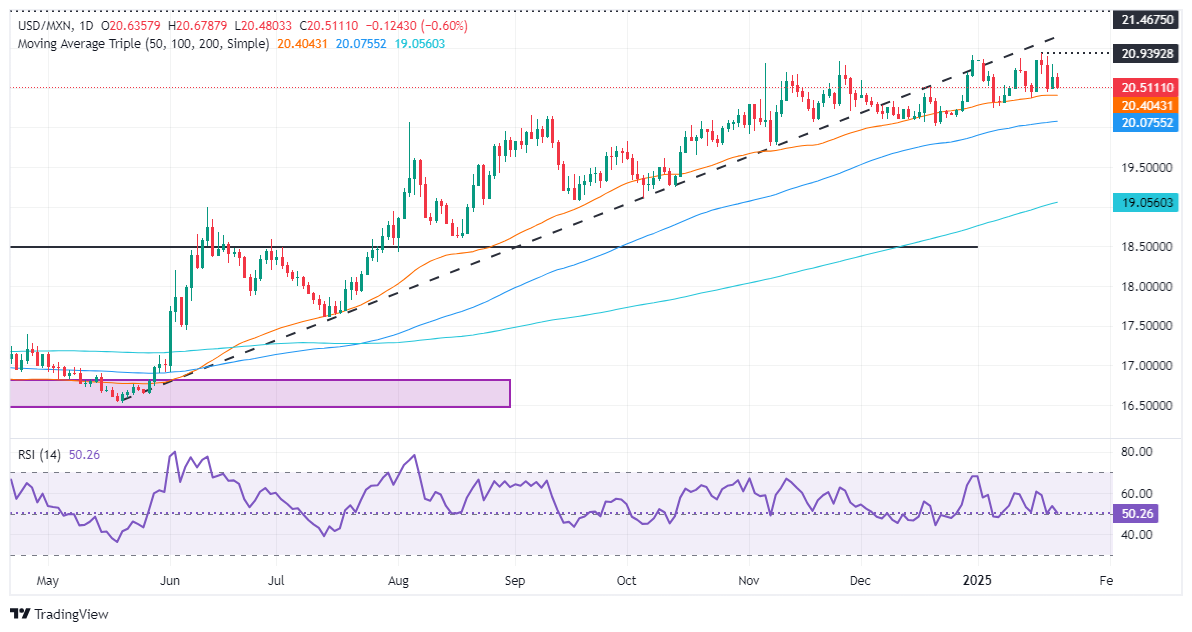
USD/MXN technical outlook: Mexican Peso climbs as USD/MXN tumbles below 20.60
The USD/MXN remains upward biased despite falling below the 20-day Simple Moving Average (SMA) at 20.55. The pair travels around the 20.45 – 20.55 range amid the lack of a clear bias, but the Relative Strength Index (RSI) hints that in the near term sellers are in charge.
If bears push the USD/MXN below 20.45, look for a test of the 50-day SMA at 20.37. On further weakness, the exotic pair might challenge the 100-day SMA at 20.05, ahead of 20.00. On the other hand, if bulls clear the 20.55 ceiling level, this could pave the way to test the year-to-date (YTD) high at the 20.90 mark. If surpassed, the 21.00 mark would be exposed, followed by March 8, 2022 peak at 21.46 ahead of the 22.00 figure.
Mexican Peso FAQs
The Mexican Peso (MXN) is the most traded currency among its Latin American peers. Its value is broadly determined by the performance of the Mexican economy, the country’s central bank’s policy, the amount of foreign investment in the country and even the levels of remittances sent by Mexicans who live abroad, particularly in the United States. Geopolitical trends can also move MXN: for example, the process of nearshoring – or the decision by some firms to relocate manufacturing capacity and supply chains closer to their home countries – is also seen as a catalyst for the Mexican currency as the country is considered a key manufacturing hub in the American continent. Another catalyst for MXN is Oil prices as Mexico is a key exporter of the commodity.
The main objective of Mexico’s central bank, also known as Banxico, is to maintain inflation at low and stable levels (at or close to its target of 3%, the midpoint in a tolerance band of between 2% and 4%). To this end, the bank sets an appropriate level of interest rates. When inflation is too high, Banxico will attempt to tame it by raising interest rates, making it more expensive for households and businesses to borrow money, thus cooling demand and the overall economy. Higher interest rates are generally positive for the Mexican Peso (MXN) as they lead to higher yields, making the country a more attractive place for investors. On the contrary, lower interest rates tend to weaken MXN.
Macroeconomic data releases are key to assess the state of the economy and can have an impact on the Mexican Peso (MXN) valuation. A strong Mexican economy, based on high economic growth, low unemployment and high confidence is good for MXN. Not only does it attract more foreign investment but it may encourage the Bank of Mexico (Banxico) to increase interest rates, particularly if this strength comes together with elevated inflation. However, if economic data is weak, MXN is likely to depreciate.
As an emerging-market currency, the Mexican Peso (MXN) tends to strive during risk-on periods, or when investors perceive that broader market risks are low and thus are eager to engage with investments that carry a higher risk. Conversely, MXN tends to weaken at times of market turbulence or economic uncertainty as investors tend to sell higher-risk assets and flee to the more-stable safe havens.
-
19:22
US Dollar mildly recovers as traders assess fresh tariff talk
- Conflicting White House statements regarding additional levies on Chinese imports create choppy market conditions.
- Investors expect no immediate rate cuts in the first half of the year, aligning with the robust performance of the US economy despite limited Fed official remarks.
- Analysts still attribute the US Dollar’s underlying strength to the US’ enduring economic advantage relative to global peers.
The US Dollar trades flat on Wednesday after two days of losses as the correction aims to continue. Markets are trying to measure the impact of the 10% levy on Chinese goods that President Trump announced on Tuesday. The US Dollar Index (DXY) tests the 108.00 mark and is set to head to the lower end of 107.00. On the Federal Reserve (Fed) side, the bank is in media blackout and with no high-tier economic reports, markets are left with no guidance to bet on the next steps of the data-dependent Fed.
Daily digest market movers: Mixed signals intensify tariff confusion as Fed blackout continues
- President Trump revealed a potential 10% duty on products from China, linking it to broader concerns about fentanyl flows and reiterating that other nations might face tariffs too. This follows earlier rumors that the US administration might hold off on immediate measures, underscoring the contradictory rhetoric.
- Strong US Dollar backdrop remains primarily driven by the US economy’s standout growth despite swirling headlines on trade policy. Analysts suggest that once the tariff fog clears, the US Dollar could reassert its dominance.
- Fed media blackout: Ahead of Chair Powell’s post-decision press conference on January 29, officials have gone quiet. Markets widely predict one rate cut in July, consistent with robust US data.
- Uncertainty around tariffs is heightening volatility, yet currency strategists advise traders to look beyond day-to-day political noise as longer-term US economic momentum remains supportive for the Greenback.
DXY technical outlook: Persistent selling pressure weighs, key levels in play
After bears conquered the 20-day Simple Moving Average (SMA), the outlook turned somewhat bearish as the DXY is now vulnerable to further losses. Should the DXY wish to revive its bullish trajectory, it must overcome 109.30 convincingly.
But failure to defend near-term support levels surrounding 107.50 to 108.00 could spark additional downside. The Greenback’s fundamental posture still leans positive, anchored by economic strength and cautious Fed policy expectations.
US Dollar FAQs
The US Dollar (USD) is the official currency of the United States of America, and the ‘de facto’ currency of a significant number of other countries where it is found in circulation alongside local notes. It is the most heavily traded currency in the world, accounting for over 88% of all global foreign exchange turnover, or an average of $6.6 trillion in transactions per day, according to data from 2022. Following the second world war, the USD took over from the British Pound as the world’s reserve currency. For most of its history, the US Dollar was backed by Gold, until the Bretton Woods Agreement in 1971 when the Gold Standard went away.
The most important single factor impacting on the value of the US Dollar is monetary policy, which is shaped by the Federal Reserve (Fed). The Fed has two mandates: to achieve price stability (control inflation) and foster full employment. Its primary tool to achieve these two goals is by adjusting interest rates. When prices are rising too quickly and inflation is above the Fed’s 2% target, the Fed will raise rates, which helps the USD value. When inflation falls below 2% or the Unemployment Rate is too high, the Fed may lower interest rates, which weighs on the Greenback.
In extreme situations, the Federal Reserve can also print more Dollars and enact quantitative easing (QE). QE is the process by which the Fed substantially increases the flow of credit in a stuck financial system. It is a non-standard policy measure used when credit has dried up because banks will not lend to each other (out of the fear of counterparty default). It is a last resort when simply lowering interest rates is unlikely to achieve the necessary result. It was the Fed’s weapon of choice to combat the credit crunch that occurred during the Great Financial Crisis in 2008. It involves the Fed printing more Dollars and using them to buy US government bonds predominantly from financial institutions. QE usually leads to a weaker US Dollar.
Quantitative tightening (QT) is the reverse process whereby the Federal Reserve stops buying bonds from financial institutions and does not reinvest the principal from the bonds it holds maturing in new purchases. It is usually positive for the US Dollar.
-
19:05
Dow Jones Industrial Average continues to grind higher during midweek headline lull
- The Dow Jones gained another 100 points on Wednesday.
- Equities are enjoying a brief reprieve from major political headlines.
- The economic data docket remains thin until Friday’s PMI print.
The Dow Jones Industrial Average (DJIA) continues to lean into the bullish on Wednesday, climbing around 100 points and inching towards 44,200 as equities tilt into the buy button. There aren’t any particular reasons for a fresh bull run to kick off, but investors aren’t finding any particular reason for a turn into the bearish side, either.
After a campaign trail full of almost-daily threats of wide-sweeping tariffs on all of the US’ trading partners, President Donald Trump’s big plans for day-one tariffs have evaporated into the ether. Fresh threats of an ambiguous level of import tariffs on goods from Canada, Mexico, and China have appeared on Trump’s social media. Still, investors have functionally called the new President’s bluff on his standard trade war rhetoric.
Economic data releases remain thin through the midweek market sessions, and equities are drifting higher in the absence of any numbers to be concerned about. S&P Global Purchasing Managers Index (PMI) business activity survey results are due on Friday. PMI components are expected to come in mixed, with January’s PMI for the manufacturing sector expected to tick upwards slightly and a soft decline forecast for the services component. The figures themselves retain a cautionary level of exposure, and overall market impact should be at least somewhat moderated by the fact that surveys historically have a low response rate and may not accurately represent the overall business economy.
The Federal Reserve (Fed) has entered its latest blackout period ahead of next week’s interest rate call, giving traders some breathing room from the usual parade of central bank policymaker appearances. The Fed is widely expected to stand pat on interest rates for most of the first half of 2025, a hardly surprising outcome as everyone waits to see which parts of the economic machine President Donald Trump chooses to break as retribution for any insults, real or perceived.
Dow Jones news
The Dow Jones is overall mixed on Wednesday, with the equity board roughly split down the middle between winners and losers. Outsized gains in key tech favorites are helping to keep the DJIA tilted toward the bullish side.
Nvidia (NVDA) gained another 4% during the midweek market session, climbing toward $147 per share. Nvidia is benefiting from an anticipated windfall of government funding in the tech space after President Donald Trump announced an investment plan into US-based “AI infrastructure” involving pledges from tech space giants OpenAI, Oracle, and Softbank to invest half a trillion dollars in the proposal, dubbed Stargate. Critics will be quick to point out the Stargate project looks eerily like taxpayers being put on the hook for tech space improvements with ambiguous potential for returns, but the move will undoubtedly be a boon for companies providing the tech that AI relies on to function.
Dow Jones price forecast
The Dow Jones has gained ground for all but one of the last seven straight trading sessions, and further gains are on the cards as price action grinds its way back above the 44,000 handle. Technical oscillators have pushed back into the high end as the Dow Jones recovers from its last swing low below 42,000, but plenty of room appears left to run as the Moving Average Convergence-Divergence signal lines continue to rotate higher.
Dow Jones daily chart

Dow Jones FAQs
The Dow Jones Industrial Average, one of the oldest stock market indices in the world, is compiled of the 30 most traded stocks in the US. The index is price-weighted rather than weighted by capitalization. It is calculated by summing the prices of the constituent stocks and dividing them by a factor, currently 0.152. The index was founded by Charles Dow, who also founded the Wall Street Journal. In later years it has been criticized for not being broadly representative enough because it only tracks 30 conglomerates, unlike broader indices such as the S&P 500.
Many different factors drive the Dow Jones Industrial Average (DJIA). The aggregate performance of the component companies revealed in quarterly company earnings reports is the main one. US and global macroeconomic data also contributes as it impacts on investor sentiment. The level of interest rates, set by the Federal Reserve (Fed), also influences the DJIA as it affects the cost of credit, on which many corporations are heavily reliant. Therefore, inflation can be a major driver as well as other metrics which impact the Fed decisions.
Dow Theory is a method for identifying the primary trend of the stock market developed by Charles Dow. A key step is to compare the direction of the Dow Jones Industrial Average (DJIA) and the Dow Jones Transportation Average (DJTA) and only follow trends where both are moving in the same direction. Volume is a confirmatory criteria. The theory uses elements of peak and trough analysis. Dow’s theory posits three trend phases: accumulation, when smart money starts buying or selling; public participation, when the wider public joins in; and distribution, when the smart money exits.
There are a number of ways to trade the DJIA. One is to use ETFs which allow investors to trade the DJIA as a single security, rather than having to buy shares in all 30 constituent companies. A leading example is the SPDR Dow Jones Industrial Average ETF (DIA). DJIA futures contracts enable traders to speculate on the future value of the index and Options provide the right, but not the obligation, to buy or sell the index at a predetermined price in the future. Mutual funds enable investors to buy a share of a diversified portfolio of DJIA stocks thus providing exposure to the overall index.
-
19:03
United States 20-Year Bond Auction up to 4.9% from previous 4.686%
-
16:55
Copper CTAs to abandon their net longs – TDS
Downside asymmetry in the set-up for Copper flows is forming. Range-bound price action is akin to time-decay for trend signals, which lowers the bar for whipsaws in algo positioning, TDS' Senior Commodity Strategist Daniel Ghali notes.
CTAs may turn to building a significant net short position
"Our simulations of future prices point to no reasonable scenario for price action that could lead to subsequent CTA buying activity for the time being, but conversely, the bar is low for CTAs to sell their entire book long."
"In fact, a continued downtape in prices could force CTAs to abandon their net long and flip towards building a significant net short position, in a series of selling programs that could total up to -55% of algos' max size."
-
16:52
Any further strength in Gold is likely to lift Silver – TDS
Algos are going to propel precious metals further. Markets expect CTAs will add to their net length in Gold over the coming week, in any scenario for future prices. This bolsters our conviction that the time for caution in gold has ended, TDS' Senior Commodity Strategist Daniel Ghali notes.
Gold EFPs have significantly slumped
"The current set-up is exceptionally reflexive, given that a weaker broad dollar/weaker US rates can attract additional macro fund buying activity, following significant liquidations from the extreme position sizing held by this cohort into US elections, whereas a continued strengthening in the broad dollar can attract physical buying activity associated with Asian currency depreciation hedges."
"The buyer's strike in physical markets has ended, and we now expect renewed CTA buying activity will be the next catalyst to extend the rally in flat prices further, with algos set to buy between +10% of their max size (or 20% of their current position size) and +17% of their max size in any scenario for prices over the coming week. Macro funds have rebuilt their war chests, and we see no shortage of bullish narratives that can keep their capital from flowing back into the yellow metal, particularly should algo buying push prices into new all-time highs."
"Gold EFPs have significantly slumped, despite continued strength in flat prices. Silver EFPs remain far more stubborn, as we expected, with London markets continuing to point to tightness underscoring our view for explosive upside convexity. Any further strength in Gold is likely to lift Silver given a historically cheap XAU/XAG ratio, but CTA buying activity in the white metal over the coming week will likely kick off the next leg of this rally."
-
16:51
USDJPY climbs amid renewed US trade tension, steady US yields
- USD/JPY uptrend extends spurred by steady US 10-year Treasury yield holding at 4.58%.
- President Trump plans new tariffs on Chinese, European goods, spurring US Dollar recovery.
- Bank of Japan eyes rate hike with improving wage growth and inflation, softening Yen.
The USD/JPY rose in early trading during the North American session, bolstered by Trump’s trade rhetoric against Canada, Mexico, the EU, and China. In addition, a firm US Dollar and a steady US 10-year Treasury bond yield pushed the pair above the 156.00 figure for a 0.41% gain.
USD/JPY climbs above 156.00, shrugs off BoJ rate hike speculation
On Tuesday, Trump stated his team is discussing applying 10% tariffs on China’s goods on February 1 while vowing to apply duties on European goods are also eyed. Meanwhile, the Greenback recovered following Monday’s 1.22% fall, as Trump tempered his trade rhetoric in his inauguration speech.
In the meantime, the US Dollar Index (DXY), which tracks the buck's performance against a basket of six currencies, remains unchanged at 108.13. The US 10-year T-note is yielding 4.58%, flat.
The Japanese Yen remains slightly softer even though the Bank of Japan (BoJ) is expected to raise rates at the January 23-24 meeting. Governor Kazuo Ueda and Co. got a green light as Japanese retailers are increasing wages for the second year amid rising inflation and difficulties in hiring people.
Data-wise, the US economic docket remains absent. In Japan, the Balance of Trade in December is expected to reduce the deficit to ¥-55B from ¥-117.6B.
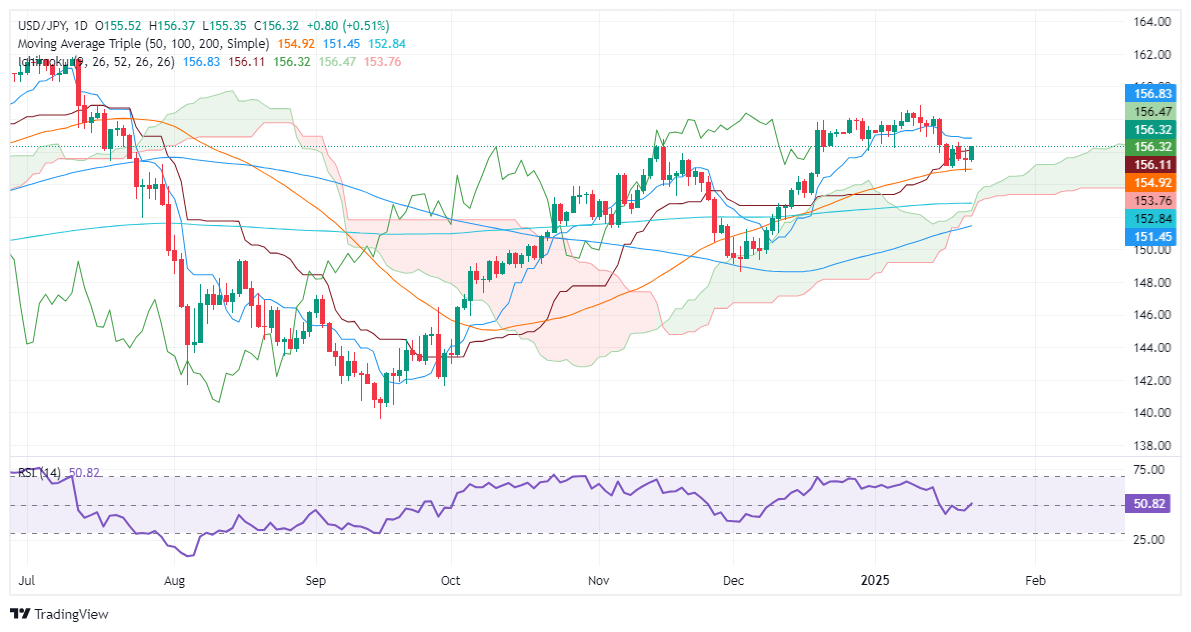
USD/JPY Price Analysis: Technical outlook
The USD/JPY recovered after hitting a weekly low of 154.76, shy of testing a four-month-old support trendline drawn from October’s 2024 lows of 139.56.
However, buyers stepped in and pushed the exchange rate past the 155.00 and 156.00 figures, as they target the Tenkan-sen at 156.82. A breach of the latter will expose a 157.00 figure, followed by the January 14 daily high at 158.20.
Conversely, if USD/JPY tumbles below 156.00, it would expose 155.00, followed by the January 21 swing low of 154.76.
Japanese Yen PRICE Today
The table below shows the percentage change of Japanese Yen (JPY) against listed major currencies today. Japanese Yen was the strongest against the Canadian Dollar.
USD EUR GBP JPY CAD AUD NZD CHF USD 0.02% 0.17% 0.53% 0.28% 0.02% 0.10% 0.14% EUR -0.02% 0.15% 0.50% 0.25% 0.00% 0.08% 0.11% GBP -0.17% -0.15% 0.39% 0.10% -0.15% -0.07% -0.06% JPY -0.53% -0.50% -0.39% -0.25% -0.50% -0.43% -0.41% CAD -0.28% -0.25% -0.10% 0.25% -0.25% -0.17% -0.17% AUD -0.02% 0.00% 0.15% 0.50% 0.25% 0.08% 0.09% NZD -0.10% -0.08% 0.07% 0.43% 0.17% -0.08% 0.00% CHF -0.14% -0.11% 0.06% 0.41% 0.17% -0.09% -0.00% The heat map shows percentage changes of major currencies against each other. The base currency is picked from the left column, while the quote currency is picked from the top row. For example, if you pick the Japanese Yen from the left column and move along the horizontal line to the US Dollar, the percentage change displayed in the box will represent JPY (base)/USD (quote).
-
16:38
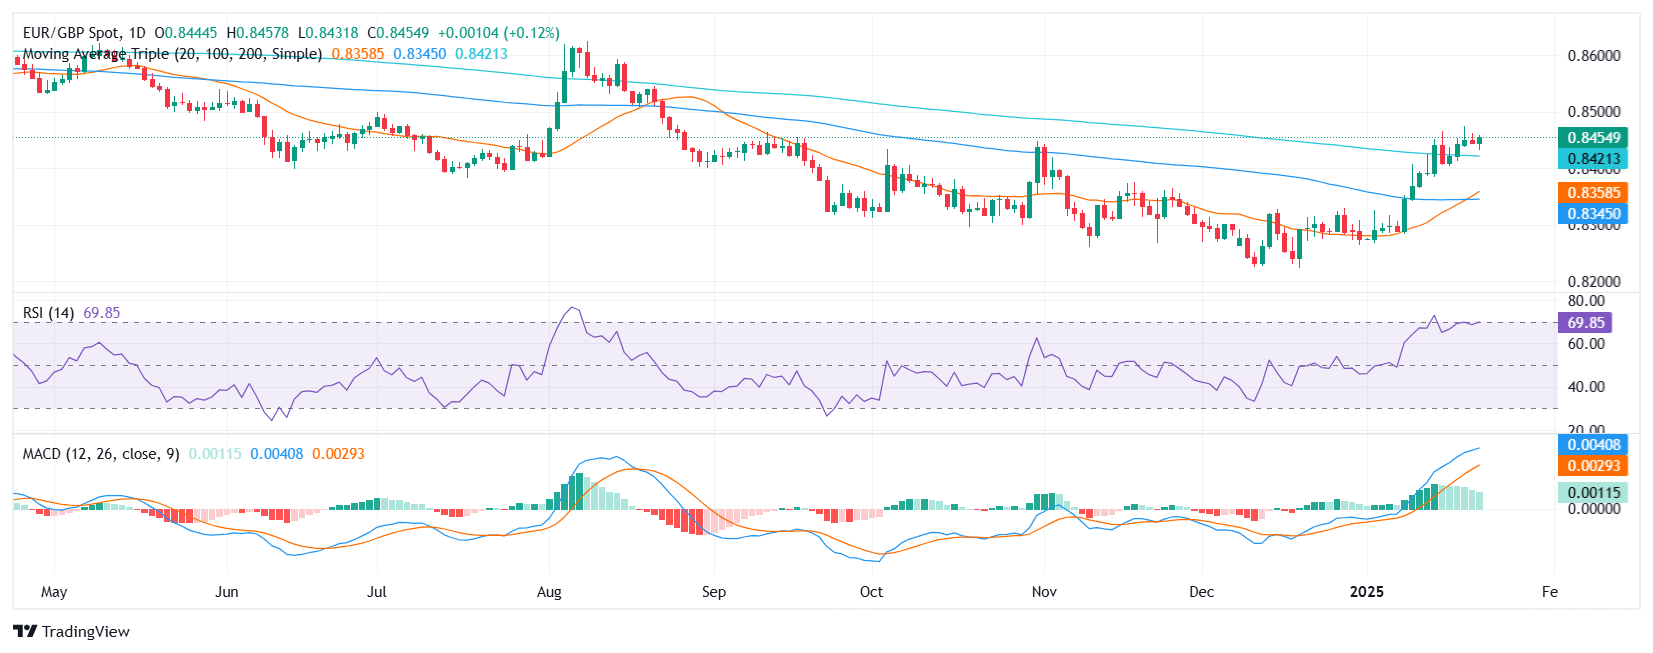
EUR/GBP Price Analysis: Bullish momentum slows near 0.8450 resistance
- EUR/GBP edges higher to 0.8450 on Wednesday, testing the upper boundary of its trading range.
- RSI shows slightly overbought conditions but maintaining a positive bias.
- MACD histogram prints shrinking green bars, indicating waning bullish momentum.
The EUR/GBP pair advanced modestly on Wednesday, climbing to 0.8450 as it continues to oscillate within a defined range of 0.8440 to 0.8475. Despite the upward movements, momentum appears to be softening as the pair nears its resistance threshold.
Technically, the Relative Strength Index (RSI) remains at 69, in positive territory, reflecting slightly overbought conditions that could cap further gains in the short term. Meanwhile, the Moving Average Convergence Divergence (MACD) histogram shows shrinking green bars, a signal that bullish momentum is losing steam. These indicators suggest that while the overall trend remains upward, immediate upside potential may be limited.
Traders will monitor whether EUR/GBP can decisively break above the 0.8475 resistance, which could pave the way for a move toward 0.8500. Alternatively, a reversal from current levels may prompt a retest of the 0.8440 support, with a break lower exposing the 0.8415 zone as the next key level to watch.
EUR/GBP daily chart
-
15:37
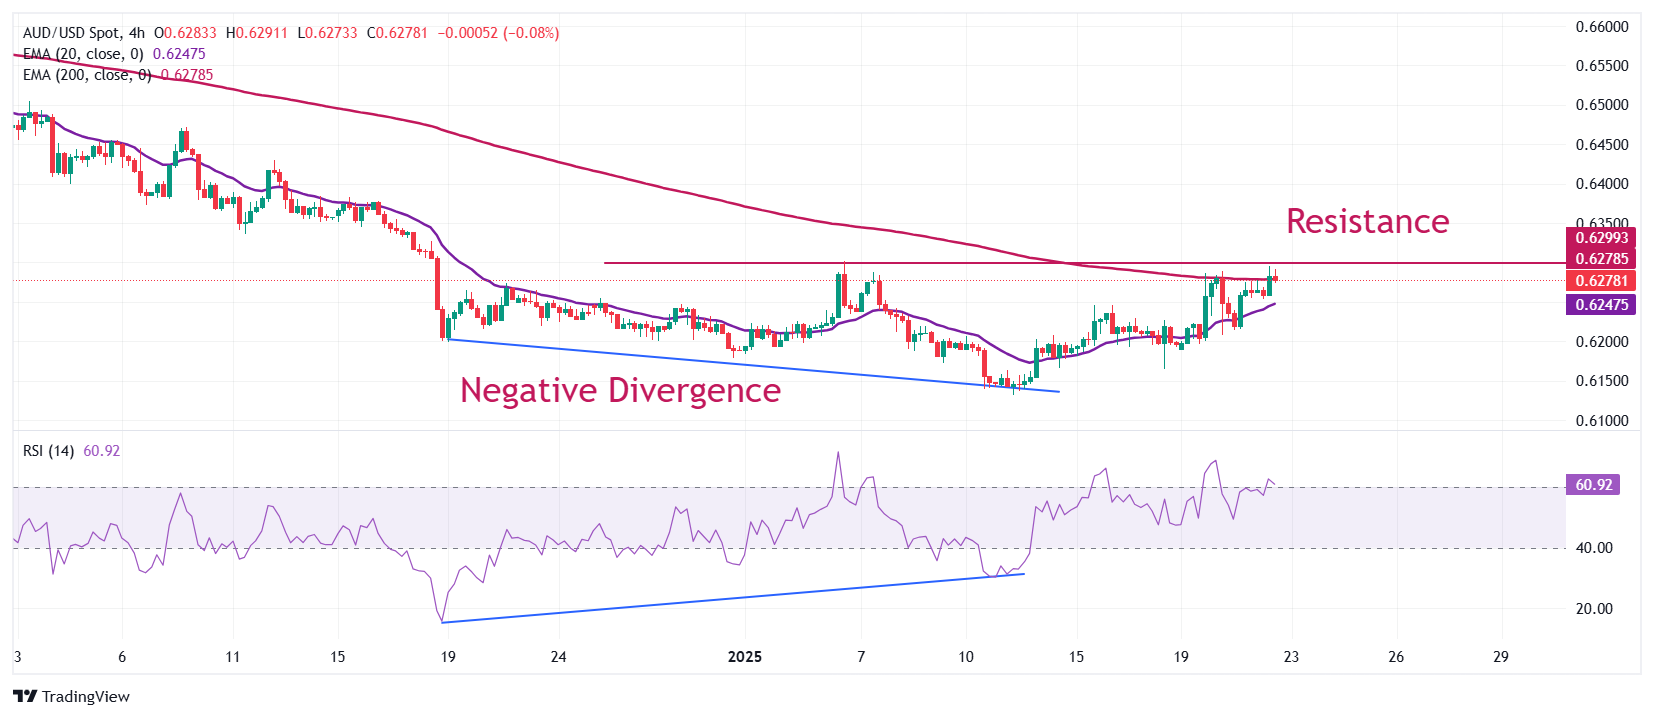
AUD/USD Price Forecast: Stage is set for bullish reversal
- AUD/USD rises to the monthly high around 0.6300 as Trump threatens lower tariffs on China than feared.
- The USD Index bounces back after refreshing a two-week low near 107.75.
- Investors await the flash US S&P Global PMI data for January
The AUD/USD pair revisits the monthly high around 0.6300 in Wednesday’s North American session. The Aussie pair ticks higher as the Australian Dollar (AUD) gains on reports that United States (US) President Donald Trump threatens to raise 10% tariffs on China from February 1.
The amount of tariff hikes proposed by Trump is significantly lower than what market participants had anticipated. In the election campaign, Trump said that he would impose 60% tariffs on China if he won the elections. Any economic development in China significantly impacts the Australian dollar, given that Australia is China's leading trading partner.
Meanwhile, the US Dollar (USD) recovers its intraday losses after posting a fresh two-year high, with the US Dollar Index (DXY) rebounds from 107.75.
Going forward, investors will focus on the preliminary US S&P Global Purchasing Managers’ Index (PMI) data for January, which will be published on Friday.
AUD/USD bounces back from a more-than-four-year low of 0.6170. The pair rebounded after a divergence in momentum and price action. The 14-period Relative Strength Index (RSI) formed a higher low, while the pair made lower lows on a four-hour timeframe.
The asset has recovered to near the 200-period Exponential Moving Average (EMA) near 0.6300. The 20-day EMA slopes higher near 0.6247, suggesting that the near-term trend has turned bullish.
Going forward, a sustenance move above 0.6300 will open doors to the December 18 high of 0.6340 and the round-level resistance of 0.6400.
On the flip side, the pair would face more downside if it fails to hold the January 13 low of 0.6131. This will push it lower to the round-level support of 0.6100 and the April 2020 low of 0.5990.
AUD/USD four-hour chart
Australian Dollar FAQs
One of the most significant factors for the Australian Dollar (AUD) is the level of interest rates set by the Reserve Bank of Australia (RBA). Because Australia is a resource-rich country another key driver is the price of its biggest export, Iron Ore. The health of the Chinese economy, its largest trading partner, is a factor, as well as inflation in Australia, its growth rate and Trade Balance. Market sentiment – whether investors are taking on more risky assets (risk-on) or seeking safe-havens (risk-off) – is also a factor, with risk-on positive for AUD.
The Reserve Bank of Australia (RBA) influences the Australian Dollar (AUD) by setting the level of interest rates that Australian banks can lend to each other. This influences the level of interest rates in the economy as a whole. The main goal of the RBA is to maintain a stable inflation rate of 2-3% by adjusting interest rates up or down. Relatively high interest rates compared to other major central banks support the AUD, and the opposite for relatively low. The RBA can also use quantitative easing and tightening to influence credit conditions, with the former AUD-negative and the latter AUD-positive.
China is Australia’s largest trading partner so the health of the Chinese economy is a major influence on the value of the Australian Dollar (AUD). When the Chinese economy is doing well it purchases more raw materials, goods and services from Australia, lifting demand for the AUD, and pushing up its value. The opposite is the case when the Chinese economy is not growing as fast as expected. Positive or negative surprises in Chinese growth data, therefore, often have a direct impact on the Australian Dollar and its pairs.
Iron Ore is Australia’s largest export, accounting for $118 billion a year according to data from 2021, with China as its primary destination. The price of Iron Ore, therefore, can be a driver of the Australian Dollar. Generally, if the price of Iron Ore rises, AUD also goes up, as aggregate demand for the currency increases. The opposite is the case if the price of Iron Ore falls. Higher Iron Ore prices also tend to result in a greater likelihood of a positive Trade Balance for Australia, which is also positive of the AUD.
The Trade Balance, which is the difference between what a country earns from its exports versus what it pays for its imports, is another factor that can influence the value of the Australian Dollar. If Australia produces highly sought after exports, then its currency will gain in value purely from the surplus demand created from foreign buyers seeking to purchase its exports versus what it spends to purchase imports. Therefore, a positive net Trade Balance strengthens the AUD, with the opposite effect if the Trade Balance is negative.
-
14:55
United States Redbook Index (YoY) increased to 4.5% in January 17 from previous 4%
-
14:51
USD/CHF ticks higher SNB brings possibility of negative rates on table
- USD/CHF edges higher as SNB Schlegel’s ultra-dovish monetary policy guidance weighs on the Swiss Franc.
- SNB Schlegel opens doors for negative interest rates if inflation continues to remain lower.
- Investors seek more clarification on Trump’s tariff agenda.
The USD/CHF pair ticks higher to near 0.9060 in Wednesday’s North American session. The Swiss Franc pair recovers its intraday losses and gains marginally as Swiss National Bank (SNB) Chairman Martin Schlegel has opened doors for negative interest rates.
Schlegel said in an interview with Bloomberg TV at the World Economic Forum (WEF) in Davos that the SNB “doesn’t like negative interest rates” but if we have to do it, “we will”. His ultra-dovish monetary policy stance was backed by upside risks to inflation undershooting the SNB’s target range. Schlegel added, “We are ready to make currency market interventions if necessary again.”
Swiss Franc PRICE Today
The table below shows the percentage change of Swiss Franc (CHF) against listed major currencies today. Swiss Franc was the strongest against the Japanese Yen.
USD EUR GBP JPY CAD AUD NZD CHF USD -0.09% -0.04% 0.23% 0.17% -0.21% -0.05% 0.02% EUR 0.09% 0.04% 0.34% 0.24% -0.13% 0.04% 0.10% GBP 0.04% -0.04% 0.29% 0.21% -0.17% -0.00% 0.05% JPY -0.23% -0.34% -0.29% -0.07% -0.45% -0.30% -0.24% CAD -0.17% -0.24% -0.21% 0.07% -0.38% -0.21% -0.17% AUD 0.21% 0.13% 0.17% 0.45% 0.38% 0.17% 0.22% NZD 0.05% -0.04% 0.00% 0.30% 0.21% -0.17% 0.05% CHF -0.02% -0.10% -0.05% 0.24% 0.17% -0.22% -0.05% The heat map shows percentage changes of major currencies against each other. The base currency is picked from the left column, while the quote currency is picked from the top row. For example, if you pick the Swiss Franc from the left column and move along the horizontal line to the US Dollar, the percentage change displayed in the box will represent CHF (base)/USD (quote).
Meanwhile, the US Dollar (USD) performs better against the Swiss Franc (CHF) but trades cautiously, with investors seeking explicit tariff plans by United States (US) President Donald Trump.
The US Dollar Index (DXY), which tracks the Greenback’s value against six major currencies, rebounds after posting a fresh two-week low of 107.75 on Wednesday.
Investors look for more clarity on Trump’s tariff plans as he has not clarified in his two days of administration. On the contrary, market participants had anticipated that Trump will impose tariff hikes right after returning the White House.
Trump said that he is thinking to implement 25% tariffs on Mexico and Canada, and 10% on China, which will come into effect on February 1. Market participants see this as more balanced approach, which is less fearful than what they had though after Trump’s comments in the election campaign.
Swiss Franc FAQs
The Swiss Franc (CHF) is Switzerland’s official currency. It is among the top ten most traded currencies globally, reaching volumes that well exceed the size of the Swiss economy. Its value is determined by the broad market sentiment, the country’s economic health or action taken by the Swiss National Bank (SNB), among other factors. Between 2011 and 2015, the Swiss Franc was pegged to the Euro (EUR). The peg was abruptly removed, resulting in a more than 20% increase in the Franc’s value, causing a turmoil in markets. Even though the peg isn’t in force anymore, CHF fortunes tend to be highly correlated with the Euro ones due to the high dependency of the Swiss economy on the neighboring Eurozone.
The Swiss Franc (CHF) is considered a safe-haven asset, or a currency that investors tend to buy in times of market stress. This is due to the perceived status of Switzerland in the world: a stable economy, a strong export sector, big central bank reserves or a longstanding political stance towards neutrality in global conflicts make the country’s currency a good choice for investors fleeing from risks. Turbulent times are likely to strengthen CHF value against other currencies that are seen as more risky to invest in.
The Swiss National Bank (SNB) meets four times a year – once every quarter, less than other major central banks – to decide on monetary policy. The bank aims for an annual inflation rate of less than 2%. When inflation is above target or forecasted to be above target in the foreseeable future, the bank will attempt to tame price growth by raising its policy rate. Higher interest rates are generally positive for the Swiss Franc (CHF) as they lead to higher yields, making the country a more attractive place for investors. On the contrary, lower interest rates tend to weaken CHF.
Macroeconomic data releases in Switzerland are key to assessing the state of the economy and can impact the Swiss Franc’s (CHF) valuation. The Swiss economy is broadly stable, but any sudden change in economic growth, inflation, current account or the central bank’s currency reserves have the potential to trigger moves in CHF. Generally, high economic growth, low unemployment and high confidence are good for CHF. Conversely, if economic data points to weakening momentum, CHF is likely to depreciate.
As a small and open economy, Switzerland is heavily dependent on the health of the neighboring Eurozone economies. The broader European Union is Switzerland’s main economic partner and a key political ally, so macroeconomic and monetary policy stability in the Eurozone is essential for Switzerland and, thus, for the Swiss Franc (CHF). With such dependency, some models suggest that the correlation between the fortunes of the Euro (EUR) and the CHF is more than 90%, or close to perfect.
-
14:30
Canada Raw Material Price Index above forecasts (0.4%) in December: Actual (1.3%)
-
14:30
Canada Industrial Product Price (MoM) below forecasts (0.6%) in December: Actual (0.2%)
-
14:21
US Dollar faces more selling pressure with no one safe from tariffs
- The US Dollar stabilizes on Wednesday after two days of losses as the correction aims to continue.
- Traders are mulling the 10% levy over Chinese goods President Trump announced on Tuesday.
- The US Dollar Index (DXY) tests the 108.00 mark and is set to head to the lower end of 107.00
The US Dollar Index (DXY), which tracks the Greenback’s value against six major currencies, stabilizes just below the 108.00 mark in the European trading session on Wednesday. However, selling pressure persists after US President Donald Trump released more comments on a possible 10% levy on all Chinese imports on Tuesday. Even Europe got targeted, though tariff debates seem still ongoing.
Meanwhile, the US economic calendar is still very light. While Federal Reserve (Fed) officials remain in the blackout period ahead of the January 29 policy decision, traders focused on the Mortgage Bankers Association (MBA) Applications for the week ending January 17 on Wednesday. The previous week's surge of 33.3% was staggering, to say the least, and traders are intrigued to see if a Trump-effect is also playing out in the mortgage market.
Daily digest market movers: Still quiet
- The Mortgage Bankers Association (released on Wednesday its weekly Mortgage survey, which saw a very small 0.1% uptick in applications in the week ending January 17 compared to the previous week's 33.3% print.
- Equities are tying up with gains on Wednesday. European equities are flat, while US futures are up near 0.50%.
- The CME FedWatch tool projects a 55.7% chance that interest rates will remain unchanged at current levels in the May meeting, suggesting a rate cut in June. Expectations are that the Federal Reserve (Fed) will remain data-dependent with uncertainties that could influence inflation during US President Donald Trump’s term.
- The US 10-year yield is trading around 4.58% on Wednesday and has a long road to recovery if it wants to head back to last week’s peak near 4.75%.
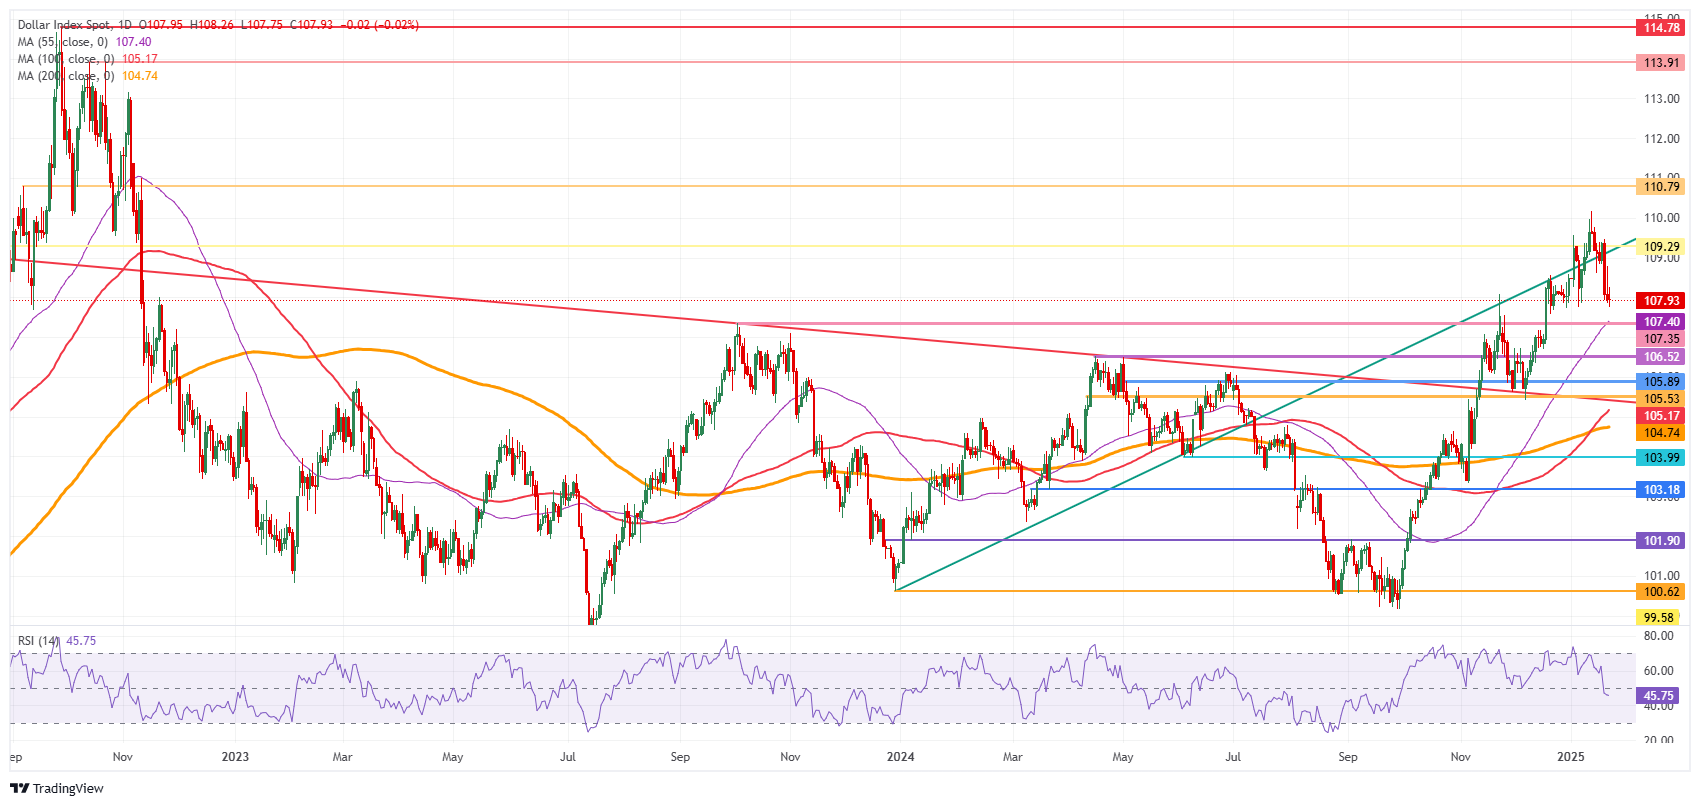
US Dollar Index Technical Analysis: Can’t go easy
The US Dollar Index (DXY) declines further as selling pressure persists. It is not so that tariffs are triggering the US Dollar correction. Instead, it is very unclear and misty communication, where many balloons are left hanging in the air, though nothing concrete has been implemented for now.
If the recovery in the DXY wants to continue its ascent, the pivotal level to gain control of is 109.29 (July 14, 2022, high and rising trendline). Further up, the next big upside level to hit before advancing further remains at 110.79 (September 7, 2022, high). Once beyond there, it is quite a stretch to 113.91, a double top from October 2022.
On the downside, the first area to watch is 107.80-107.90, which held this week’s correction. Further down, the convergence of the high of October 3, 2023, and the 55-day Simple Moving Average (SMA) around 107.40 should act as a double safety feature to catch any falling knives.

US Dollar Index: Daily Chart
US Dollar FAQs
The US Dollar (USD) is the official currency of the United States of America, and the ‘de facto’ currency of a significant number of other countries where it is found in circulation alongside local notes. It is the most heavily traded currency in the world, accounting for over 88% of all global foreign exchange turnover, or an average of $6.6 trillion in transactions per day, according to data from 2022. Following the second world war, the USD took over from the British Pound as the world’s reserve currency. For most of its history, the US Dollar was backed by Gold, until the Bretton Woods Agreement in 1971 when the Gold Standard went away.
The most important single factor impacting on the value of the US Dollar is monetary policy, which is shaped by the Federal Reserve (Fed). The Fed has two mandates: to achieve price stability (control inflation) and foster full employment. Its primary tool to achieve these two goals is by adjusting interest rates. When prices are rising too quickly and inflation is above the Fed’s 2% target, the Fed will raise rates, which helps the USD value. When inflation falls below 2% or the Unemployment Rate is too high, the Fed may lower interest rates, which weighs on the Greenback.
In extreme situations, the Federal Reserve can also print more Dollars and enact quantitative easing (QE). QE is the process by which the Fed substantially increases the flow of credit in a stuck financial system. It is a non-standard policy measure used when credit has dried up because banks will not lend to each other (out of the fear of counterparty default). It is a last resort when simply lowering interest rates is unlikely to achieve the necessary result. It was the Fed’s weapon of choice to combat the credit crunch that occurred during the Great Financial Crisis in 2008. It involves the Fed printing more Dollars and using them to buy US government bonds predominantly from financial institutions. QE usually leads to a weaker US Dollar.
Quantitative tightening (QT) is the reverse process whereby the Federal Reserve stops buying bonds from financial institutions and does not reinvest the principal from the bonds it holds maturing in new purchases. It is usually positive for the US Dollar.
-
13:50
JPY: No news is good news – Rabobank
Linked with the increase in BoJ rate hike expectations, USD/JPY has dropped from a January high in the 158.87 area back below 156.00 this week, Rabobank’s FX analyst Jane Folet reports.
USD /JPY can move back to 145 on a 12-month view
“Whether the currency pair can convincingly hold below the 155.00 area in the near-term will likely depend on two main factors. Firstly, the signals provided about the pace of tariffs announced by Trump will remain a key influence on the USD. The longer the delay, the later the resultant price hike faced by US consumers. This will provide the Fed will more scope to cut interest rates.”
“A second key factor for the USD/JPY outlook will be the relative hawkishness of BoJ Governor Ueda later this week. His tone will impact expectations regarding the timing of the next BoJ policy move. In Rabobank’s view, USD /JPY can move back to 145 on a 12-month view, though this assumes a cautious, but progressive trajectory for BoJ interest rate hikes.”
-
13:00
United States MBA Mortgage Applications dipped from previous 33.3% to 0.1% in January 17
-
12:36
India M3 Money Supply up to 10.1% in January 6 from previous 9.3%
-
12:26
USD/CAD Price Forecast: On tenterhooks around 1.4300
- USD/CAD trades with caution around 1.4300 as Trump threatens 25% tariff hikes on Canada.
- Canada PM Trudeau reiterated that the government is prepared to respond to Trump’s tariffs if announced.
- Investors expect the BoC to cut interest rates by 25 bps later this month.
The USD/CAD pair trades cautiously near 1.4300 in Wednesday’s European session. The Loonie pair remains under pressure as United States (US) President Donald Trump has suggested 25% tariffs on Mexico and China, which will come into effect on February 1. Trump’s tariff announcement has dampened Canada’s economic outlook.
In response to that Canadian Prime Minister Justin Trudeau said on Tuesday that his government is ready to “respond to all scenarios” if Trump imposes tariffs on Canada, Reuters report.
The overall appeal of the Canadian Dollar (CAD) remains weak against the US Dollar (USD) amid hopes of further increase in policy divergence. Investors expect the Bank of Canada (BoC) to cut interest rates further by 25 basis points (bps) to 3% in next week’s policy meeting. BoC dovish bets have accelerated after the release of the Consumer Price Index (CPI) data for December, which showed that the annual headline inflation decelerated to 1.8%.
On the contrary, the Federal Reserve (Fed) is expected to keep interest rates in the next three policy meetings, according to the CME FedWatch tool.
USD/CAD trades in a tight range of 1.4260-1.4465 for over a month. The outlook of the Loonie pair remains firm as the 50-day Exponential Moving Average (EMA) slopes higher, which trades around 1.4235.
The 14-day Relative Strength Index (RSI) falls into the 40.00-60.00 range, suggesting a sideways trend.
The rally in the Loonie pair could advance to near the round-level resistance of 1.4600 and Mar 2020 high of 1.4668 if the asset breaks above Tuesday’s high of 1.4518.
On the contrary, a downside move below the December 11 low of 1.4120 could drag the asset towards the December 4 high of around 1.4080, followed by the psychological support of 1.4000.
USD/CAD daily chart
Canadian Dollar FAQs
The key factors driving the Canadian Dollar (CAD) are the level of interest rates set by the Bank of Canada (BoC), the price of Oil, Canada’s largest export, the health of its economy, inflation and the Trade Balance, which is the difference between the value of Canada’s exports versus its imports. Other factors include market sentiment – whether investors are taking on more risky assets (risk-on) or seeking safe-havens (risk-off) – with risk-on being CAD-positive. As its largest trading partner, the health of the US economy is also a key factor influencing the Canadian Dollar.
The Bank of Canada (BoC) has a significant influence on the Canadian Dollar by setting the level of interest rates that banks can lend to one another. This influences the level of interest rates for everyone. The main goal of the BoC is to maintain inflation at 1-3% by adjusting interest rates up or down. Relatively higher interest rates tend to be positive for the CAD. The Bank of Canada can also use quantitative easing and tightening to influence credit conditions, with the former CAD-negative and the latter CAD-positive.
The price of Oil is a key factor impacting the value of the Canadian Dollar. Petroleum is Canada’s biggest export, so Oil price tends to have an immediate impact on the CAD value. Generally, if Oil price rises CAD also goes up, as aggregate demand for the currency increases. The opposite is the case if the price of Oil falls. Higher Oil prices also tend to result in a greater likelihood of a positive Trade Balance, which is also supportive of the CAD.
While inflation had always traditionally been thought of as a negative factor for a currency since it lowers the value of money, the opposite has actually been the case in modern times with the relaxation of cross-border capital controls. Higher inflation tends to lead central banks to put up interest rates which attracts more capital inflows from global investors seeking a lucrative place to keep their money. This increases demand for the local currency, which in Canada’s case is the Canadian Dollar.
Macroeconomic data releases gauge the health of the economy and can have an impact on the Canadian Dollar. Indicators such as GDP, Manufacturing and Services PMIs, employment, and consumer sentiment surveys can all influence the direction of the CAD. A strong economy is good for the Canadian Dollar. Not only does it attract more foreign investment but it may encourage the Bank of Canada to put up interest rates, leading to a stronger currency. If economic data is weak, however, the CAD is likely to fall.
-
12:00
South Africa Retail Sales (YoY) came in at 7.7%, above expectations (5.5%) in November
-
11:52
Gold edges higher as tariff hints further develop
- Gold extends bullish momentum after fresh comments from President Trump on incoming tariffs.
- Nobody seems safe, with the focus on China and Europe.
- Gold prints a fresh over two-month high and sets sail to the all-time high of $2,790.
Gold’s price (XAU/USD) extends its upside move and trades above $2,760 at the time of writing on Wednesday after booking over 1.20% gains the previous day. The bullish momentum is fueled by new US President Donald Trump’s comments on tariffs. This time, a 10% levy on Chinese goods triggered the leg higher in Bullion.
Meanwhile, investors remain focused on the implications of the Trump administration’s tariff and tax cut policies, which would likely erode the nation’s finances and lead to an inflation boom. That may limit the Federal Reserve’s (Fed) ability to keep easing monetary policy. Higher borrowing costs typically pose a headwind for Bullion regarding the correlation between the two assets.
Daily digest market movers: Tariff news keeps hitting
- Zimbabwe Gold exports rose to $1.44 billion last year from $1.22 billion in 2023, according to data from the Reserve Bank of Zimbabwe, Bloomberg reports.
- Silver futures briefly spiked after Trump’s comments on tariffs for China, Mexico and Canada. Mexico is the top miner of Silver, and it is unclear whether the tariffs would apply to imports of the metal, Reuters reports.
- US Treasuries cannot catch a breath and are on the backfoot again, with the US 10-year benchmark trading at 4.56%, not far from its yearly low near 4.528% seen on Tuesday.
Technical Analysis: Keep an eye on any inflation measure
All is well for Gold now, with the precious metal on a tear. However, that might quickly change once US inflation data comes in. Moreover, should inflation point to a resurgence in price pressures, expect to see Gold traders take their profit and run. So enjoy the rally, for now, as it could start to turn once inflation surges again.
Profit-taking could emerge and push Gold’s price back to $2,700, with the downward-slopping trendline of the broken pennant chart pattern last week at $2,668 as the next support. In case more downside occurs, the 55-day Simple Moving Average (SMA) and the 100-day SMA converging at around $2,649 is the next level to watch.
Gold is now on its way to $2,790, which is still over 1% away from current levels. Once above that, a fresh all-time high will present itself. Meanwhile, some analysts and strategists have penciled in calls for $3,000, but $2,800 looks to be a good starting point as the next resistance on the upside.
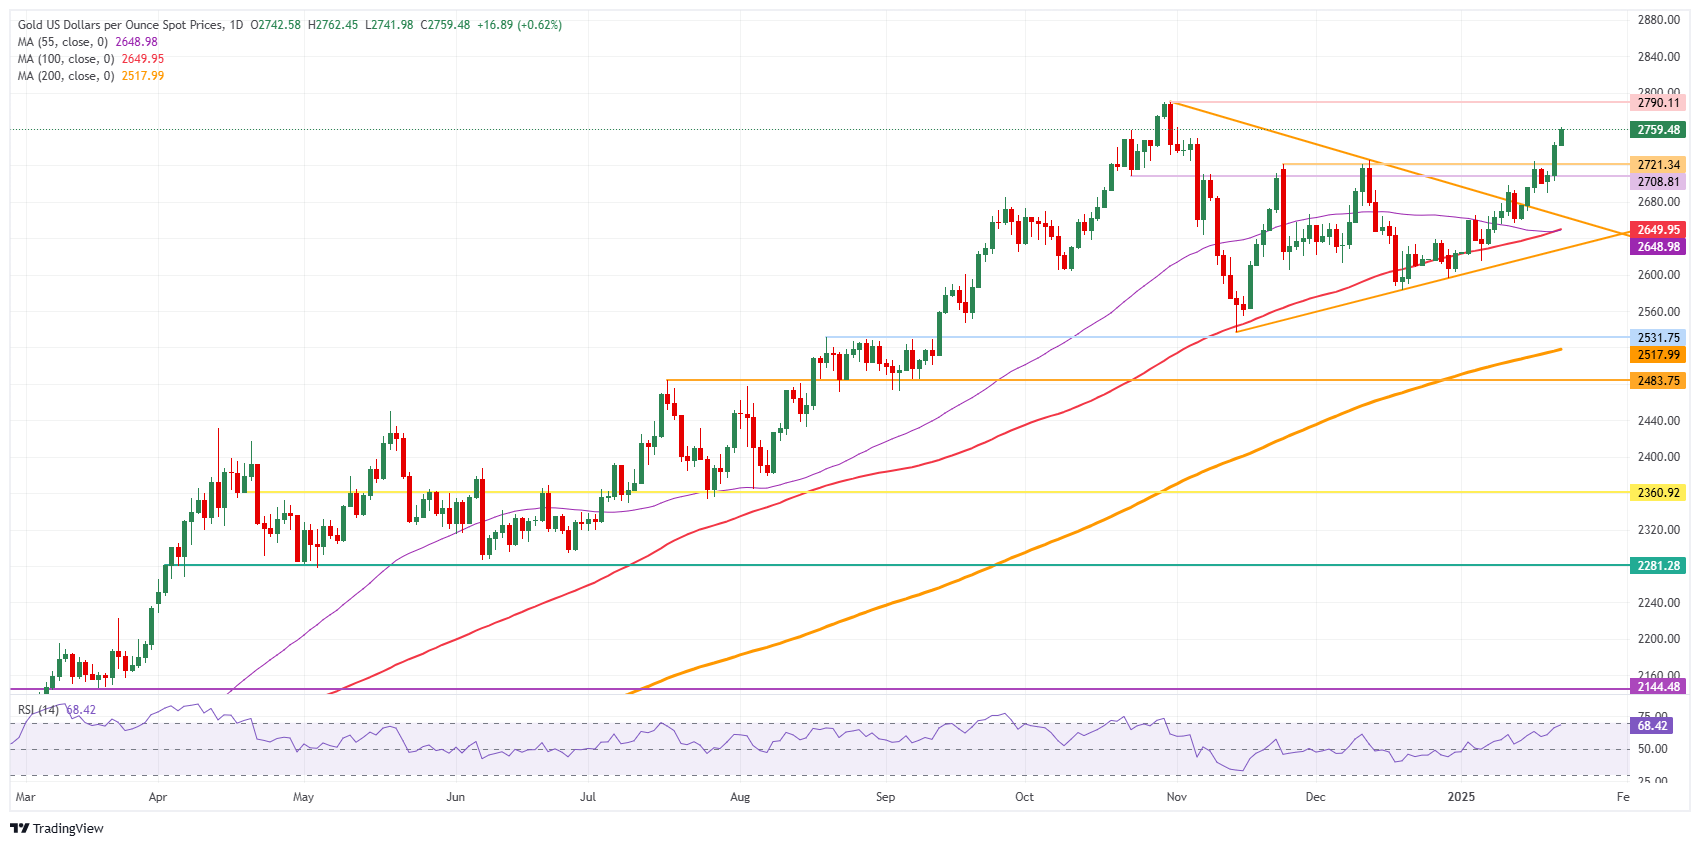
XAU/USD: Daily Chart
Gold FAQs
Gold has played a key role in human’s history as it has been widely used as a store of value and medium of exchange. Currently, apart from its shine and usage for jewelry, the precious metal is widely seen as a safe-haven asset, meaning that it is considered a good investment during turbulent times. Gold is also widely seen as a hedge against inflation and against depreciating currencies as it doesn’t rely on any specific issuer or government.
Central banks are the biggest Gold holders. In their aim to support their currencies in turbulent times, central banks tend to diversify their reserves and buy Gold to improve the perceived strength of the economy and the currency. High Gold reserves can be a source of trust for a country’s solvency. Central banks added 1,136 tonnes of Gold worth around $70 billion to their reserves in 2022, according to data from the World Gold Council. This is the highest yearly purchase since records began. Central banks from emerging economies such as China, India and Turkey are quickly increasing their Gold reserves.
Gold has an inverse correlation with the US Dollar and US Treasuries, which are both major reserve and safe-haven assets. When the Dollar depreciates, Gold tends to rise, enabling investors and central banks to diversify their assets in turbulent times. Gold is also inversely correlated with risk assets. A rally in the stock market tends to weaken Gold price, while sell-offs in riskier markets tend to favor the precious metal.
The price can move due to a wide range of factors. Geopolitical instability or fears of a deep recession can quickly make Gold price escalate due to its safe-haven status. As a yield-less asset, Gold tends to rise with lower interest rates, while higher cost of money usually weighs down on the yellow metal. Still, most moves depend on how the US Dollar (USD) behaves as the asset is priced in dollars (XAU/USD). A strong Dollar tends to keep the price of Gold controlled, whereas a weaker Dollar is likely to push Gold prices up.
-
11:34
Silver Price Forecast: XAG/USD revisits monthly high near $31 as US Dollar extends downside
- Silver price extends its upside to near $31.00 amid a sell-off in the US Dollar.
- The Greenback faces pressure as Trump has announced lower tariffs on China than expected.
- The Fed is expected to keep interest rates steady in the next three policy meetings.
Silver price (XAG/USD) reclaims a more-than-a-month high of $30.95 in Wednesday’s European session. The white metal strengthens as the US Dollar (USD) extends its downside due to less-fearful tariff plans announced by United States (US) President Donald Trump in his first two days of administration.
The US Dollar Index (DXY), which tracks the Greenback’s value against six major currencies, refreshes a two-week low at 107.80. The lower US Dollar makes the Silver price inexpensive for investors. 10-year US Treasury yields tick lower to near 4.57%.
Trump has announced 25% tariffs on Mexico and Canada and is discussing 10% tariffs on China from February 1. However, his comments during the election campaign indicated that the tariffs would be much higher than what he actually announced.
Lower tariffs by Trump would also weigh on market speculation that the Federal Reserve (Fed) will keep interest rates at their current levels for longer. Market participants were anticipating that higher tariffs would increase demand for domestically produced goods and services. This scenario would have accelerated inflationary pressures.
Currently, the CME FedWatch tool shows that traders are confident that the Fed will keep its key borrowing rates in the range of 4.25%-4.50% in the coming three policy meetings.
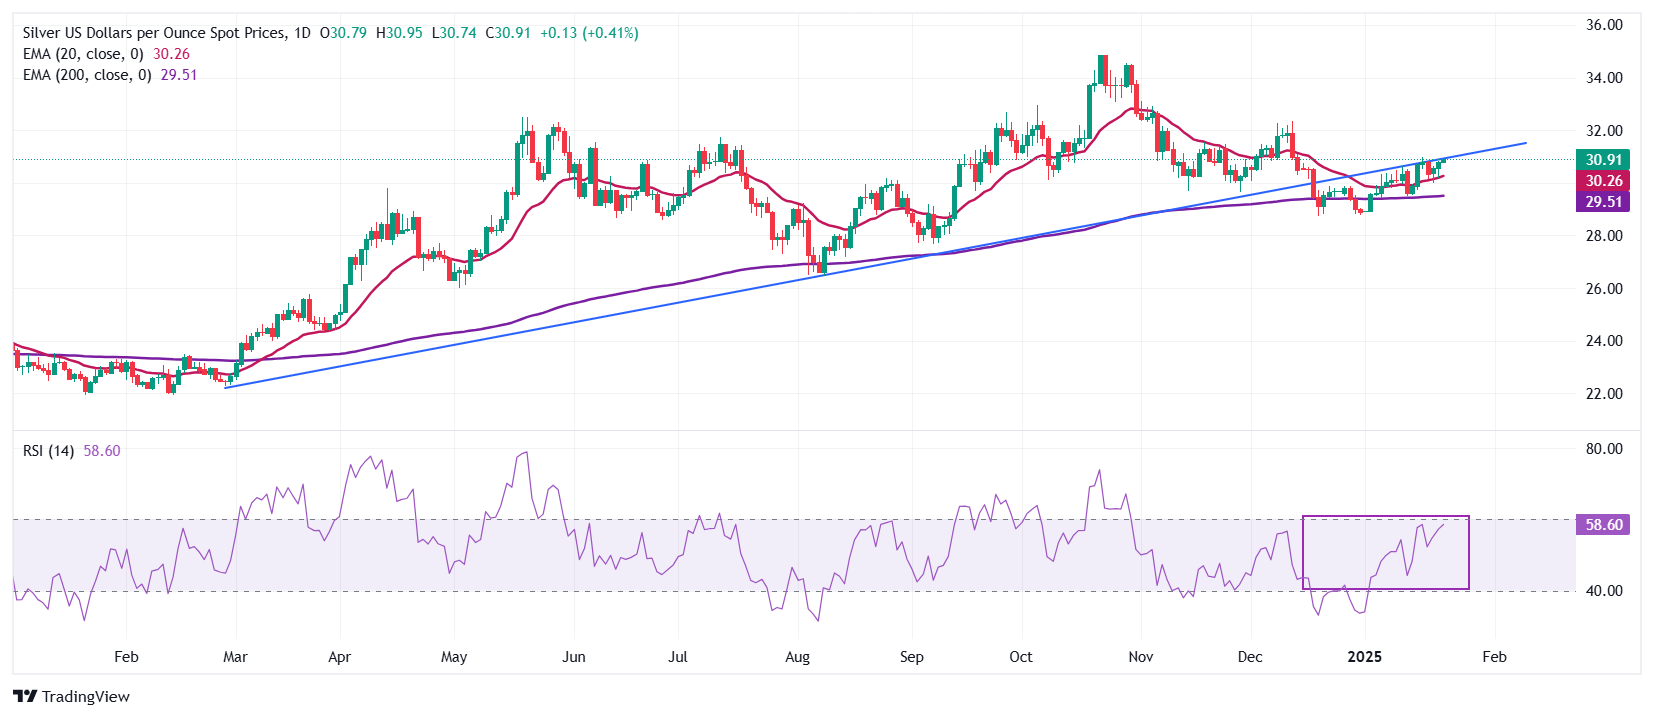
Silver technical analysis
Silver price gathers strength to return above the north-side sloping trendline near $30.85, which is plotted from the 29 February 2024 low of $22.30 on a daily timeframe.
The white metal discovered strong buying interest near the 200-day Exponential Moving Average (EMA), around $29.45, and has now extended its upside above the 20-day EMA, which is around $30.26. This suggests that the overall trend has turned bullish.
The 14-day Relative Strength Index (RSI) rises to near 60.00. A fresh bullish momentum would trigger if it manages to break above 60.00.
Silver daily chart
Silver FAQs
Silver is a precious metal highly traded among investors. It has been historically used as a store of value and a medium of exchange. Although less popular than Gold, traders may turn to Silver to diversify their investment portfolio, for its intrinsic value or as a potential hedge during high-inflation periods. Investors can buy physical Silver, in coins or in bars, or trade it through vehicles such as Exchange Traded Funds, which track its price on international markets.
Silver prices can move due to a wide range of factors. Geopolitical instability or fears of a deep recession can make Silver price escalate due to its safe-haven status, although to a lesser extent than Gold's. As a yieldless asset, Silver tends to rise with lower interest rates. Its moves also depend on how the US Dollar (USD) behaves as the asset is priced in dollars (XAG/USD). A strong Dollar tends to keep the price of Silver at bay, whereas a weaker Dollar is likely to propel prices up. Other factors such as investment demand, mining supply – Silver is much more abundant than Gold – and recycling rates can also affect prices.
Silver is widely used in industry, particularly in sectors such as electronics or solar energy, as it has one of the highest electric conductivity of all metals – more than Copper and Gold. A surge in demand can increase prices, while a decline tends to lower them. Dynamics in the US, Chinese and Indian economies can also contribute to price swings: for the US and particularly China, their big industrial sectors use Silver in various processes; in India, consumers’ demand for the precious metal for jewellery also plays a key role in setting prices.
Silver prices tend to follow Gold's moves. When Gold prices rise, Silver typically follows suit, as their status as safe-haven assets is similar. The Gold/Silver ratio, which shows the number of ounces of Silver needed to equal the value of one ounce of Gold, may help to determine the relative valuation between both metals. Some investors may consider a high ratio as an indicator that Silver is undervalued, or Gold is overvalued. On the contrary, a low ratio might suggest that Gold is undervalued relative to Silver.
-
11:18
USD/CNH: Decline in USD seems excessive – UOB Group
US Dollar (USD) could trade in a range of 7.2550/7.2950. In the longer run, decline in USD seems excessive, but there is potential for a test of 7.2420, UOB Group’s FX analysts Quek Ser Leang and Lee Sue Ann note.
Potential for USD/CNH to test 7.2420
24-HOUR VIEW: “After USD plunged two days ago, we indicated yesterday, ‘while further weakness is not ruled out, given the deeply oversold conditions, the major support at 7.2420 is likely out of reach (there is another support level at 7.2500).’ USD fell less than expected to 7.2530, rebounding to close largely unchanged at 7.2700 (+0.07%). The price action provides no fresh clues, and today, USD could trade in a range, likely in a range of 7.2550/7.2950.”
1-3 WEEKS VIEW: “We turned negative in USD yesterday (21 Jan, spot at 7.2720). We pointed out that ‘while the decline seems excessive, there is potential for USD to test the support at 7.2420.’ We will continue to hold the same view, provided that 7.3230 (‘strong resistance’ level was at 7.3380 yesterday) is not breached.”
-
11:10
Metal complex declines as Trump plans tariffs on Canada and Mexico – ING
Base metals declined yesterday after US President Trump said, on his first day back in power, that he will likely impose tariffs as high as 25% on Mexico and Canada by 1 February, ING’s commodity analysts Warren Patterson and Ewa Manthey note.
Downside risks for industrial metals increase
“Trump also indicated that he was still considering a universal tariff on all imports to the US, but said he was ‘not ready for that yet’. This has raised prospects of renewed global trade conflict once again.”
“Tariffs are the biggest risk to our industrial metals outlook. We believe with President Trump back in the White House, the downside risks have increased for industrial metals.”
-
11:08
USD/JPY: To trade in a range between 155.00 and 156.00 – UOB Group
US Dollar (USD) is likely to trade in a range between 155.00 and 156.00. In the longer run, despite no pickup in downward momentum, there is a chance for USD to drop further to 154.40, UOB Group’s FX analysts Quek Ser Leang and Lee Sue Ann note.
USD to drop further to 154.40
24-HOUR VIEW: “In early Asian trade yesterday, we noted that ‘downward momentum is building.’ We highlighted that USD ‘could break below 154.90, but the next major support at 154.40 is likely out of reach for now.’ We pointed out ‘resistance levels are at 155.75 and 156.25.’ Our view was not wrong, as USD/JPY rose to 156.20 and then plummeted to a low of 154.76. USD rebounded from the low before closing largely unchanged at 155.50 (-0.06%). Slowing downward momentum suggests the downward pressure is easing. Instead of weakening, today, USD is more likely to trade in a range between 155.00 and 156.00.”
1-3 WEEKS VIEW: “In our most recent narrative from last Friday (17 Jan, spot at 156.20), we indicated that USD ‘remains weak.’ We also indicated that ‘if it breaks below 154.90, the next objective will be at 154.40.’ Yesterday, USD fell below 154.90, rebounding from a low of 154.76. Despite no pickup in downward momentum, there is a chance for USD to drop further to 154.40. Overall, only a breach of 156.50 (‘strong resistance’ level previously at 156.70) would mean USD is not weakening further.”
-
11:03
Natural Gas: Freeport outage sees TTF surge – ING
The European natural gas market surged higher yesterday with TTF settling more than 4.5% higher on the day and above EUR50/MWh – the highest level since the first trading day of 2025, ING’s commodity analysts Warren Patterson and Ewa Manthey note.
Germany looks to subsidize the refill of gas storage
“The catalyst for the move appears to be an outage at the Freeport LNG export terminal in the US, which has been dealing with power issues which coincide with the freezing weather conditions the region is currently experiencing. Freeport, which has a capacity of a little more than 20bcm, said the plant will remain shut until power to the plant stabilizes.”
“Europe needs to pull in more LNG this winter with the loss of Russian pipeline flows through Ukraine, along with also stronger demand. EU gas storage has now fallen to 59% and the region will need to try to make sure it stays above the European Commission’s target of 50% full by 1 February.”
“In addition, Germany is potentially looking at subsidizing the refill of gas storage ahead of the 2025/26 winter, a discussion we are likely to see more of across the EU with the TTF forward curve providing little incentive for players to store gas for the next winter with summer 2025 prices trading at a premium to 2025/26 winter prices.”
-
11:01
ECB’s Escrivá: A 25 bps cut next week is a likely scenario
European Central Bank (ECB) policymaker José Luis Escrivá said on Wednesday that “a 25 basis points (bps) cut next week is a likely scenario.”
Additional quotes
ECB needs to wait for hard data to confirm forecasts.
Incoming information points towards converging to 2% inflation goal.
It is unclear whether there will be inflation spillovers from US policy.
To retain full optionality is more important than ever.
Market reaction
EUR/USD extends the rebound to near 1.0450 following these comments, up 0.18% on the day at press time.
-
10:57
USD/JPY: Hike has been priced in – OCBC
USD/JPY consolidated after the recent decline. Markets have nearly priced in a 25bp hike (92% probability) at the upcoming MPC (Friday). USD/JPY was last seen trading at 155.70, OCBC’s FX analysts Frances Cheung and Christopher Wong note.
Worry of BoJ dovish hike
“From a markets point of view, the risk is a dovish hike as this may suggest that USDJPY’s move lower may be more constrained. We remain of the view that BoJ has room to normalize policy as economic data (inflation wage growth) continues to support. Fast Retailing (Uniqlo) announced it will raise starting pay for new salary by 10%, and 5% for other employees. Meiji Yasuda announced raising wages by average of 5% for all 47k staff starting April. Elsewhere, JP CPI, PPI were all higher, paving the way for BoJ policy normalization.”
“But there is a risk that BoJ may prefer not to commit too early to future guidance to avoid unnecessary JPY strength from derailing any progress. On USD/JPY, divergence in Fed-BoJ policies should bring about further narrowing of UST-JGB yield differentials and this should underpin the broader direction of travel for USD/JPY to the downside. But the risk to the view is a slowdown in pace of policy normalization – be it the Fed or BoJ.”
“Daily momentum is bearish but RSI shows sign of rising. Consolidation is likely. Resistance at 157.10 (21 DMA), 158.80 (recent high). support at 154.90 (50 DMA), 154.30 (23.6% fibo retracement of Sep low to Jan high) and 152.80 (200 DMA).”
-
10:53
Oil comes under pressure with the growing threat of tariffs – ING
The oil market’s attention is slowly turning away from US sanctions against Russia towards President Trump’s potential trade policy, which saw Brent settle below US$80/bbl yesterday, ING’s commodity analysts Warren Patterson and Ewa Manthey note.
Trade and tariff risks are growing
“The president has reiterated his threats to impose a 25% tariff on imports from Canada and Mexico, potentially by 1 February.”
“Overnight, he also threatened 10% tariffs on China in retaliation to fentanyl flows from the country, which has kept some pressure on oil prices in early morning trading in Asia today. Clearly, trade and tariff risks and the potential for retaliation are growing.”
-
10:47
DXY: 2-way trades on a daily chart – OCBC
US Dollar (USD) bounced slightly on headlines that President Trump is considering a 10% tariff on China in retaliation for the flow of fentanyl on 1 February. Trump also said that ‘we are talking about a tariff of 10% on China based on the fact that they are sending fentanyl to Mexico and Canada’. DXY was last at 107.92 levels, OCBC’s FX analysts Frances Cheung and Christopher Wong note.
Risks skewed to the downside
“The threat of tariffs in consideration with a 1 Feb deadline instead of an immediate imposition of tariffs suggests that this is a strong urge for the parties to quickly return to the negotiating table to cut a deal. This also underscores the fluidity of tariff developments in a Trump regime. We reiterate our caution that the implications on markets can be very much 2-way, driven by headlines.”
“On one hand, tariff threats and eventual implementation of tariff is likely to weigh on sentiments and boost the USD. On the other hand, a longer delay on tariff announcement will continue to provide a breather for risk proxies while consensus trade (long USD) unwinds. For now, less drastic/ no immediate tariff plans are supportive of risk sentiments while taming USD bulls. As tariff concerns remain, it could still keep risk appetite restrained, implying that USD dips should still find support.”
Daily momentum is bearish while RSI fell. Risks skewed to the downside. Support at 107.80 (23.6% fibo retracement of Oct low to Jan high), 107.55 (50DMA). Bigger support lies at 106.40 (38.2% fibo). Resistance at 108.77 (21 DMA), 110.10 levels.
-
10:45
SNB’s Schlegel: We cannot exclude negative interest rates
“We cannot exclude negative interest rates,” Swiss National Bank (SNB) Chairman Martin Schlegel told Bloomberg TV at the World Economic Forum (WEF) in Davos.
Additional comments
Inflation is well inside our target range and over our forecast cycle.
Not uncomfortable with inflation at present.
SNB doesn't like negative rates but if we have to do it, we will.
Swiss Franc is traditionally a safe haven; trade conflicts are not beneficial for Switzerland.
We are ready to make currency market interventions if necessary again.
Another currency cap is not something we are discussing.
Market reaction
The Swiss Franc (CHF) pays little heed to these comments as USD/CHF flirts with intraday lows near 0.9050, down 0.19% so far.
SNB FAQs
The Swiss National Bank (SNB) is the country’s central bank. As an independent central bank, its mandate is to ensure price stability in the medium and long term. To ensure price stability, the SNB aims to maintain appropriate monetary conditions, which are determined by the interest rate level and exchange rates. For the SNB, price stability means a rise in the Swiss Consumer Price Index (CPI) of less than 2% per year.
The Swiss National Bank (SNB) Governing Board decides the appropriate level of its policy rate according to its price stability objective. When inflation is above target or forecasted to be above target in the foreseeable future, the bank will attempt to tame excessive price growth by raising its policy rate. Higher interest rates are generally positive for the Swiss Franc (CHF) as they lead to higher yields, making the country a more attractive place for investors. On the contrary, lower interest rates tend to weaken CHF.
Yes. The Swiss National Bank (SNB) has regularly intervened in the foreign exchange market in order to avoid the Swiss Franc (CHF) appreciating too much against other currencies. A strong CHF hurts the competitiveness of the country’s powerful export sector. Between 2011 and 2015, the SNB implemented a peg to the Euro to limit the CHF advance against it. The bank intervenes in the market using its hefty foreign exchange reserves, usually by buying foreign currencies such as the US Dollar or the Euro. During episodes of high inflation, particularly due to energy, the SNB refrains from intervening markets as a strong CHF makes energy imports cheaper, cushioning the price shock for Swiss households and businesses.
The SNB meets once a quarter – in March, June, September and December – to conduct its monetary policy assessment. Each of these assessments results in a monetary policy decision and the publication of a medium-term inflation forecast.
-
10:41
NZD/USD: Likely to trade between 0.5620 and 0.5690 – UOB Group
Current price movements are likely part of a range trading phase likely between 0.5620 and 0.5690. In the longer run, NZD is likely to continue to rise, potentially reaching the major resistance at 0.5750, ING’s FX analyst Francesco Pesole notes.
NZD is likely to continue to rise
24-HOUR VIEW: “Yesterday, we held the view that NZD ‘could break above 0.5700, but it might not be able to maintain a foothold above this level.’ However, NZD did not break above 0.5700, trading between 0.5622 and 0.5688. The current price movements are likely part of a range trading phase, probably between 0.5620 and 0.5690.”
1-3 WEEKS VIEW: “Our update from yesterday (21 Jan, spot at 0.5680) remains valid. As highlighted, NZD ‘is likely to continue to rise, potentially reaching the major resistance at 0.5750.’ On the downside, should NZD break below 0.5600 (no change in ‘strong support’ level) it would mean that the current upward pressure has eased.”
-
10:36
NZD: Inflation data paves the way for half-point cut – ING
New Zealand released fourth quarter inflation figures overnight. Headline CPI was flat at 2.2% versus expectations for 2.1%, while the closely monitored non-tradable index slowed slightly faster than expected from 4.9% to 4.5%, the lowest level since the fourth quarter of 2021 and 0.2% below the Reserve Bank of New Zealand's November projections, ING’s FX analyst Francesco Pesole notes.
NZD/USD can find some support beyond the 0.570 mark
“This set of figures paves the way for a 50bp RBNZ cut at the 19 February meeting, which markets are now fully pricing in. We expect that 50bp move to be followed by at least two more 25bp cuts to take rates to 3.25%, as the RBNZ is following the widespread shift in central banks to growth concerns and should be keen to frontload some easing.”
“In the short term, NZD/USD can find some support beyond the 0.570 mark as markets see the risks of US tariffs on China as tentatively lower. NZD was the biggest short in G10 according to latest CFTC positioning data, so the technical picture is supportive despite the recent rebound. Ultimately, Trump’s trade agenda will determine how far NZD/USD can recover. From a domestic perspective, the RBNZ should give little support to its currency.”
-
10:35
ECB’s Villeroy: Disinflation process is still on track
European Central Bank (ECB) policymaker Francois Villeroy de Galhau said on Wednesday that “disinflation process is still on track.”
Additional quotes
It is too early to tell but we could expect inflationary effects from new US policies.
There could be decoupling between ECB and Fed on rates, but it is a non-issue.
Market reaction
EUR/USD holds the bounce near 1.0430 following these comments, modestly flat on the day at press time.
-
10:34
EUR/USD gains as Trump’s moderately fearful tariff plan diminishes USD’s appeal
- EUR/USD remains firm above 1.0400 as US President Donald Trump has announced lower-than-anticipated tariffs on China.
- ECB’s Lagarde warned that the Euro bloc should be prepared for US tariffs.
- ECB’s Stournaras commented that the policy-easing pace could accelerate if the US imposes tariffs on the Eurozone.
EUR/USD clings to gains above the key support of 1.0400 in Wednesday’s European session after a strong recovery move in North American trading hours on Tuesday. The major currency pair remains firm while investors gauge explicit United States (US) tariff plans to build fresh positions.
In two working days, US President Donald Trump has announced 25% tariffs on Mexico and Canada and 10% on China, which will come into effect on February 1. Trump has also threatened to fix trade imbalances with the Eurozone but has not yet provided clear details. On Monday, Trump said he would remedy the trade imbalance either by “raising tariffs or Europe buying more US oil and gas”.
These tariff calls appear less fearful than what market participants had anticipated from Trump’s election campaign comments, diminishing the US Dollar’s (USD) safe-haven demand. The US Dollar Index (DXY), which tracks the Greenback’s value against six major currencies, trades with caution to near its two-week low of 107.90.
Daily digest market movers: EUR/USD remains firm despite ECB Stournaras sees interest rates near 2% by 2025
- EUR/USD has significantly recovered in the past few trading days. However, its outlook remains uncertain, as President Trump has threatened to impose tariffs on the Eurozone. Additionally, the European Central Bank (ECB) is expected to unwind its policy restrictiveness further and move toward the neutral target of 2%.
- In response to Trump’s threat of tariff hikes, European Union (EU) ministers have commented that they should improve the bloc’s competitiveness and developing capital markets rather than retaliate. ECB’s President Christine Lagarde said in an interview with CNBC on the sidelines of the World Economic Forum (WEF) on Wednesday that Europe must be “prepared for any US tariffs”. Lagarde added that tariffs would be more “selective.”
- EU-US trade relations have also worsened because of Trump’s withdrawal of American membership from the Paris Climate Agreement, which directs members to establish their own targets for reducing greenhouse gas emissions.
- On the monetary policy front, traders price in four 25 basis points (bps) interest rate cuts by the ECB coming consecutively in the next four meetings. ECB policymaker and the Governor of the Bank of Greece Yannis Stournaras said that interest rate cuts should be at the order of “25 bps each time to get close to 2% by the end of 2025”. Stournaras warned that possible US tariffs would “speed up interest rate cuts” in the Eurozone.
Technical Analysis: EUR/USD clings to gains around 1.0430
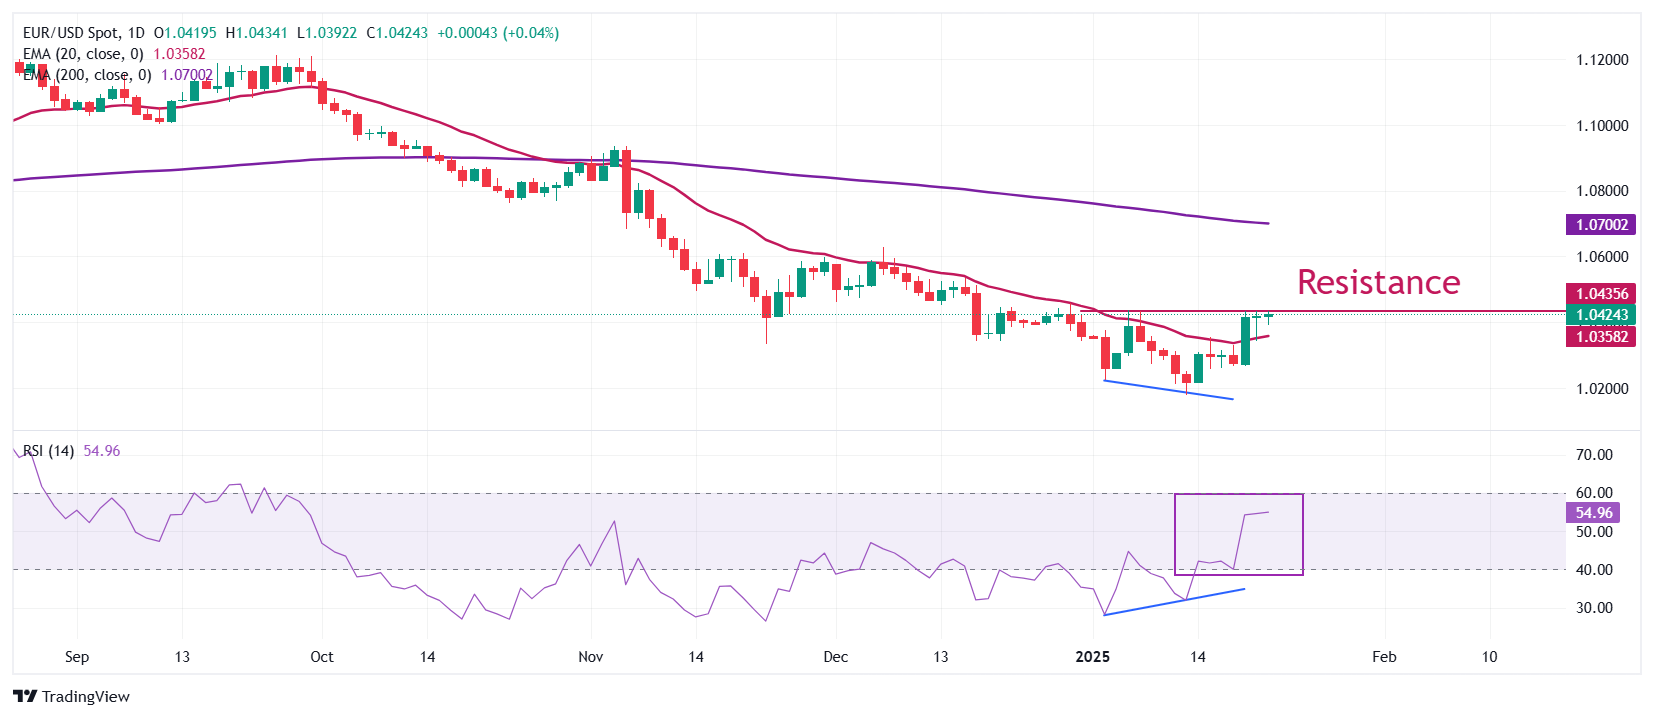
EUR/USD trades firmly near its two-week high of 1.0430 in Wednesday’s European session after rebounding from an over two-year low of 1.0175. The major currency pair recovered after a divergence in momentum and price action. The 14-day Relative Strength Index (RSI) formed a higher low, while the pair made lower lows. The negative divergence would be confirmed if the pair decisively breaks above the immediate resistance of 1.0440
The near-term outlook of the shared currency pair has improved as it has climbed above the 20-day Exponential Moving Average (EMA), which trades around 1.0358. Meanwhile, the longer-term outlook is still bearish as the 200-day EMA at 1.0700 is sloping downwards.
Looking down, the January 13 low of 1.0175 will be the key support zone for the pair. Conversely, the psychological resistance of 1.0500 will be the key barrier for the Euro bulls.
Euro FAQs
The Euro is the currency for the 19 European Union countries that belong to the Eurozone. It is the second most heavily traded currency in the world behind the US Dollar. In 2022, it accounted for 31% of all foreign exchange transactions, with an average daily turnover of over $2.2 trillion a day. EUR/USD is the most heavily traded currency pair in the world, accounting for an estimated 30% off all transactions, followed by EUR/JPY (4%), EUR/GBP (3%) and EUR/AUD (2%).
The European Central Bank (ECB) in Frankfurt, Germany, is the reserve bank for the Eurozone. The ECB sets interest rates and manages monetary policy. The ECB’s primary mandate is to maintain price stability, which means either controlling inflation or stimulating growth. Its primary tool is the raising or lowering of interest rates. Relatively high interest rates – or the expectation of higher rates – will usually benefit the Euro and vice versa. The ECB Governing Council makes monetary policy decisions at meetings held eight times a year. Decisions are made by heads of the Eurozone national banks and six permanent members, including the President of the ECB, Christine Lagarde.
Eurozone inflation data, measured by the Harmonized Index of Consumer Prices (HICP), is an important econometric for the Euro. If inflation rises more than expected, especially if above the ECB’s 2% target, it obliges the ECB to raise interest rates to bring it back under control. Relatively high interest rates compared to its counterparts will usually benefit the Euro, as it makes the region more attractive as a place for global investors to park their money.
Data releases gauge the health of the economy and can impact on the Euro. Indicators such as GDP, Manufacturing and Services PMIs, employment, and consumer sentiment surveys can all influence the direction of the single currency. A strong economy is good for the Euro. Not only does it attract more foreign investment but it may encourage the ECB to put up interest rates, which will directly strengthen the Euro. Otherwise, if economic data is weak, the Euro is likely to fall. Economic data for the four largest economies in the euro area (Germany, France, Italy and Spain) are especially significant, as they account for 75% of the Eurozone’s economy.
Another significant data release for the Euro is the Trade Balance. This indicator measures the difference between what a country earns from its exports and what it spends on imports over a given period. If a country produces highly sought after exports then its currency will gain in value purely from the extra demand created from foreign buyers seeking to purchase these goods. Therefore, a positive net Trade Balance strengthens a currency and vice versa for a negative balance.
-
10:30
AUD/USD: Current price action is likely the early stages of a recovery – UOB Group
Australian Dollar (AUD) is likely to trade in a sideways range between 0.6220 and 0.6290. In the longer run, current price action is likely the early stages of a recovery phase that could potentially reach 0.6350, UOB Group’s FX analysts Quek Ser Leang and Lee Sue Ann note.
To keep the momentum, AUD must not break below 0.6190
24-HOUR VIEW: “Yesterday, we indicated that ‘provided that 0.6205 is not breached, AUD could break above 0.6305.’ The ensuing price movements did not turn out as we expected, with AUD fluctuating between 0.6209 and 0.6289. Upward momentum has slowed to an extent, and AUD is likely to trade sideways today, expected to be between 0.6220 and 0.6290.”
1-3 WEEKS VIEW: “Following the strong rise in AUD on Monday, we highlighted yesterday (21 Jan, spot at 0.6275) that ‘the current price action is likely the early stages of a recovery phase that could potentially reach 0.6350.’ We also indicated that ‘to keep the momentum going, AUD must not break below 0.6190.’ Our view remains unchanged.”
-
10:30
Silver price today: Silver rises, according to FXStreet data
Silver prices (XAG/USD) rose on Wednesday, according to FXStreet data. Silver trades at $30.87 per troy ounce, up 0.25% from the $30.79 it cost on Tuesday.
Silver prices have increased by 6.83% since the beginning of the year.
Unit measure Silver Price Today in USD Troy Ounce 30.87 1 Gram 0.99 The Gold/Silver ratio, which shows the number of ounces of Silver needed to equal the value of one ounce of Gold, stood at 89.21 on Wednesday, up from 89.08 on Tuesday.
Silver FAQs
Silver is a precious metal highly traded among investors. It has been historically used as a store of value and a medium of exchange. Although less popular than Gold, traders may turn to Silver to diversify their investment portfolio, for its intrinsic value or as a potential hedge during high-inflation periods. Investors can buy physical Silver, in coins or in bars, or trade it through vehicles such as Exchange Traded Funds, which track its price on international markets.
Silver prices can move due to a wide range of factors. Geopolitical instability or fears of a deep recession can make Silver price escalate due to its safe-haven status, although to a lesser extent than Gold's. As a yieldless asset, Silver tends to rise with lower interest rates. Its moves also depend on how the US Dollar (USD) behaves as the asset is priced in dollars (XAG/USD). A strong Dollar tends to keep the price of Silver at bay, whereas a weaker Dollar is likely to propel prices up. Other factors such as investment demand, mining supply – Silver is much more abundant than Gold – and recycling rates can also affect prices.
Silver is widely used in industry, particularly in sectors such as electronics or solar energy, as it has one of the highest electric conductivity of all metals – more than Copper and Gold. A surge in demand can increase prices, while a decline tends to lower them. Dynamics in the US, Chinese and Indian economies can also contribute to price swings: for the US and particularly China, their big industrial sectors use Silver in various processes; in India, consumers’ demand for the precious metal for jewellery also plays a key role in setting prices.
Silver prices tend to follow Gold's moves. When Gold prices rise, Silver typically follows suit, as their status as safe-haven assets is similar. The Gold/Silver ratio, which shows the number of ounces of Silver needed to equal the value of one ounce of Gold, may help to determine the relative valuation between both metals. Some investors may consider a high ratio as an indicator that Silver is undervalued, or Gold is overvalued. On the contrary, a low ratio might suggest that Gold is undervalued relative to Silver.
(An automation tool was used in creating this post.)
-
10:21
USD: Corporate tax discussion in focus – ING
Trump’s day two in office was dominated by the threat to reshape tax systems for multinational companies. As part of a memorandum originally published on Monday, the president is tasking the US Treasury with investigating discriminatory taxes on US citizens or corporations, ING’s FX analyst Francesco Pesole notes.
New layers of uncertainty for markets to contemplate
“Along with the floated possibility of withdrawing from the OECD agreement on a minimum corporate tax, the US is considering double taxation on some foreign individuals and companies established in the US. It is admittedly hard to draw conclusions on how tangible this threat is, or the implications for US and foreign corporations for now. It is likely another layer of uncertainty to which markets are getting accustomed.”
“On the hot tariff topic, the focus has remained on Canada and Mexico after Monday’s threat to impose 25% tariffs. After another round of dollar weakness in yesterday’s US session, CAD and MXN are now trading around 1% stronger compared to Friday. We read that as a signal that markets are still reluctant to price in the full extent of the tariff impact, and perhaps still hanging on to hopes that tariffs will be delayed further on the back of some cooperation on migration. Downside risks for both CAD and MXN remain elevated.”
“Today’s US calendar only includes the Leading Index and MBA mortgage applications, which in the week ending 10 January (published last week) jumped 33%, the highest since March 2020. We’ll see whether markets have the will take 10-year Treasury yields back to 4.50%, which can add to the dollar’s soft momentum. Our rates team remains bearish on UST beyond the very near term, and that fits our view that the dollar can withstand temporary positioning squeezes.”
-
10:17
EUR/CAD Price Forecast: Trades near 1.4950 after pulling back from monthly highs
- EUR/CAD may retest monthly highs, followed by the two-month high at the 1.5060 level.
- The 14-day RSI maintains its position above the 50 mark, indicating a persistent bullish momentum.
- The pair could find initial support around the nine-day Exponential Moving Average at 1.4872 level.
EUR/CAD ends its four-day losing streak, trading near 1.4940 during European trading hours on Wednesday. Technical analysis on the daily chart points to a bullish bias, with the currency cross continuing to trade within an ascending channel pattern.
The 14-day Relative Strength Index (RSI), a key measure of overbought or oversold conditions, remains slightly above the 50 mark, signaling ongoing bullish momentum. A further rise in the RSI could reinforce the bullish trend.
If the RSI climbs above the 60 mark, it may indicate stronger upward momentum, potentially pushing EUR/CAD toward the 1.5050–1.5150 range. However, this level could face selling pressure, potentially challenging the strength of the rally.
On the upside, the EUR/CAD cross could test its two-month high at the 1.5060 level, reached on December 18, followed by the "pullback resistance" near 1.5150. A break above this resistance could drive the currency cross toward the upper boundary of the ascending channel at the 1.5250 level.
Support levels for the EUR/CAD cross may be found at the nine-day Exponential Moving Average (EMA) around 1.4872, followed by the 14-day EMA at 1.4866. A break below these levels could weaken short-term price momentum, potentially putting downward pressure on the currency cross.
The downward pressure could lead the EUR/CAD cross to test the lower boundary of the ascending channel at the 1.4750 level, which may act as support, slowing further declines. However, if this level is decisively broken, it would signal a bearish shift, opening the door for EUR/CAD to approach its 11-month low of 1.4488, recorded on November 22.
EUR/CAD: Daily Chart
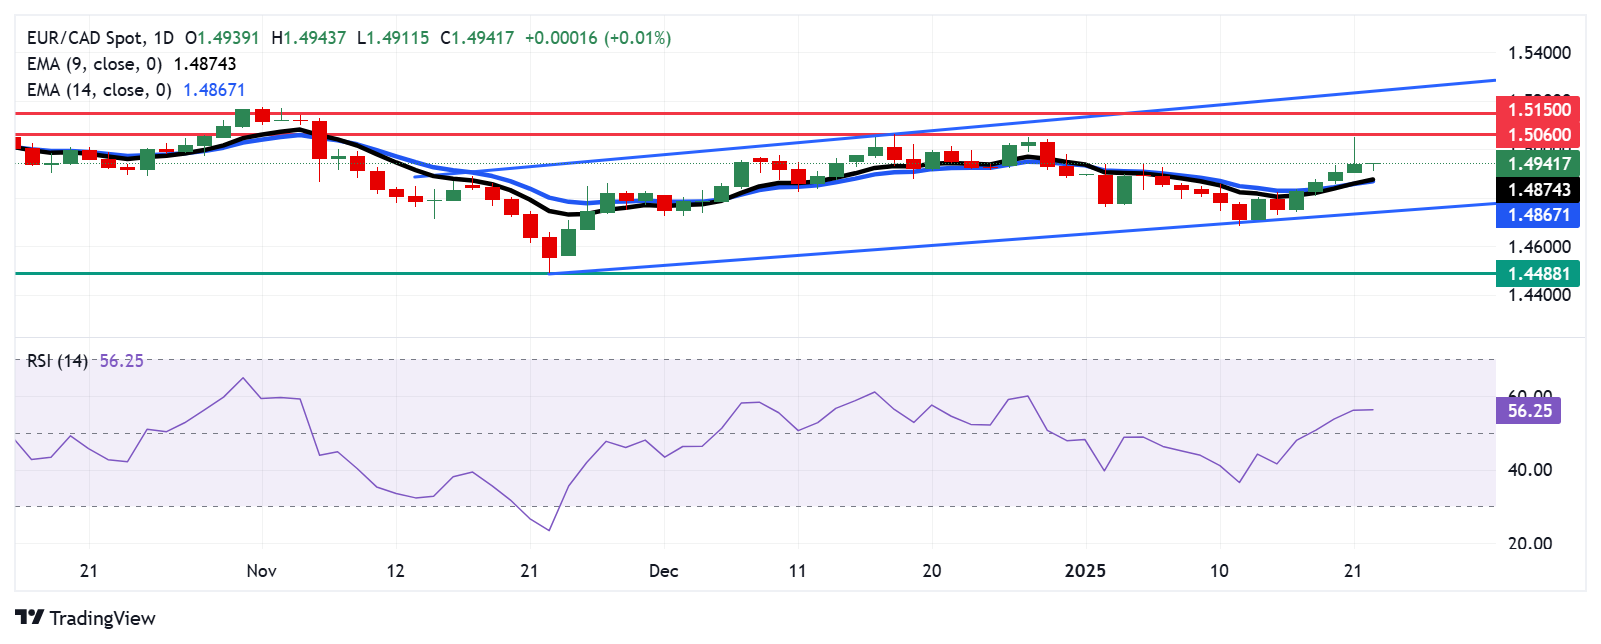
Euro PRICE Today
The table below shows the percentage change of Euro (EUR) against listed major currencies today. Euro was the weakest against the Australian Dollar.
USD EUR GBP JPY CAD AUD NZD CHF USD -0.08% -0.07% 0.19% -0.07% -0.09% -0.01% -0.06% EUR 0.08% 0.01% 0.29% 0.00% -0.01% 0.06% 0.02% GBP 0.07% -0.01% 0.25% -0.01% -0.02% 0.05% 0.00% JPY -0.19% -0.29% -0.25% -0.25% -0.27% -0.21% -0.25% CAD 0.07% -0.01% 0.00% 0.25% -0.02% 0.05% 0.00% AUD 0.09% 0.01% 0.02% 0.27% 0.02% 0.07% 0.03% NZD 0.01% -0.06% -0.05% 0.21% -0.05% -0.07% -0.05% CHF 0.06% -0.02% -0.00% 0.25% -0.00% -0.03% 0.05% The heat map shows percentage changes of major currencies against each other. The base currency is picked from the left column, while the quote currency is picked from the top row. For example, if you pick the Euro from the left column and move along the horizontal line to the US Dollar, the percentage change displayed in the box will represent EUR (base)/USD (quote).
-
10:06
EUR/USD: Bulls need to clear 50-DMA for sustained momentum – OCBC
Euro (EUR) held on to recent gains as fear of universal tariff takes a back seat. EUR was last at 1.0421 levels, OCBC’s FX analysts Frances Cheung and Christopher Wong note.
Break out 1.0440 exposes the pair to 1.05
“Daily momentum is mild bullish but rise in RSI moderated. Some consolidation is likely for now in absence of catalyst. Immediate resistance at 1.0440 (50 DMA). Break out exposes the pair to 1.05, 1.0570 levels (38.2% fibo retracement of Sep high to Jan low). Support at 1.0340 (21 DMA), 1.0240, 1.02 (recent low).”
-
09:59
GBP/USD: GBP set to test 1.2375 – UOB Group
Chance for Pound Sterling (GBP) to test 1.2375; major resistance at 1.2410 is unlikely to come into view. GBP view is positive, anticipating a move to 1.2410, UOB Group’s FX analysts Quek Ser Leang and Lee Sue Ann note.
Resistance at 1.2410 is unlikely to come into view
24-HOUR VIEW: “While we expected GBP to ‘continue to advance’ yesterday, we indicated that ‘the significant resistance at 1.2410 is probably out of reach.’ Our view was incorrect. Instead of continuing to advance, GBP traded between 1.2232 and 1.2361. GBP closed slightly higher by 0.23% at 1.2358. Although there is no significant increase in momentum, there is a chance for GBP to test 1.2375. The major resistance at 1.2410 is unlikely to come into view. On the downside, support levels are at 1.2300 and 1.2260.”
1-3 WEEKS VIEW: “We revised our GBP view to positive yesterday (21 Jan, spot at 1.2330), anticipating a move to 1.2410. We indicated that ‘we will maintain our view as long as the ‘strong support’ level, currently at 1.2210, is not breached.’ Our view remains unchanged.”
-
09:55
EUR: 1.050 would be stretch – ING
For a second day in a row, EUR/USD got support from a dollar decline but fell short of the 1.0440 mark, ING’s FX analysts Francesco Pesole notes.
Markets to consolidate their expectations for four rate cuts
“There still seems to be some resistance to take the pair back to the 1.0450-1.050 mark, which would close the gap with its short-term fair value, that we currently estimate at 1.0580. In fact, 1.050 would mark a shift to essentially pricing out most of the Trump tariff risk on the eurozone. That is probably premature.”
“On domestic eurozone news, a number of European Central Bank members are speaking in Davos, including President Christine Lagarde, Francois Villeroy, Klaas Knot and Olli Rehn. Yesterday, Bundesbank governor Joachim Nagel confirmed the ECB should cut rates by 25bp next week and reiterated the widely shared view that more cuts can follow. He is generally considered among the most hawkish Governing Council members, and that was another signal there is no resistance left to the dovish front.”
“We expect today’s comments to follow the same line and markets to consolidate their expectations for four rate cuts by the ECB this year.”
-
09:39
EUR/USD: Current price action is part of a recovery phase – UOB Group
Euro (EUR) is likely to trade in a range, probably between 1.0345 and 1.0440. In the longer run, current price action is part of a recovery phase that could extend to 1.0480, UOB Group’s FX analysts Quek Ser Leang and Lee Sue Ann note.
Recovery phase can extend to 1.0480
24-HOUR VIEW: “EUR surged two days ago. Yesterday, we pointed out that ‘there is potential for EUR to rise above 1.0440.’ Our view did not materialize, as EUR swung between 1.0341 and 1.0435, closing at 1.0429 (+0.14%). There has been no further increase in momentum. Today, EUR is likely to trade in a range, probably between 1.0345 and 1.0440.”
1-3 WEEKS VIEW: “Yesterday (21 Jan), when EUR was at 1.0415, we indicated that ‘the current price action is part of a recovery phase that could extend to 1.0480.’ There is no change in our view, as long as 1.0320 (‘strong support’ level was at 1.0305 yesterday) is intact.”
-
09:25
WTI drops below $75.50 as facing challenges due to Trump policies
- WTI price depreciated as US President Donald Trump reaffirmed his proposal for a 10% tariff on imports from China.
- Oil prices declined as markets assessed the impact of President Trump’s declaration of a national energy emergency.
- US sanctions on Russia have disrupted physical Oil and tanker markets, providing support to Oil prices.
West Texas Intermediate (WTI) Oil price declines for the fifth consecutive session, trading near $75.40 per barrel during European trading hours on Wednesday. The drop in crude Oil prices comes after US President Donald Trump reiterated his proposal for a 10% tariff on imports from China, the world's largest Oil importer.
Although the proposed 10% tariff is considerably lower than the previously threatened 60%, it aligns with Trump’s campaign promise. The announcement follows a recent phone call between Trump and Chinese President Xi Jinping, where they discussed key topics, including trade and the fentanyl crisis.
On the other hand, Oil prices may have found some support from Trump’s proposed 25% tariff on Canadian crude Oil imports. This measure is seen as a potential driver of higher market prices, as Canada exports nearly all its crude to the United States (US), often at a discount to WTI. “US sanctions increase the risk of higher costs for most of Canada’s oil exports,” noted Vivek Dhar, a Commonwealth Bank analyst.
Markets also weighed the potential implications of President Trump's pledges to boost Oil production. These include declaring a national energy emergency to streamline permitting, opening up additional drilling acreage, and reversing Biden-era clean energy policies.
Meantime, recent US sanctions on Russia have disrupted physical Oil and tanker markets, providing some residual support to Oil prices. Elsewhere, a severe winter storm swept across the US Gulf Coast on Tuesday, significantly impacting Oil production. North Dakota’s output dropped by an estimated 130,000 to 160,000 barrels per day (bpd), according to the state’s pipeline authority.
WTI Oil FAQs
WTI Oil is a type of Crude Oil sold on international markets. The WTI stands for West Texas Intermediate, one of three major types including Brent and Dubai Crude. WTI is also referred to as “light” and “sweet” because of its relatively low gravity and sulfur content respectively. It is considered a high quality Oil that is easily refined. It is sourced in the United States and distributed via the Cushing hub, which is considered “The Pipeline Crossroads of the World”. It is a benchmark for the Oil market and WTI price is frequently quoted in the media.
Like all assets, supply and demand are the key drivers of WTI Oil price. As such, global growth can be a driver of increased demand and vice versa for weak global growth. Political instability, wars, and sanctions can disrupt supply and impact prices. The decisions of OPEC, a group of major Oil-producing countries, is another key driver of price. The value of the US Dollar influences the price of WTI Crude Oil, since Oil is predominantly traded in US Dollars, thus a weaker US Dollar can make Oil more affordable and vice versa.
The weekly Oil inventory reports published by the American Petroleum Institute (API) and the Energy Information Agency (EIA) impact the price of WTI Oil. Changes in inventories reflect fluctuating supply and demand. If the data shows a drop in inventories it can indicate increased demand, pushing up Oil price. Higher inventories can reflect increased supply, pushing down prices. API’s report is published every Tuesday and EIA’s the day after. Their results are usually similar, falling within 1% of each other 75% of the time. The EIA data is considered more reliable, since it is a government agency.
OPEC (Organization of the Petroleum Exporting Countries) is a group of 12 Oil-producing nations who collectively decide production quotas for member countries at twice-yearly meetings. Their decisions often impact WTI Oil prices. When OPEC decides to lower quotas, it can tighten supply, pushing up Oil prices. When OPEC increases production, it has the opposite effect. OPEC+ refers to an expanded group that includes ten extra non-OPEC members, the most notable of which is Russia.
-
09:16
Lagarde speech: No US tariff is what I expected
Speaking in a CNBC interview on the sidelines of the World Economic Forum (WEF) annual meetings in Davos on Wednesday, European Central Bank (ECB) President Christine Lagarade said that “no US tariff is what I expected, a smart approach.”
She added that “doesn't mean to say it won't happen, will be more selective.”
Additional quotes
Not surprised by Trump's tariff threats.
Europe must be prepared and anticipate what will happen in order to respond.
We're confident euro zone inflation will be at target over the course of 2025.
We're not overly concerned about export of inflation to Europe.
Exchange rate will be of interest, may have consequences.
If we'll see if early 2025 delivers reduction in services inflation.
We don't see ourselves behind curve.
I'll be attentive to price of energy, haven't anticipated decline in energy prices.
Gradual moves in rates come to mind at moment.
Market reaction
EUR/USD was last seen trading 0.11% lower on the day at 1.0415.
-
09:00
South Africa Consumer Price Index (MoM) rose from previous 0% to 0.1% in December
-
09:00
South Africa Consumer Price Index (YoY) climbed from previous 2.9% to 3% in December
-
08:48
GBP/JPY advances to near 192.00 despite a dovish sentiment surrounding the BoE
- GBP/JPY could face challenges as the BoE is widely expected to lower its interest rate in February.
- The Japanese Yen could gain support due to the increased likelihood of the BoJ hiking interest rates later this week.
- Tomoko Yoshino, the head of Japan's largest trade union, Rengo, reaffirms the ongoing momentum for wage increases in Japan.
GBP/JPY continues to remain in positive territory for the fourth successive day, trading around 192.00 during the European hours on Wednesday. However, this upside of the GBP/JPY cross could be limited as the Pound Sterling (GBP) remains under pressure after the release of labor market data from the United Kingdom (UK) on Tuesday.
The ILO Unemployment Rate unexpectedly rose to 4.4%, along with the sharpest drop in payroll numbers since November 2020, signaling a potential weakening in the labor market. Following the labor market report, analysts at Nomura noted that this data provides the BoE with a "green light to cut in February." Markets are also betting on one or two more reductions after February.
Last week's data pointed to an unforeseen slowdown in inflation and weaker-than-expected economic growth. As a result, the Bank of England (BoE) is widely anticipated to lower the key interest rate by 25 basis points to 4.5% during its policy meeting on February 6.
Additionally, the GBP/JPY cross may depreciate as the Japanese Yen (JPY) could draw support from rising expectations that the Bank of Japan (BoJ) will hike interest rates later this week. Hawkish comments from Bank of Japan (BoJ) officials, combined with optimism that rising wages will help Japan sustainably achieve its 2% inflation target, bolster expectations for a potential rate hike on Friday.
Tomoko Yoshino, head of Japan's largest trade union, Rengo, echoed the BoJ’s sentiment, affirming the momentum for wage increases. The BoJ has consistently emphasized that sustained, broad-based wage growth is a key prerequisite for raising short-term interest rates.
Interest rates FAQs
Interest rates are charged by financial institutions on loans to borrowers and are paid as interest to savers and depositors. They are influenced by base lending rates, which are set by central banks in response to changes in the economy. Central banks normally have a mandate to ensure price stability, which in most cases means targeting a core inflation rate of around 2%. If inflation falls below target the central bank may cut base lending rates, with a view to stimulating lending and boosting the economy. If inflation rises substantially above 2% it normally results in the central bank raising base lending rates in an attempt to lower inflation.
Higher interest rates generally help strengthen a country’s currency as they make it a more attractive place for global investors to park their money.
Higher interest rates overall weigh on the price of Gold because they increase the opportunity cost of holding Gold instead of investing in an interest-bearing asset or placing cash in the bank. If interest rates are high that usually pushes up the price of the US Dollar (USD), and since Gold is priced in Dollars, this has the effect of lowering the price of Gold.
The Fed funds rate is the overnight rate at which US banks lend to each other. It is the oft-quoted headline rate set by the Federal Reserve at its FOMC meetings. It is set as a range, for example 4.75%-5.00%, though the upper limit (in that case 5.00%) is the quoted figure. Market expectations for future Fed funds rate are tracked by the CME FedWatch tool, which shapes how many financial markets behave in anticipation of future Federal Reserve monetary policy decisions.
-
08:46
Pound Sterling holds onto gains against USD as investors gauge Trump’s tariff plans
- The Pound Sterling grips gains above 1.2300 against the US Dollar in the absence of explicit Trump tariff plans.
- Trump threatens to impose 10% tariffs on China on February 1, lower than the 60% vowed in the election campaign.
- Investors expect the BoE to reduce interest rates by 25 bps in February.
The Pound Sterling (GBP) ticks lower against the US Dollar (USD) in Wednesday’s London session but still holds onto Tuesday’s gains above the key support level of 1.2300. The GBP/USD pair edges lower as the US Dollar recovers slightly, with the US Dollar Index (DXY), which tracks the Greenback’s value against six major currencies, edging higher from its two-week low of 107.90.
However, the Greenback could face selling pressure as its safe-haven demand has moderated. The USD’s safe-haven appeal has diminished as the tariff plans disclosed by the United States (US) administration under President Donald Trump are less fearful than what investors had anticipated in the election campaign. Trump said on Tuesday that he would impose 10% tariffs on China on February 1, the same day he vowed to slap 25% tariffs on other North American economies. In the election campaign, Trump threatened to impose 60% tariffs on China.
Market experts believe that tariffs would come in a more balanced way, due to which the risk premium of the US Dollar has diminished. A cautious tariff approach would also trim upside risks to inflation remaining persistent, weighing on firm expectations that the Federal Reserve (Fed) will keep interest rates at their current levels for longer.
According to the CME FedWatch tool, traders are confident that the Fed will keep its key borrowing rates in the range of 4.25%-4.50% in the upcoming three policy meetings.
Daily digest market movers: Pound Sterling outperforms its peers
- The Pound Sterling performs strongly against its major peers on Wednesday as market sentiment turns favorable for risk-perceived currencies amid ambiguity over Trump’s tariff plans. However, its outlook is still uncertain as the Bank of England (BoE) is almost certain to cut interest rates by 25 basis points (bps) to 4.5% in the policy meeting in February.
- Soft United Kingdom (UK) inflation and Retail Sales data for December, weak labor demand in three months ending November, and moderate Gross Domestic Product (GDP) growth have forced traders to price in a 25 bps interest rate reduction by the BoE next month.
- However, high wage growth is still a major concern for the BoE, given that wage pressures are the key driving force for inflation in the service sector. The Office for National Statistics (ONS) reported on Tuesday that Average Earnings Excluding Bonuses rose at a robust pace of 5.6%, faster than estimates of 5.5% and the former 5.2%.
- Going forward, investors will focus on the preliminary S&P Global/CIPS Purchasing Managers Index (PMI) data for January, which will be published on Friday.
Technical Analysis: Pound Sterling strives to climb above 20-day EMA
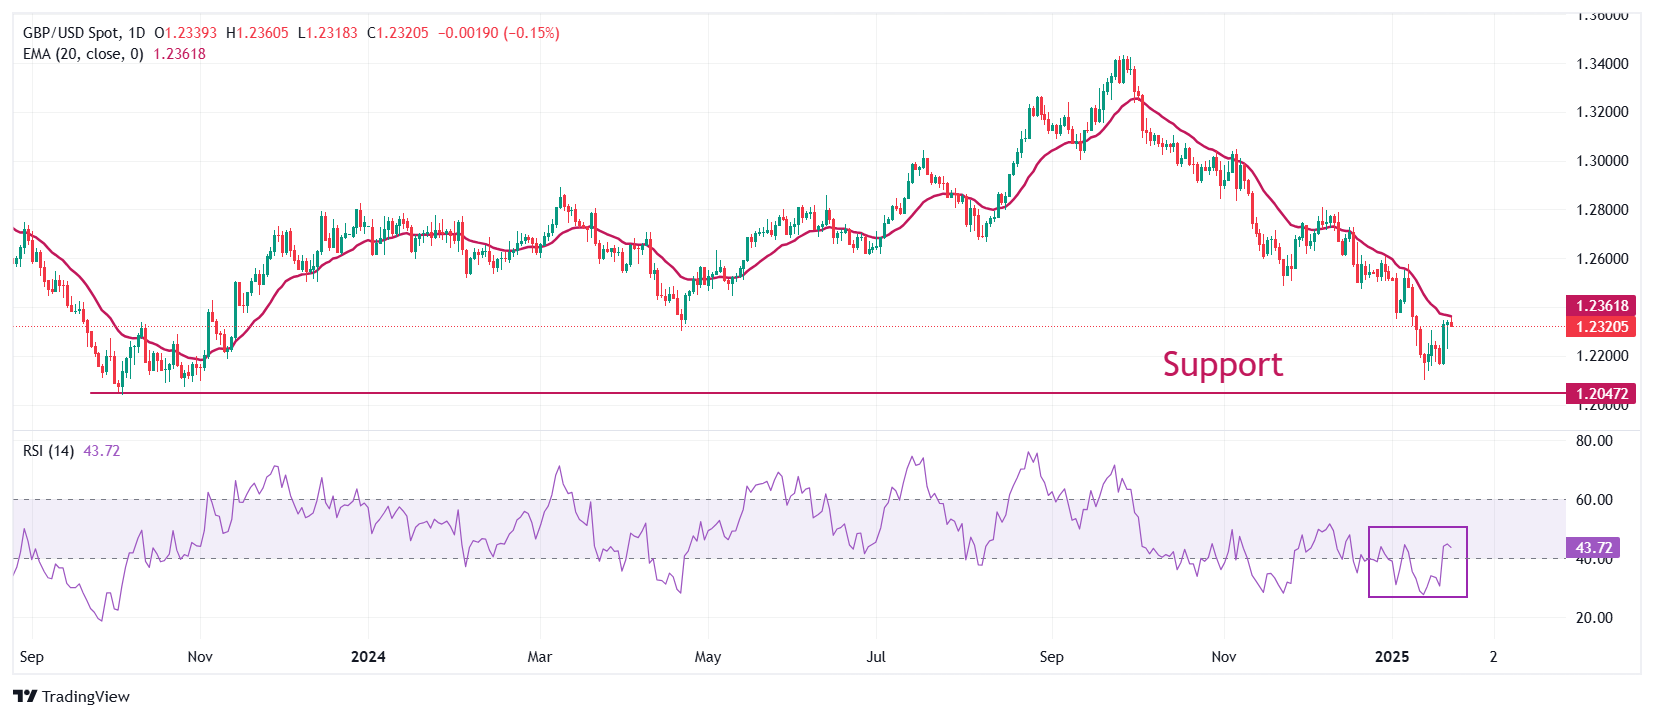
The Pound Sterling strives to break above the 20-day Exponential Moving Average (EMA), which trades around 1.2360, against the US Dollar. The GBP/USD pair rebounded after posting a fresh over-one-year low of 1.2100 on January 13.
The 14-day Relative Strength Index (RSI) rebounds to near 43.50 from the 20.00-40.00 range, suggesting that the bearish momentum has ended, at least for now.
Looking down, the pair is expected to find support near the October 2023 low of 1.2050. On the upside, the round level of 1.2400 will act as key resistance.
Pound Sterling FAQs
The Pound Sterling (GBP) is the oldest currency in the world (886 AD) and the official currency of the United Kingdom. It is the fourth most traded unit for foreign exchange (FX) in the world, accounting for 12% of all transactions, averaging $630 billion a day, according to 2022 data. Its key trading pairs are GBP/USD, also known as ‘Cable’, which accounts for 11% of FX, GBP/JPY, or the ‘Dragon’ as it is known by traders (3%), and EUR/GBP (2%). The Pound Sterling is issued by the Bank of England (BoE).
The single most important factor influencing the value of the Pound Sterling is monetary policy decided by the Bank of England. The BoE bases its decisions on whether it has achieved its primary goal of “price stability” – a steady inflation rate of around 2%. Its primary tool for achieving this is the adjustment of interest rates. When inflation is too high, the BoE will try to rein it in by raising interest rates, making it more expensive for people and businesses to access credit. This is generally positive for GBP, as higher interest rates make the UK a more attractive place for global investors to park their money. When inflation falls too low it is a sign economic growth is slowing. In this scenario, the BoE will consider lowering interest rates to cheapen credit so businesses will borrow more to invest in growth-generating projects.
Data releases gauge the health of the economy and can impact the value of the Pound Sterling. Indicators such as GDP, Manufacturing and Services PMIs, and employment can all influence the direction of the GBP. A strong economy is good for Sterling. Not only does it attract more foreign investment but it may encourage the BoE to put up interest rates, which will directly strengthen GBP. Otherwise, if economic data is weak, the Pound Sterling is likely to fall.
Another significant data release for the Pound Sterling is the Trade Balance. This indicator measures the difference between what a country earns from its exports and what it spends on imports over a given period. If a country produces highly sought-after exports, its currency will benefit purely from the extra demand created from foreign buyers seeking to purchase these goods. Therefore, a positive net Trade Balance strengthens a currency and vice versa for a negative balance.
-
08:25
NZD/USD falls to near 0.5650 following inflation data, focus on Trump’s tariff plans
- NZD/USD depreciates as annual inflation remains within the RBNZ target range of 1-3% in December.
- US President Donald Trump's administration is considering imposing a 10% tariff on Chinese imports.
- The US Dollar maintains its position as Trump confirmed that the proposal for universal tariff hikes is still under consideration.
NZD/USD extends its losses for the second consecutive day, trading around 0.5650 during the early European hours on Wednesday. The New Zealand Dollar (NZD) received downward pressure following the latest domestic inflation figures.
New Zealand's Consumer Price Index (CPI) remained steady at 2.2% year-over-year in Q4 2024, marginally exceeding expectations but staying within the Reserve Bank of New Zealand's (RBNZ) target range of 1-3%. Quarterly, the CPI increased by 0.5%, showing a slight moderation from the 0.6% rise recorded in the previous quarter.
The data suggested that price pressures remained largely contained, reinforcing expectations for another jumbo rate cut from the Reserve Bank of New Zealand (RBNZ) in February. Swaps markets are now pricing in a 90% chance of another 50 basis points (bps) reduction on February 19, adding to the two delivered earlier in the cycle. The RBNZ is expected to deliver a total of 100 bps of rate cuts for the remainder of 2025.
Additionally, the NZD/USD pair remains subdued due to increased risk-off sentiment as US President Donald Trump announced that his administration is considering imposing a 10% tariff on Chinese imports starting February 1.
The US Dollar (USD) holds onto modest gains as US President Donald Trump confirmed that the proposal for universal tariff hikes is still under consideration, although he stated, "We are not ready for that yet." Additionally, Trump issued a memorandum directing federal agencies to investigate and address the ongoing trade deficits.
Moreover, the USD could recover its recent losses in the near term as the US Federal Reserve (Fed) is expected to maintain its benchmark overnight rate in the 4.25%-4.50% range during its January meeting. Investors anticipate that Trump's policies could increase inflationary pressures, which might limit the Fed to only one more rate cut.
New Zealand Dollar FAQs
The New Zealand Dollar (NZD), also known as the Kiwi, is a well-known traded currency among investors. Its value is broadly determined by the health of the New Zealand economy and the country’s central bank policy. Still, there are some unique particularities that also can make NZD move. The performance of the Chinese economy tends to move the Kiwi because China is New Zealand’s biggest trading partner. Bad news for the Chinese economy likely means less New Zealand exports to the country, hitting the economy and thus its currency. Another factor moving NZD is dairy prices as the dairy industry is New Zealand’s main export. High dairy prices boost export income, contributing positively to the economy and thus to the NZD.
The Reserve Bank of New Zealand (RBNZ) aims to achieve and maintain an inflation rate between 1% and 3% over the medium term, with a focus to keep it near the 2% mid-point. To this end, the bank sets an appropriate level of interest rates. When inflation is too high, the RBNZ will increase interest rates to cool the economy, but the move will also make bond yields higher, increasing investors’ appeal to invest in the country and thus boosting NZD. On the contrary, lower interest rates tend to weaken NZD. The so-called rate differential, or how rates in New Zealand are or are expected to be compared to the ones set by the US Federal Reserve, can also play a key role in moving the NZD/USD pair.
Macroeconomic data releases in New Zealand are key to assess the state of the economy and can impact the New Zealand Dollar’s (NZD) valuation. A strong economy, based on high economic growth, low unemployment and high confidence is good for NZD. High economic growth attracts foreign investment and may encourage the Reserve Bank of New Zealand to increase interest rates, if this economic strength comes together with elevated inflation. Conversely, if economic data is weak, NZD is likely to depreciate.
The New Zealand Dollar (NZD) tends to strengthen during risk-on periods, or when investors perceive that broader market risks are low and are optimistic about growth. This tends to lead to a more favorable outlook for commodities and so-called ‘commodity currencies’ such as the Kiwi. Conversely, NZD tends to weaken at times of market turbulence or economic uncertainty as investors tend to sell higher-risk assets and flee to the more-stable safe havens.
-
08:14
EUR/GBP flat lines near 0.8450 amid Trump tariff threats, growing BoE rate cut bets
- EUR/GBP trades flat around 0.8440 in Wednesday’s early European session.
- The Euro weakens after Trump vowed to hit the EU with tariffs.
- UK Unemployment Rate rose in the three months through November, increasing the chance the BoE will cut rates next month.
The EUR/GBP cross holds steady around 0.8440 on Wednesday during the early European trading hours. US President Donald Trump tariff threats could undermine the Euro (EUR) against the Pound Sterling (GBP) in the near term. However, the rising likelihood the Bank of England (BoE) will lower rates next month might cap the downside for the cross. Investors will closely monitor the speech by the European Central Bank’s (ECB) President Lagarde later on Wednesday.
Trump on Tuesday vowed to hit the European Union (EU) with tariffs and said his administration was discussing 25% tariffs against Canada and Mexico, as well as duties on China. Valdis Dombrovskis, the European Union’s commissioner for the economy, said on Wednesday that Europe will respond to any tariffs imposed by Trump in a proportionate way.
“If there is a need to defend our economic interests, we will respond in a proportionate way,” said Dombrovskis. The concerns about an economic slowdown in the Eurozone economy and uncertainty surrounding Trump’s tariff threats could exert some selling pressure on the shared currency.
On the other hand, financial markets see a greater chance of an interest rate cut at the BoE meeting after the recent UK labor market data showed rising rates of Unemployment Rate and wage growth. This, in turn, might weigh on the GBP and cap the downside for the cross. The markets have priced in a nearly 91% odds of reduction at the meeting on February 6. “We still think the Bank of England will cut interest rates at the next meeting in February, from 4.75% to 4.50%, and continue to cut rates gradually thereafter,” noted Capital Economics analysts.Pound Sterling FAQs
The Pound Sterling (GBP) is the oldest currency in the world (886 AD) and the official currency of the United Kingdom. It is the fourth most traded unit for foreign exchange (FX) in the world, accounting for 12% of all transactions, averaging $630 billion a day, according to 2022 data. Its key trading pairs are GBP/USD, also known as ‘Cable’, which accounts for 11% of FX, GBP/JPY, or the ‘Dragon’ as it is known by traders (3%), and EUR/GBP (2%). The Pound Sterling is issued by the Bank of England (BoE).
The single most important factor influencing the value of the Pound Sterling is monetary policy decided by the Bank of England. The BoE bases its decisions on whether it has achieved its primary goal of “price stability” – a steady inflation rate of around 2%. Its primary tool for achieving this is the adjustment of interest rates. When inflation is too high, the BoE will try to rein it in by raising interest rates, making it more expensive for people and businesses to access credit. This is generally positive for GBP, as higher interest rates make the UK a more attractive place for global investors to park their money. When inflation falls too low it is a sign economic growth is slowing. In this scenario, the BoE will consider lowering interest rates to cheapen credit so businesses will borrow more to invest in growth-generating projects.
Data releases gauge the health of the economy and can impact the value of the Pound Sterling. Indicators such as GDP, Manufacturing and Services PMIs, and employment can all influence the direction of the GBP. A strong economy is good for Sterling. Not only does it attract more foreign investment but it may encourage the BoE to put up interest rates, which will directly strengthen GBP. Otherwise, if economic data is weak, the Pound Sterling is likely to fall.
Another significant data release for the Pound Sterling is the Trade Balance. This indicator measures the difference between what a country earns from its exports and what it spends on imports over a given period. If a country produces highly sought-after exports, its currency will benefit purely from the extra demand created from foreign buyers seeking to purchase these goods. Therefore, a positive net Trade Balance strengthens a currency and vice versa for a negative balance.
-
08:11
Forex Today: US Dollar holds ground as markets assess possible US trade policies
Here is what you need to know on Wednesday, January 22:
Following a rebound during the European trading hours on Tuesday, the US Dollar (USD) lost its momentum as risk flows dominated the action in the second half of the day. Early Wednesday, the USD Index holds its ground as markets turn cautious. The economic calendar will not feature any high-tier macroeconomic data releases.
US Dollar PRICE This week
The table below shows the percentage change of US Dollar (USD) against listed major currencies this week. US Dollar was the weakest against the Euro.
USD EUR GBP JPY CAD AUD NZD CHF USD -1.35% -1.20% -0.28% -0.87% -1.07% -1.12% -0.70% EUR 1.35% 0.09% 0.99% 0.37% 0.34% 0.12% 0.53% GBP 1.20% -0.09% 0.84% 0.28% 0.26% 0.03% 0.44% JPY 0.28% -0.99% -0.84% -0.59% -0.76% -0.95% -0.61% CAD 0.87% -0.37% -0.28% 0.59% -0.14% -0.25% 0.18% AUD 1.07% -0.34% -0.26% 0.76% 0.14% -0.31% 0.12% NZD 1.12% -0.12% -0.03% 0.95% 0.25% 0.31% 0.23% CHF 0.70% -0.53% -0.44% 0.61% -0.18% -0.12% -0.23% The heat map shows percentage changes of major currencies against each other. The base currency is picked from the left column, while the quote currency is picked from the top row. For example, if you pick the US Dollar from the left column and move along the horizontal line to the Japanese Yen, the percentage change displayed in the box will represent USD (base)/JPY (quote).
US President Donald Trump's tariff threats on Mexico and Canada allowed safe-haven flows to drive the action in financial markets early Tuesday, helping the USD gather strength against its rivals. The bullish opening in Wall Street's main indexes, however, made it difficult for the USD to continue to outperform its rivals in the American session. Meanwhile, Trump said late Tuesday that he is considering imposing a 10% tariff on Chinese imports, arguing that fentanyl they are sending to Canada and Mexico end up in the US. In the European morning on Wednesday, US stock index futures trade mixed, while the USD Index clings to small daily gains above 108.00.
The data from New Zealand showed early Wednesday that the Consumer Price Index (CPI) rose 2.2% on a yearly basis in the fourth quarter, matching the previous quarter's increase but coming in above the market expectation of 2.1%. NZD/USD stays under modest bearish pressure and trades at around 0.5650.
Statistics Canada reported on Tuesday that the annual inflation, as measured by the change in the CPI, edged lower to 1.8% in December from 1.9% in October. On a monthly basis, the CPI declined by 0.4%. Following Tuesday's volatile action, USD/CAD holds steady at around 1.4350 in the European morning on Wednesday.
Following a downward correction in the European session, EUR/USD regained its traction and closed marginally higher on Tuesday. The pair consolidates its weekly gains at around 1.0400 early Wednesday. Later in the session, European Central Bank President Christine Lagarde will be speaking at a panel at the World Economic Forum in Davos.
GBP/USD edges lower in the European trading hours on Wednesday but manages to hold above 1.2300 after posting small gains on Tuesday.
Gold gathered bullish momentum and rose more than 1% on Tuesday. After touching its highest level since early November near $2,760 in the Asian session on Wednesday, XAU/USD retreated slightly and was last seen trading near $2,750.
USD/JPY extends its sideways grind slightly below 156.00 on Wednesday as investors refrain from taking large positions ahead of the Bank of Japan's monetary policy meeting on Friday.
US Dollar FAQs
The US Dollar (USD) is the official currency of the United States of America, and the ‘de facto’ currency of a significant number of other countries where it is found in circulation alongside local notes. It is the most heavily traded currency in the world, accounting for over 88% of all global foreign exchange turnover, or an average of $6.6 trillion in transactions per day, according to data from 2022. Following the second world war, the USD took over from the British Pound as the world’s reserve currency. For most of its history, the US Dollar was backed by Gold, until the Bretton Woods Agreement in 1971 when the Gold Standard went away.
The most important single factor impacting on the value of the US Dollar is monetary policy, which is shaped by the Federal Reserve (Fed). The Fed has two mandates: to achieve price stability (control inflation) and foster full employment. Its primary tool to achieve these two goals is by adjusting interest rates. When prices are rising too quickly and inflation is above the Fed’s 2% target, the Fed will raise rates, which helps the USD value. When inflation falls below 2% or the Unemployment Rate is too high, the Fed may lower interest rates, which weighs on the Greenback.
In extreme situations, the Federal Reserve can also print more Dollars and enact quantitative easing (QE). QE is the process by which the Fed substantially increases the flow of credit in a stuck financial system. It is a non-standard policy measure used when credit has dried up because banks will not lend to each other (out of the fear of counterparty default). It is a last resort when simply lowering interest rates is unlikely to achieve the necessary result. It was the Fed’s weapon of choice to combat the credit crunch that occurred during the Great Financial Crisis in 2008. It involves the Fed printing more Dollars and using them to buy US government bonds predominantly from financial institutions. QE usually leads to a weaker US Dollar.
Quantitative tightening (QT) is the reverse process whereby the Federal Reserve stops buying bonds from financial institutions and does not reinvest the principal from the bonds it holds maturing in new purchases. It is usually positive for the US Dollar.
-
08:06
ECB's Knot sees little obstacle to another rate cut next week
European Central Bank (ECB) policymaker and a hawk Klaas Knot noted on Wednesday that he “sees little obstacle to another rate cut next week.”
Further comments
Data is encouraging, confirms that we'll return to target.
Hopes to see recovery in economy, then we'll take it from there.
There is new downside risk from trade policy on growth, impact on inflation not so clear.
But pretty comfortable with market expectations for the next two meetings.
But if recovery continues, not too convinced that we need to into "stimulative mode".
Separately, his colleague Yannis Stournaras said that “rates should be close to 2% by end of the year.”
Market reaction
EUR/USD maintains its offered tone near 1.0400 following these dovish comments, losing 0.16% on the day.
ECB FAQs
The European Central Bank (ECB) in Frankfurt, Germany, is the reserve bank for the Eurozone. The ECB sets interest rates and manages monetary policy for the region. The ECB primary mandate is to maintain price stability, which means keeping inflation at around 2%. Its primary tool for achieving this is by raising or lowering interest rates. Relatively high interest rates will usually result in a stronger Euro and vice versa. The ECB Governing Council makes monetary policy decisions at meetings held eight times a year. Decisions are made by heads of the Eurozone national banks and six permanent members, including the President of the ECB, Christine Lagarde.
In extreme situations, the European Central Bank can enact a policy tool called Quantitative Easing. QE is the process by which the ECB prints Euros and uses them to buy assets – usually government or corporate bonds – from banks and other financial institutions. QE usually results in a weaker Euro. QE is a last resort when simply lowering interest rates is unlikely to achieve the objective of price stability. The ECB used it during the Great Financial Crisis in 2009-11, in 2015 when inflation remained stubbornly low, as well as during the covid pandemic.
Quantitative tightening (QT) is the reverse of QE. It is undertaken after QE when an economic recovery is underway and inflation starts rising. Whilst in QE the European Central Bank (ECB) purchases government and corporate bonds from financial institutions to provide them with liquidity, in QT the ECB stops buying more bonds, and stops reinvesting the principal maturing on the bonds it already holds. It is usually positive (or bullish) for the Euro.
-
08:01
United Kingdom Public Sector Net Borrowing above forecasts (£13.4B) in December: Actual (£17.811B)
-
07:11
FX option expiries for Jan 22 NY cut
FX option expiries for Jan 22 NY cut at 10:00 Eastern Time via DTCC can be found below.
EUR/USD: EUR amounts
- 1.0270 1.3b
- 1.0300 1.3b
- 1.0345 1.5b
- 1.0350 2.2b
- 1.0375 1b
- 1.0400 1.5b
- 1.0500 1.4b
USD/JPY: USD amounts
- 154.55 623m
- 155.50 1.4b
- 156.45 610m
AUD/USD: AUD amounts
- 0.6210 2.2b
- 0.6245 538m
USD/CAD: USD amounts
- 1.4345 510m
- 1.4360 510m
- 1.4500 1.1b
NZD/USD: NZD amounts
- 0.5450 450m
EUR/GBP: EUR amounts
- 0.8290 607m
-
07:10
USD/CHF strengthens above 0.9050 after Trump’s remarks on tariffs
- USD/CHF recovers to around 0.9070 in Wednesday’s early European session.
- Trump's plans for tariffs lift the USD broadly.
- The safe-haven flows could boost the CHF and create a headwind for USD/CHF.
The USD/CHF pair rebounds to around 0.9070, snapping the two-day losing streak during the early European trading hours on Wednesday. The uptick of the pair is bolstered by the stronger US Dollar (USD) broadly after US President Donald Trump said on Tuesday that he will impose tariffs and duties on trading partners.
Late Tuesday, Trump said that his team was discussing 25% tariffs against Canada and Mexico, as well as duties on China and the European Union. Trump added that the actions could take effect as early as February 1. “We’re talking about a tariff of 10% on China based on the fact that they’re sending fentanyl to Mexico and Canada,” said Trump. Analysts expect Trump’s administration could trigger inflationary pressures, potentially convincing the US Federal Reserve (Fed) to cut rates only once this year, supporting the USD.
The rising expectation that the Swiss National Bank (SNB) would continue to cut the interest rates might weigh on the Swiss Franc (CHF) against the USD. The rate has already been lowered to 0.5% due to concerns over inflation remaining below the SNB’s goal.
On the other hand, the ongoing geopolitical tensions between Russia and Ukraine could boost the safe-haven flows, benefiting the CHF. Ukraine launched a wave of drones into Russia, causing a fire at an oil storage and explosions at a plant producing military aircraft, the Ukrainian army said on Tuesday. Investors will also monitor the developments surrounding the ceasefire agreement and a hostage release deal between Israel and Hamas.Swiss Franc FAQs
The Swiss Franc (CHF) is Switzerland’s official currency. It is among the top ten most traded currencies globally, reaching volumes that well exceed the size of the Swiss economy. Its value is determined by the broad market sentiment, the country’s economic health or action taken by the Swiss National Bank (SNB), among other factors. Between 2011 and 2015, the Swiss Franc was pegged to the Euro (EUR). The peg was abruptly removed, resulting in a more than 20% increase in the Franc’s value, causing a turmoil in markets. Even though the peg isn’t in force anymore, CHF fortunes tend to be highly correlated with the Euro ones due to the high dependency of the Swiss economy on the neighboring Eurozone.
The Swiss Franc (CHF) is considered a safe-haven asset, or a currency that investors tend to buy in times of market stress. This is due to the perceived status of Switzerland in the world: a stable economy, a strong export sector, big central bank reserves or a longstanding political stance towards neutrality in global conflicts make the country’s currency a good choice for investors fleeing from risks. Turbulent times are likely to strengthen CHF value against other currencies that are seen as more risky to invest in.
The Swiss National Bank (SNB) meets four times a year – once every quarter, less than other major central banks – to decide on monetary policy. The bank aims for an annual inflation rate of less than 2%. When inflation is above target or forecasted to be above target in the foreseeable future, the bank will attempt to tame price growth by raising its policy rate. Higher interest rates are generally positive for the Swiss Franc (CHF) as they lead to higher yields, making the country a more attractive place for investors. On the contrary, lower interest rates tend to weaken CHF.
Macroeconomic data releases in Switzerland are key to assessing the state of the economy and can impact the Swiss Franc’s (CHF) valuation. The Swiss economy is broadly stable, but any sudden change in economic growth, inflation, current account or the central bank’s currency reserves have the potential to trigger moves in CHF. Generally, high economic growth, low unemployment and high confidence are good for CHF. Conversely, if economic data points to weakening momentum, CHF is likely to depreciate.
As a small and open economy, Switzerland is heavily dependent on the health of the neighboring Eurozone economies. The broader European Union is Switzerland’s main economic partner and a key political ally, so macroeconomic and monetary policy stability in the Eurozone is essential for Switzerland and, thus, for the Swiss Franc (CHF). With such dependency, some models suggest that the correlation between the fortunes of the Euro (EUR) and the CHF is more than 90%, or close to perfect.
-
06:45
EUR/JPY climbs to one-week top, closer to mid-162.00s amid weaker JPY
- EUR/JPY scales higher for the fourth straight day amid the emergence of some JPY selling.
- The divergent BoJ-ECB policy expectations should keep a lid on the upside for the cross.
- Traders now look to ECB President Christine Lagarde's speech for short-term opportunities.
The EUR/JPY cross attracts follow-through buyers for the fourth straight day on Wednesday and looks to build on its recovery from the 159.70-159.65 area, or over a one-month low touched last week. The intraday positive move lifts spot prices to a one-week top, around the 162.35-162.40 area during the Asian session and is sponsored by the emergence of some selling around the Japanese Yen (JPY).
The global risk sentiment remains well supported by the Israel-Hamas ceasefire agreement and hopes that US President Donald Trump might relax curbs on Russia in exchange for a deal to end the Ukraine war. Adding to this, Trump's proposed trade tariffs lacked details, which further boosted investors' appetite for riskier assets. This, in turn, is seen undermining demand for the safe-haven JPY and acting as a tailwind for the EUR/JPY cross.
That said, the growing acceptance that the Bank of Japan (BoJ) will raise interest rates on Friday should limit any meaningful JPY depreciation. Furthermore, a modest US Dollar (USD) strength, along with Trump's threat to impose tariffs on the European Union and bets that the European Central Bank (EC) will lower borrowing costs further, seem to weigh on the shared currency and should cap any further gains for the EUR/JPY cross.
The aforementioned fundamental backdrop and the recent repeated failures near the 200-day Simple Moving Average (SMA) warrant some caution for bullish traders. Hence, it will be prudent to wait for strong follow-through buying before positioning for any further appreciating move. Traders now look to ECB President Christine Lagarde's speech for some impetus, though the focus will remain glued to the crucial BoJ policy meeting.
Japanese Yen PRICE Today
The table below shows the percentage change of Japanese Yen (JPY) against listed major currencies today. Japanese Yen was the strongest against the New Zealand Dollar.
USD EUR GBP JPY CAD AUD NZD CHF USD 0.08% 0.02% 0.25% 0.02% 0.13% 0.23% 0.12% EUR -0.08% -0.07% 0.16% -0.07% 0.05% 0.15% 0.04% GBP -0.02% 0.07% 0.23% -0.00% 0.12% 0.21% 0.09% JPY -0.25% -0.16% -0.23% -0.22% -0.12% -0.03% -0.15% CAD -0.02% 0.07% 0.00% 0.22% 0.12% 0.21% 0.08% AUD -0.13% -0.05% -0.12% 0.12% -0.12% 0.10% -0.03% NZD -0.23% -0.15% -0.21% 0.03% -0.21% -0.10% -0.13% CHF -0.12% -0.04% -0.09% 0.15% -0.08% 0.03% 0.13% The heat map shows percentage changes of major currencies against each other. The base currency is picked from the left column, while the quote currency is picked from the top row. For example, if you pick the Japanese Yen from the left column and move along the horizontal line to the US Dollar, the percentage change displayed in the box will represent JPY (base)/USD (quote).
-
06:11
USD/CNH rises above 7.2800 as Chinese Yuan weakens due to Trump’s tariff threats
- USD/CNH appreciates as the Trump administration considers imposing a 10% tariff on Chinese imports.
- Chinese Vice Premier Ding Xuexiang warned about the consequences of a trade war.
- The pair could encounter the initial barrier near the critical zone around nine-day EMA at the 7.3108 level.
USD/CNH, representing the offshore Chinese Yuan, extends its gains for the second successive day on Wednesday. The pair's upward momentum is driven by an announcement from former US President Donald Trump, stating that his administration is considering imposing a 10% tariff on Chinese imports starting February 1. According to Reuters, this move is linked to concerns over fentanyl shipments from China to Mexico and Canada.
While the proposed 10% tariff is significantly lower than the previously threatened 60% rate, it aligns with the pledge Trump made during his presidential campaign. This announcement follows a recent phone call between Trump and Chinese President Xi Jinping, during which they discussed trade, fentanyl, and other key issues.
Chinese Vice Premier Ding Xuexiang issued a warning on Tuesday about the repercussions of a trade war, emphasizing that "there are no winners" in such conflicts as China faces the possibility of tariffs under Donald Trump's newly elected government, according to CNBC.
USD/CNH rises toward 7.3100 barrier to re-enter the ascending channel
The USD/CNH pair trades near 7.2820 during Asian hours on Wednesday. A review of the daily chart shows the price moving upward toward the existing ascending channel pattern, signaling a potential recovery of bullish bias.
However, the 14-day Relative Strength Index (RSI), a key momentum indicator, remains below the 50 mark, indicating persistent bearish momentum. Any further improvement in the RSI could suggest the development of a bullish bias.
On the downside, the USD/CNH pair may target the psychological support level at 7.2000 level.
The USD/CNH pair might struggle to re-enter the ascending channel, encountering initial resistance near the critical zone at the channel's lower boundary and the nine-day Exponential Moving Average (EMA), positioned at the 7.3108 level.
USD/CNH: Daily Chart
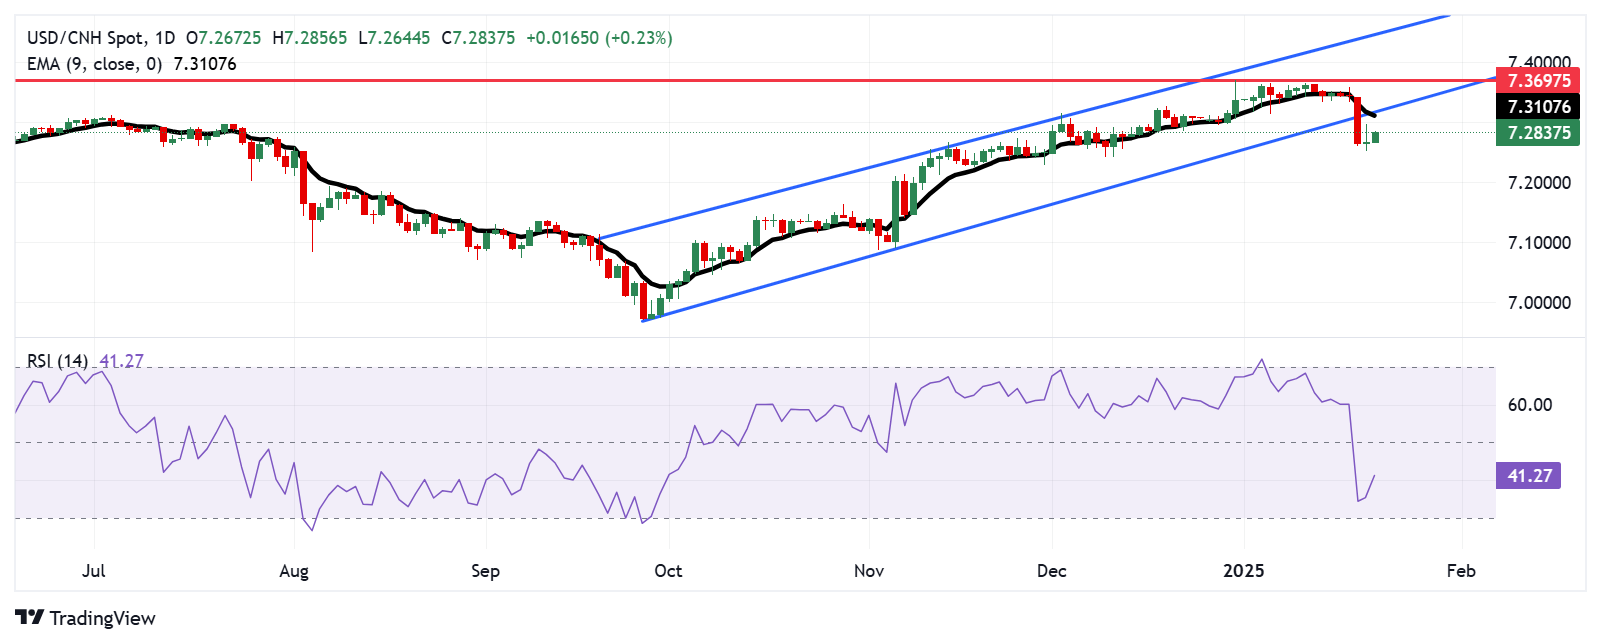
PBOC FAQs
The primary monetary policy objectives of the People's Bank of China (PBoC) are to safeguard price stability, including exchange rate stability, and promote economic growth. China’s central bank also aims to implement financial reforms, such as opening and developing the financial market.
The PBoC is owned by the state of the People's Republic of China (PRC), so it is not considered an autonomous institution. The Chinese Communist Party (CCP) Committee Secretary, nominated by the Chairman of the State Council, has a key influence on the PBoC’s management and direction, not the governor. However, Mr. Pan Gongsheng currently holds both of these posts.
Unlike the Western economies, the PBoC uses a broader set of monetary policy instruments to achieve its objectives. The primary tools include a seven-day Reverse Repo Rate (RRR), Medium-term Lending Facility (MLF), foreign exchange interventions and Reserve Requirement Ratio (RRR). However, The Loan Prime Rate (LPR) is China’s benchmark interest rate. Changes to the LPR directly influence the rates that need to be paid in the market for loans and mortgages and the interest paid on savings. By changing the LPR, China’s central bank can also influence the exchange rates of the Chinese Renminbi.
Yes, China has 19 private banks – a small fraction of the financial system. The largest private banks are digital lenders WeBank and MYbank, which are backed by tech giants Tencent and Ant Group, per The Straits Times. In 2014, China allowed domestic lenders fully capitalized by private funds to operate in the state-dominated financial sector.
-
05:51
EUR/USD trades with mild losses near 1.0400 amid Trump’s tariff threats
- EUR/USD trades in negative territory around 1.0415 in Wednesday’s early European session.
- Trump tariff threats drag the Euro lower against the USD.
- The ECB is anticipated to cut the interest rates at its January meeting.
The EUR/USD pair drifts lower to around 1.0415 during the Asian trading hours on Wednesday. The Euro (EUR) weakens against the US Dollar (USD) after US President Donald Trump vowed to hit the European Union (EU) with tariffs. Later on Wednesday, traders will keep an eye on the European Central Bank’s (ECB) President Lagarde speech for fresh impetus.
Late Tuesday, Trump said that he would impose 25% tariffs against Canada and Mexico, as well as duties on China and the European Union on February 1. Trump said that the EU and other nations have troubling trade deficits with the US. European Commission president Ursula von der Leyen emphasized the importance of preserving trading relations between the EU and the US. With a trading volume of €1.5 trillion and significant transatlantic investment, "a lot is at stake for both sides.". A stronger USD is another likely outcome of Trump's policies, which could weigh on the shared currency.
Additionally, the dovish expectation from the ECB might contribute to the EUR’s downside. Traders expected the ECB to deliver a rate cut on January 30 and see the benchmark down at 2% by the end of the year. ECB policymaker Boris Vujcic said on Monday that market expectations for ECB interest rate cuts are reasonable and risks around the inflation outlook are broadly balanced.Euro FAQs
The Euro is the currency for the 19 European Union countries that belong to the Eurozone. It is the second most heavily traded currency in the world behind the US Dollar. In 2022, it accounted for 31% of all foreign exchange transactions, with an average daily turnover of over $2.2 trillion a day. EUR/USD is the most heavily traded currency pair in the world, accounting for an estimated 30% off all transactions, followed by EUR/JPY (4%), EUR/GBP (3%) and EUR/AUD (2%).
The European Central Bank (ECB) in Frankfurt, Germany, is the reserve bank for the Eurozone. The ECB sets interest rates and manages monetary policy. The ECB’s primary mandate is to maintain price stability, which means either controlling inflation or stimulating growth. Its primary tool is the raising or lowering of interest rates. Relatively high interest rates – or the expectation of higher rates – will usually benefit the Euro and vice versa. The ECB Governing Council makes monetary policy decisions at meetings held eight times a year. Decisions are made by heads of the Eurozone national banks and six permanent members, including the President of the ECB, Christine Lagarde.
Eurozone inflation data, measured by the Harmonized Index of Consumer Prices (HICP), is an important econometric for the Euro. If inflation rises more than expected, especially if above the ECB’s 2% target, it obliges the ECB to raise interest rates to bring it back under control. Relatively high interest rates compared to its counterparts will usually benefit the Euro, as it makes the region more attractive as a place for global investors to park their money.
Data releases gauge the health of the economy and can impact on the Euro. Indicators such as GDP, Manufacturing and Services PMIs, employment, and consumer sentiment surveys can all influence the direction of the single currency. A strong economy is good for the Euro. Not only does it attract more foreign investment but it may encourage the ECB to put up interest rates, which will directly strengthen the Euro. Otherwise, if economic data is weak, the Euro is likely to fall. Economic data for the four largest economies in the euro area (Germany, France, Italy and Spain) are especially significant, as they account for 75% of the Eurozone’s economy.
Another significant data release for the Euro is the Trade Balance. This indicator measures the difference between what a country earns from its exports and what it spends on imports over a given period. If a country produces highly sought after exports then its currency will gain in value purely from the extra demand created from foreign buyers seeking to purchase these goods. Therefore, a positive net Trade Balance strengthens a currency and vice versa for a negative balance.
-
05:46
USD/CAD ticks higher amid modest USD strength, lacks follow-through beyond mid-1.4300s
- USD/CAD trades with positive bias for the second successive day amid reviving USD demand.
- The recent decline in Oil prices and bets for more BoC rate cuts further undermines the Loonie.
- The mixed fundamental cues warrant some caution before placing aggressive directional bets.
The USD/CAD pair attracts some dip-buyers following the previous day's sharp retracement slide from the highest level since March 2020, though it struggles to capitalize on the move beyond the mid-1.4300s.
The US Dollar (USD) gains some positive traction and moves away from a two-week low retested on Tuesday amid a modest recovery in the US Treasury bond yields. The Canadian Dollar (CAD), on the other hand, is pressured by expectations that the Bank of Canada (BoC) will make continued rate cuts in 2025, bolstered by a fall in Canada’s annual inflation rate to 1.8% in December. Apart from this, the recent decline in Crude Oil prices undermines the commodity-linked Loonie and lends some support to the USD/CAD pair.
Meanwhile, US President Donald Trump threatened to impose 25% tariffs on Canada and Mexico as soon as early February. Trump, however, did not outline any plans, which ease market concerns about the potential negative impact on the Canadian economy and helps limit losses for the CAD. Furthermore, bets that the Federal Reserve (Fed) will cut interest rates twice this year, along with a generally positive risk tone, keep a lid on the safe-haven buck and might hold back traders from placing bullish bets around the USD/CAD pair.
Moreover, the recent range-bound price action witnessed over the past month or so warrants some caution before positioning for a firm near-term direction. Moving ahead, there isn't any relevant market-moving economic data due for release on Wednesday, either from the US or Canada, leaving spot prices at the mercy of the USD. Apart from this, Oil price dynamics could provide some meaningful impetus to the USD/CAD pair ahead of the crucial BoC and Fed policy decisions next week.
US Dollar PRICE Today
The table below shows the percentage change of US Dollar (USD) against listed major currencies today. US Dollar was the strongest against the New Zealand Dollar.
USD EUR GBP JPY CAD AUD NZD CHF USD -0.01% -0.03% 0.17% -0.03% 0.05% 0.18% 0.05% EUR 0.00% -0.02% 0.18% -0.03% 0.05% 0.18% 0.05% GBP 0.03% 0.02% 0.19% -0.01% 0.07% 0.20% 0.06% JPY -0.17% -0.18% -0.19% -0.20% -0.12% -0.00% -0.13% CAD 0.03% 0.03% 0.01% 0.20% 0.08% 0.20% 0.07% AUD -0.05% -0.05% -0.07% 0.12% -0.08% 0.13% -0.00% NZD -0.18% -0.18% -0.20% 0.00% -0.20% -0.13% -0.14% CHF -0.05% -0.05% -0.06% 0.13% -0.07% 0.00% 0.14% The heat map shows percentage changes of major currencies against each other. The base currency is picked from the left column, while the quote currency is picked from the top row. For example, if you pick the US Dollar from the left column and move along the horizontal line to the Japanese Yen, the percentage change displayed in the box will represent USD (base)/JPY (quote).
-
05:36
India Gold price today: Gold rises, according to FXStreet data
Gold prices rose in India on Wednesday, according to data compiled by FXStreet.
The price for Gold stood at 7,654.64 Indian Rupees (INR) per gram, up compared with the INR 7,629.94 it cost on Tuesday.
The price for Gold increased to INR 89,283.52 per tola from INR 88,994.07 per tola a day earlier.
Unit measure Gold Price in INR 1 Gram 7,654.64 10 Grams 76,547.23 Tola 89,283.52 Troy Ounce 238,209.90 FXStreet calculates Gold prices in India by adapting international prices (USD/INR) to the local currency and measurement units. Prices are updated daily based on the market rates taken at the time of publication. Prices are just for reference and local rates could diverge slightly.
Gold FAQs
Gold has played a key role in human’s history as it has been widely used as a store of value and medium of exchange. Currently, apart from its shine and usage for jewelry, the precious metal is widely seen as a safe-haven asset, meaning that it is considered a good investment during turbulent times. Gold is also widely seen as a hedge against inflation and against depreciating currencies as it doesn’t rely on any specific issuer or government.
Central banks are the biggest Gold holders. In their aim to support their currencies in turbulent times, central banks tend to diversify their reserves and buy Gold to improve the perceived strength of the economy and the currency. High Gold reserves can be a source of trust for a country’s solvency. Central banks added 1,136 tonnes of Gold worth around $70 billion to their reserves in 2022, according to data from the World Gold Council. This is the highest yearly purchase since records began. Central banks from emerging economies such as China, India and Turkey are quickly increasing their Gold reserves.
Gold has an inverse correlation with the US Dollar and US Treasuries, which are both major reserve and safe-haven assets. When the Dollar depreciates, Gold tends to rise, enabling investors and central banks to diversify their assets in turbulent times. Gold is also inversely correlated with risk assets. A rally in the stock market tends to weaken Gold price, while sell-offs in riskier markets tend to favor the precious metal.
The price can move due to a wide range of factors. Geopolitical instability or fears of a deep recession can quickly make Gold price escalate due to its safe-haven status. As a yield-less asset, Gold tends to rise with lower interest rates, while higher cost of money usually weighs down on the yellow metal. Still, most moves depend on how the US Dollar (USD) behaves as the asset is priced in dollars (XAU/USD). A strong Dollar tends to keep the price of Gold controlled, whereas a weaker Dollar is likely to push Gold prices up.
(An automation tool was used in creating this post.)
-
05:03
Gold price advances to $2,750 area, highest since early November
- Gold price scales higher for the third straight day amid the global flight to safety.
- Bets for more rate cuts by the Fed also benefit the non-yielding yellow metal.
- A modest USD bounce could act as a headwind amid the risk-on environment.
Gold price (XAU/USD) builds on the previous day's strong move up and attracts follow-through buying for the third successive day on Wednesday. The momentum lifts the commodity to its highest level since November 1, around the $2,750 area, during the Asian session and is sponsored by safe-haven flows fueled by the uncertainty about US President Donald Trump's trade policies. Apart from this, the recent decline in the US Treasury bond yields, fueled by bets that the Federal Reserve (Fed) will cut rates twice this year, offers additional support to the non-yielding yellow metal.
That said, a generally positive tone around the equity markets, along with a modest US Dollar (USD) recovery from a two-week low, might keep a lid on the Gold price. Furthermore, the growing acceptance that the Fed will pause its rate-cutting cycle later this month and the prospects for a rate hike by the Bank of Japan (BoJ) on Friday might cap the precious metal. Nevertheless, the fundamental backdrop favors bulls, which, along with the overnight breakout through the $2,720 supply zone, suggests that the path of least resistance for the XAU/USD remains to the upside.
Gold price continues to attract haven flows amid Trump’s tariff threats
- Hours after taking the oath, US President Donald Trump said that he intends to impose 25% tariffs on Canada and Mexico, and the target date for tariffs would be as soon as early February.
- Trump's tariff remarks sparked concerns about a fresh wave of global trade war, boosting demand for safe-haven assets and lifting the Gold price to its highest level since early November.
- Signs of abating inflation in the US revived bets that the Federal Reserve may not exclude the possibility of rate cuts by the end of this year, which dragged the US Treasury bond yields lower.
- This, along with the Israel-Hamas ceasefire agreement, and hopes that Trump might relax curbs on Russia in exchange for a deal to end the Ukraine war, remain supportive of the risk-on mood.
- The US Dollar gains some positive traction during the Asian session on Wednesday and moves away from a two-week trough that was retested on Tuesday, which might cap gains for the XAU/USD.
- Investors now look forward to the highly-anticipated Bank of Japan decision on Friday, which could infuse volatility in the financial markets and influence the safe-haven precious metal.
- Apart from this, the flash PMI prints would offer a fresh insight into the global economic health and provide some meaningful impetus to the commodity during the latter half of the week.
Gold price could aim to challenge the all-time peak, around $2,790 area
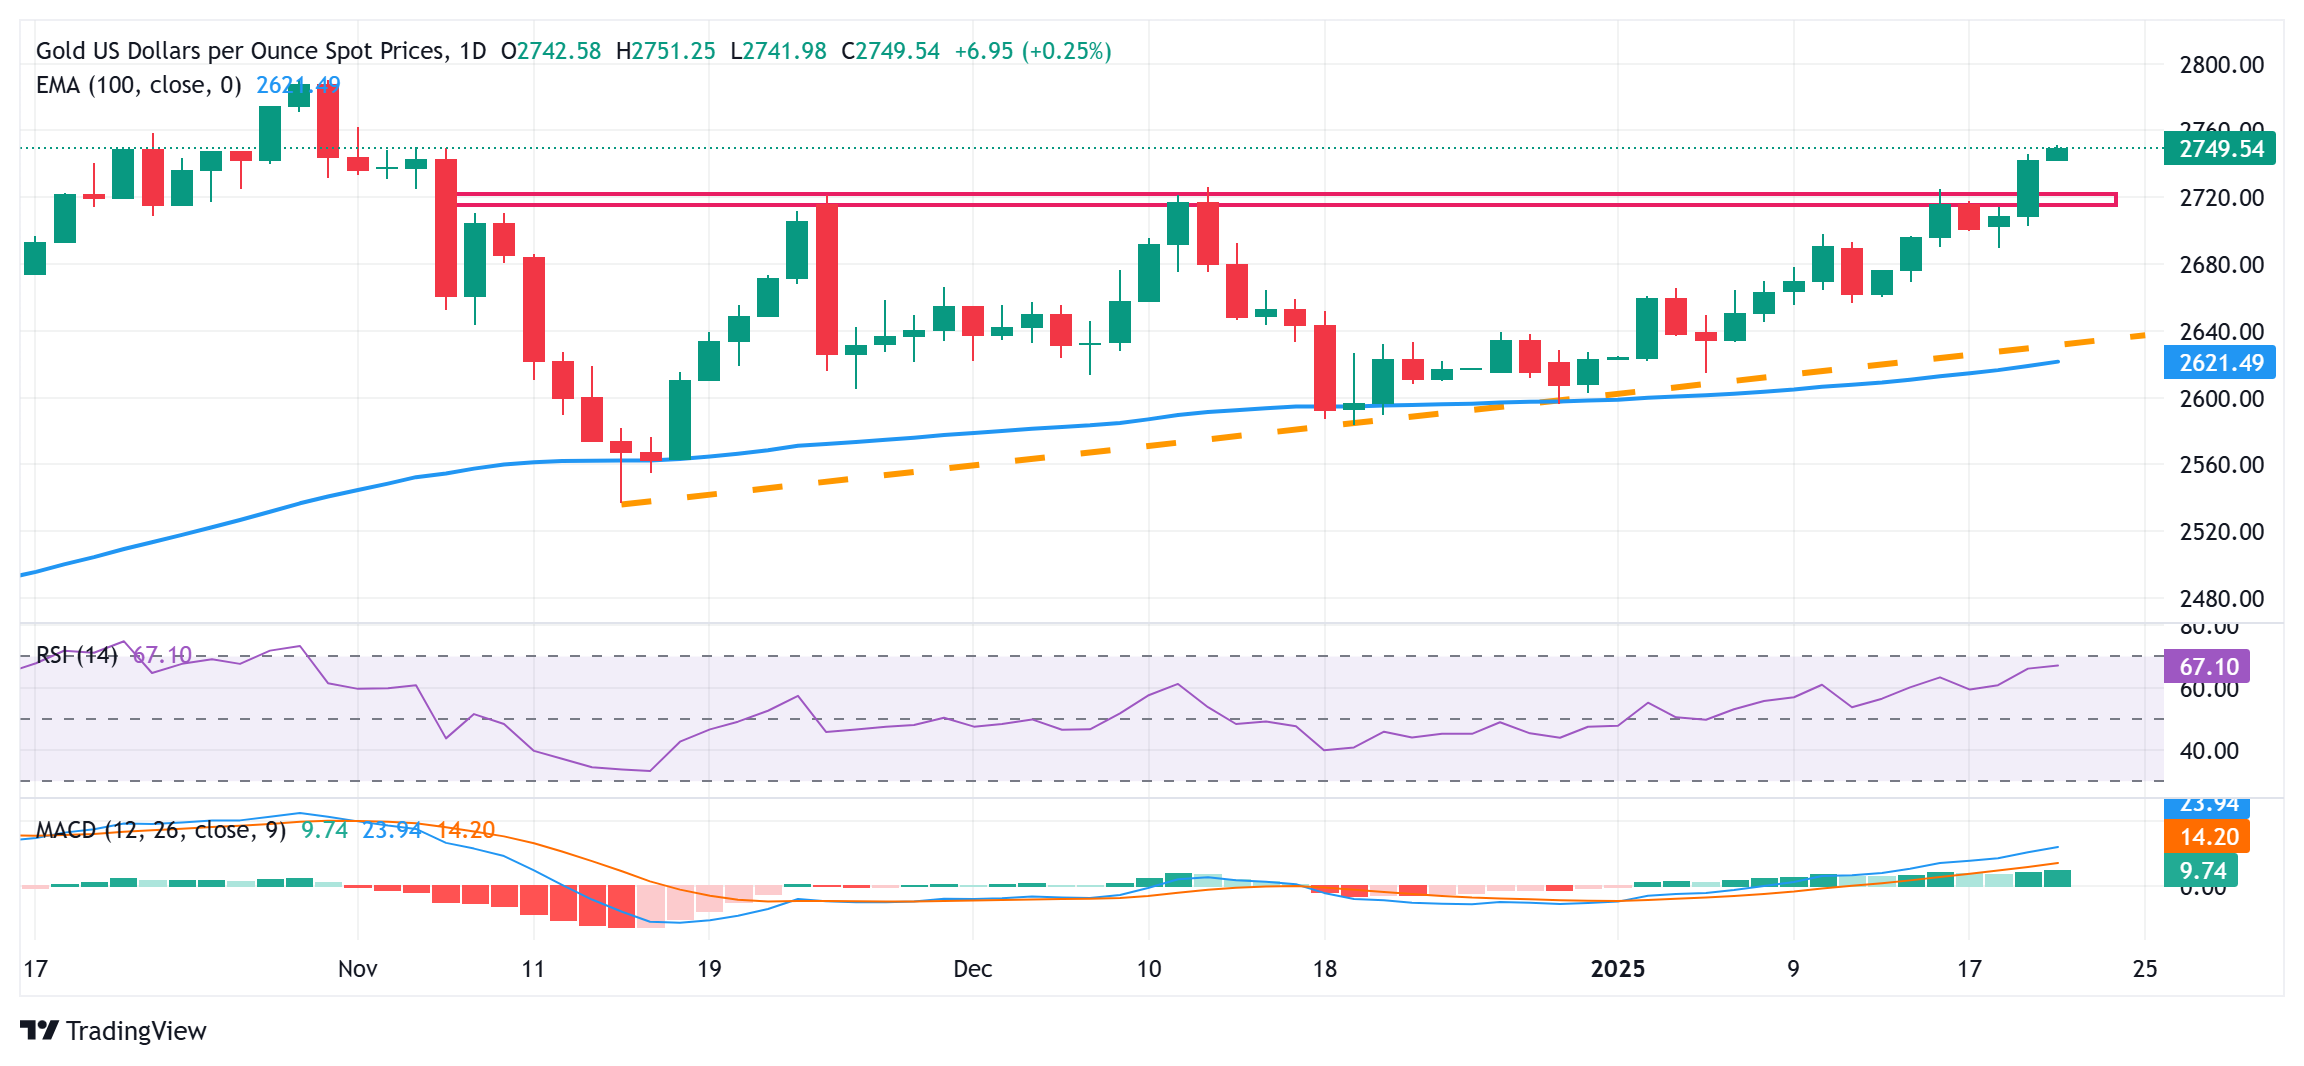
From a technical perspective, the overnight breakout through the $2,720 supply zone was seen as a fresh trigger for bullish traders. Given that oscillators on the daily chart are holding comfortably in positive territory and are still away from being in the overbought zone, a subsequent strength beyond the $2,748-2,750 hurdle should pave the way for additional gains. The Gold price might then aim towards challenging the all-time peak, around the $2,790 area touched in October 2024.
On the flip side, any corrective pullback might now be seen as a buying opportunity and remain limited near the $2,725-2,720 region. The next relevant support is pegged near the $2,700-2,690 area, which if broken decisively might prompt aggressive technical selling and drag the Gold price to the $2,660 zone en route to the $2,625 confluence. The latter comprises the 100-day Exponential Moving Average (EMA) and an ascending trend-line extending from the November swing low, which, in turn, should act as a key pivotal point and help determine the next leg of a directional move for the XAU/USD.
Gold FAQs
Gold has played a key role in human’s history as it has been widely used as a store of value and medium of exchange. Currently, apart from its shine and usage for jewelry, the precious metal is widely seen as a safe-haven asset, meaning that it is considered a good investment during turbulent times. Gold is also widely seen as a hedge against inflation and against depreciating currencies as it doesn’t rely on any specific issuer or government.
Central banks are the biggest Gold holders. In their aim to support their currencies in turbulent times, central banks tend to diversify their reserves and buy Gold to improve the perceived strength of the economy and the currency. High Gold reserves can be a source of trust for a country’s solvency. Central banks added 1,136 tonnes of Gold worth around $70 billion to their reserves in 2022, according to data from the World Gold Council. This is the highest yearly purchase since records began. Central banks from emerging economies such as China, India and Turkey are quickly increasing their Gold reserves.
Gold has an inverse correlation with the US Dollar and US Treasuries, which are both major reserve and safe-haven assets. When the Dollar depreciates, Gold tends to rise, enabling investors and central banks to diversify their assets in turbulent times. Gold is also inversely correlated with risk assets. A rally in the stock market tends to weaken Gold price, while sell-offs in riskier markets tend to favor the precious metal.
The price can move due to a wide range of factors. Geopolitical instability or fears of a deep recession can quickly make Gold price escalate due to its safe-haven status. As a yield-less asset, Gold tends to rise with lower interest rates, while higher cost of money usually weighs down on the yellow metal. Still, most moves depend on how the US Dollar (USD) behaves as the asset is priced in dollars (XAU/USD). A strong Dollar tends to keep the price of Gold controlled, whereas a weaker Dollar is likely to push Gold prices up.
-
04:48
GBP/USD struggles near 1.2350 as Trump’s tariff hikes proposal remains afloat
- GBP/USD inched lower as Trump confirmed that the universal tariff hikes proposal remains afloat.
- US President Donald Trump issued a memorandum instructing federal agencies to investigate and address ongoing trade deficits.
- The latest UK labor market report provides the BoE with a "green light to cut in February."
GBP/USD pauses its two-day rally, trading around 1.2330 during the Asian session on Wednesday. The pair remains subdued as the US Dollar (USD) holds onto modest gains. US President Donald Trump confirmed that the proposal for universal tariff hikes is still under consideration, although he stated, "We are not ready for that yet." Additionally, Trump issued a memorandum directing federal agencies to investigate and address the ongoing trade deficits.
The US Dollar Index (DXY), which tracks the performance of the US Dollar against six major currencies, holds ground around 108.00 at the time of writing. However, the Greenback faced headwinds as Trump opted not to impose new tariffs on his first day in office.
However, the USD could recover its recent losses in the near term as the US Federal Reserve (Fed) is expected to maintain its benchmark overnight rate in the 4.25%-4.50% range during its January meeting. Investors anticipate that Trump's policies could increase inflationary pressures, which might limit the Fed to only one more rate cut.
The Pound Sterling (GBP) came under pressure after the release of labor market data from the United Kingdom (UK) on Tuesday. The ILO Unemployment Rate unexpectedly rose to 4.4%, along with the sharpest drop in payroll numbers since November 2020, signaling a potential weakening in the labor market.
Following the labor market report, analysts at Nomura noted that this data provides the BoE with a "green light to cut in February." Markets are also betting on one or two more reductions after February.
Last week's data pointed to an unforeseen slowdown in inflation and weaker-than-expected economic growth. As a result, the Bank of England (BoE) is widely anticipated to lower the key interest rate by 25 basis points to 4.5% during its policy meeting on February 6.
Pound Sterling FAQs
The Pound Sterling (GBP) is the oldest currency in the world (886 AD) and the official currency of the United Kingdom. It is the fourth most traded unit for foreign exchange (FX) in the world, accounting for 12% of all transactions, averaging $630 billion a day, according to 2022 data. Its key trading pairs are GBP/USD, also known as ‘Cable’, which accounts for 11% of FX, GBP/JPY, or the ‘Dragon’ as it is known by traders (3%), and EUR/GBP (2%). The Pound Sterling is issued by the Bank of England (BoE).
The single most important factor influencing the value of the Pound Sterling is monetary policy decided by the Bank of England. The BoE bases its decisions on whether it has achieved its primary goal of “price stability” – a steady inflation rate of around 2%. Its primary tool for achieving this is the adjustment of interest rates. When inflation is too high, the BoE will try to rein it in by raising interest rates, making it more expensive for people and businesses to access credit. This is generally positive for GBP, as higher interest rates make the UK a more attractive place for global investors to park their money. When inflation falls too low it is a sign economic growth is slowing. In this scenario, the BoE will consider lowering interest rates to cheapen credit so businesses will borrow more to invest in growth-generating projects.
Data releases gauge the health of the economy and can impact the value of the Pound Sterling. Indicators such as GDP, Manufacturing and Services PMIs, and employment can all influence the direction of the GBP. A strong economy is good for Sterling. Not only does it attract more foreign investment but it may encourage the BoE to put up interest rates, which will directly strengthen GBP. Otherwise, if economic data is weak, the Pound Sterling is likely to fall.
Another significant data release for the Pound Sterling is the Trade Balance. This indicator measures the difference between what a country earns from its exports and what it spends on imports over a given period. If a country produces highly sought-after exports, its currency will benefit purely from the extra demand created from foreign buyers seeking to purchase these goods. Therefore, a positive net Trade Balance strengthens a currency and vice versa for a negative balance.
-
03:57
Silver Price Forecast: XAG/USD maintains position above $30.50 near nine-day EMA
- Silver price could test its initial resistance at the ascending channel’s upper boundary at $31.80.
- The short-term momentum is robust, as the XAG/USD pair is trading above both the nine- and 14-day EMAs.
- The immediate support seems to be around the nine-day EMA at $30.47 and the 14-day EMA at $30.32.
Silver price (XAG/USD) extends its gains for the third successive session, trading around $30.80 per troy ounce during Asian hours on Wednesday. A daily chart analysis indicates a prevailing bullish bias for the precious metal, as its price continues to rise within an ascending channel pattern.
Short-term momentum is strong, with the XAG/USD pair trading above both the nine-day and 14-day Exponential Moving Averages (EMAs). Additionally, the 14-day Relative Strength Index (RSI) is positioned above the 50 level, reinforcing the active bullish sentiment.
On the upside, the Silver price could find its initial resistance around the upper boundary of the ascending channel at $31.80. A breakout above this level could boost market sentiment and drive the XAG/USD pair toward its two-month high of $32.28, last achieved on December 9.
Immediate support is located at a nine-day EMA of $30.47, followed closely by a 14-day EMA of $30.32. Further support appears around the ascending channel’s lower boundary at $30.00. A break below this channel would cause the emergence of the bearish bias and put pressure on the XAG/USD pair to navigate the region around its four-month low of $28.74, recorded on December 19.
XAG/USD: Daily Chart
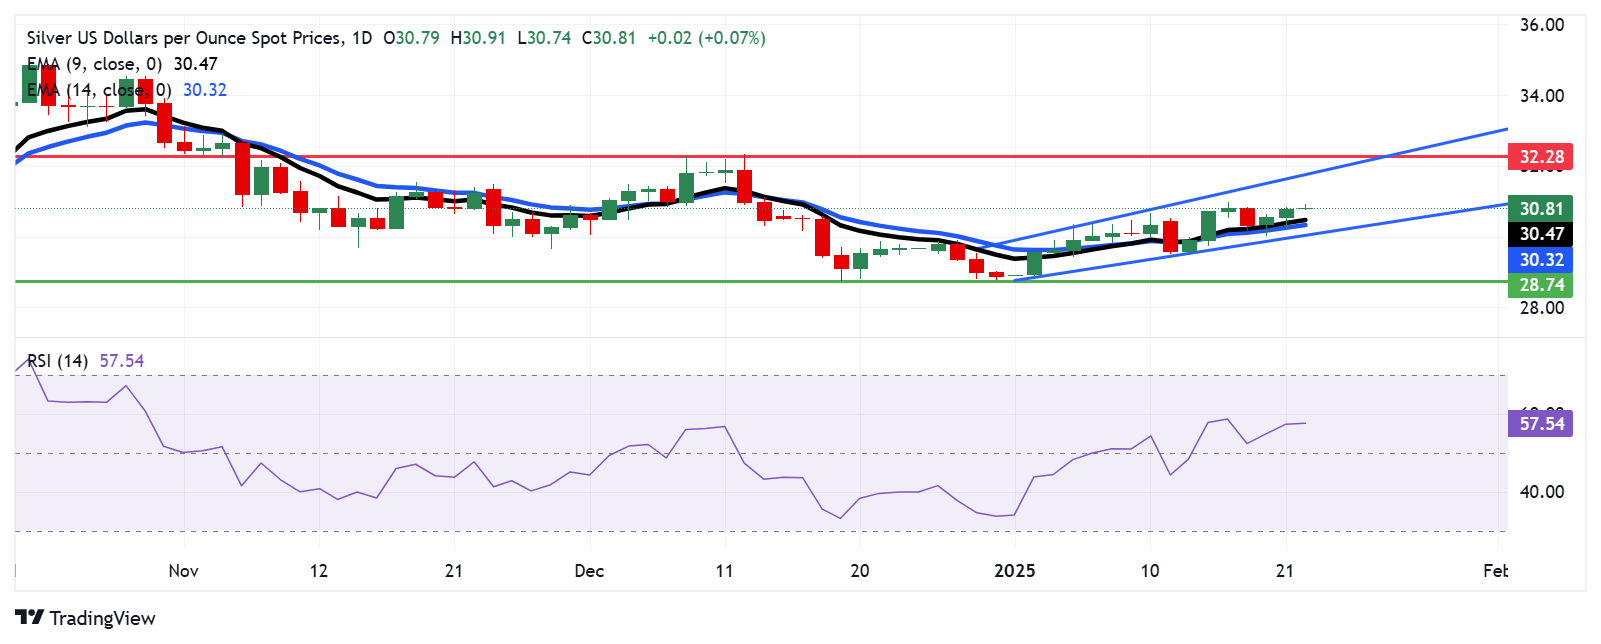
Silver FAQs
Silver is a precious metal highly traded among investors. It has been historically used as a store of value and a medium of exchange. Although less popular than Gold, traders may turn to Silver to diversify their investment portfolio, for its intrinsic value or as a potential hedge during high-inflation periods. Investors can buy physical Silver, in coins or in bars, or trade it through vehicles such as Exchange Traded Funds, which track its price on international markets.
Silver prices can move due to a wide range of factors. Geopolitical instability or fears of a deep recession can make Silver price escalate due to its safe-haven status, although to a lesser extent than Gold's. As a yieldless asset, Silver tends to rise with lower interest rates. Its moves also depend on how the US Dollar (USD) behaves as the asset is priced in dollars (XAG/USD). A strong Dollar tends to keep the price of Silver at bay, whereas a weaker Dollar is likely to propel prices up. Other factors such as investment demand, mining supply – Silver is much more abundant than Gold – and recycling rates can also affect prices.
Silver is widely used in industry, particularly in sectors such as electronics or solar energy, as it has one of the highest electric conductivity of all metals – more than Copper and Gold. A surge in demand can increase prices, while a decline tends to lower them. Dynamics in the US, Chinese and Indian economies can also contribute to price swings: for the US and particularly China, their big industrial sectors use Silver in various processes; in India, consumers’ demand for the precious metal for jewellery also plays a key role in setting prices.
Silver prices tend to follow Gold's moves. When Gold prices rise, Silver typically follows suit, as their status as safe-haven assets is similar. The Gold/Silver ratio, which shows the number of ounces of Silver needed to equal the value of one ounce of Gold, may help to determine the relative valuation between both metals. Some investors may consider a high ratio as an indicator that Silver is undervalued, or Gold is overvalued. On the contrary, a low ratio might suggest that Gold is undervalued relative to Silver.
-
03:52
USD/INR holds steady as Trump threatens China with tariffs
- The Indian Rupee trades flat in Wednesday’s Asian session.
- Renewed USD demand and Trump’s tariff announcements might weigh on the INR.
- The routine RBI intervention and lower crude oil prices might cap the downside for local currency.
The Indian Rupee (INR) flat lines on Wednesday. The persistent US Dollar (USD) buying from foreign portfolio investors and local oil companies could weigh on the lNR. Additionally, US President Donald Trump’s plan to impose tariffs on China might exert some selling pressure on Asian peers, including the Indian Rupee.
Nonetheless, the downside for the INR might be limited as the Reserve Bank of India (RBI) could intervene in the foreign exchange market via USD sales to prevent the local currency from significant depreciation. A decline in crude oil prices might also help limit the INR’s losses as India is the world's third-largest oil consumer. Investors will closely monitor the preliminary reading of HSBC India’s Purchasing Managers Index (PMI) and US S&P PMI data for January, which will be published later on Friday.Indian Rupee looks fragile amid multiple headwinds
- India's GDP is estimated to grow at 6.5-6.8% in the current fiscal year, according to Deloitte India on Tuesday.
- Moody's lowered India's economic growth forecast to 7.0% for the fiscal year ending March 2025, down from 8.2% recorded in the previous fiscal year.
- Overseas investors have sold a net total of about $6.5 billion worth of local equities and bonds in January, the largest monthly outflow since October 2023.
- Trump stated on Tuesday that his administration is discussing imposing a 10% tariff on goods imported from China on February 1 because fentanyl is being sent from China to Mexico and Canada, per Reuters.
USD/INR price action remains constructive in the longer term
The Indian Rupee trades on a flat note on the day. The path of least resistance is to the upside as the USD/INR pair has formed higher highs and higher lows while holding above the key 100-day Exponential Moving Average (EMA) on the daily chart. Additionally, the 14-day Relative Strength Index (RSI) is located above the midline near 67.00, indicating bullish momentum in the near term.
The all-time high of 86.69 appears to be a tough nut to crack for bulls. A sustained break above the mentioned level could open the door for a rally toward the 87.00 psychological level.
On the flip side, a move back below 86.18, the low of January 20, could clear the way for a dip to the next support level at 85.85, the low of January 10. The next downside target to watch is 85.65, the low of January 7.Indian Rupee FAQs
The Indian Rupee (INR) is one of the most sensitive currencies to external factors. The price of Crude Oil (the country is highly dependent on imported Oil), the value of the US Dollar – most trade is conducted in USD – and the level of foreign investment, are all influential. Direct intervention by the Reserve Bank of India (RBI) in FX markets to keep the exchange rate stable, as well as the level of interest rates set by the RBI, are further major influencing factors on the Rupee.
The Reserve Bank of India (RBI) actively intervenes in forex markets to maintain a stable exchange rate, to help facilitate trade. In addition, the RBI tries to maintain the inflation rate at its 4% target by adjusting interest rates. Higher interest rates usually strengthen the Rupee. This is due to the role of the ‘carry trade’ in which investors borrow in countries with lower interest rates so as to place their money in countries’ offering relatively higher interest rates and profit from the difference.
Macroeconomic factors that influence the value of the Rupee include inflation, interest rates, the economic growth rate (GDP), the balance of trade, and inflows from foreign investment. A higher growth rate can lead to more overseas investment, pushing up demand for the Rupee. A less negative balance of trade will eventually lead to a stronger Rupee. Higher interest rates, especially real rates (interest rates less inflation) are also positive for the Rupee. A risk-on environment can lead to greater inflows of Foreign Direct and Indirect Investment (FDI and FII), which also benefit the Rupee.
Higher inflation, particularly, if it is comparatively higher than India’s peers, is generally negative for the currency as it reflects devaluation through oversupply. Inflation also increases the cost of exports, leading to more Rupees being sold to purchase foreign imports, which is Rupee-negative. At the same time, higher inflation usually leads to the Reserve Bank of India (RBI) raising interest rates and this can be positive for the Rupee, due to increased demand from international investors. The opposite effect is true of lower inflation.
-
03:30
Commodities. Daily history for Tuesday, January 21, 2025
Raw materials Closed Change, % Silver 30.825 0.99 Gold 2744.85 1.36 Palladium 959.07 0.81 -
03:29
Japanese Yen drifts lower against USD; downside seems limited amid BoJ rate hike bets
- The Japanese Yen moved away from a one-month top against the USD touched on Tuesday.
- The divergent BoJ-Fed policy expectations should help limit any meaningful JPY downfall.
- Traders might also opt to move to the sidelines ahead of the BoJ meeting starting Thursday.
The Japanese Yen (JPY) edges lower against its American counterpart during the Asian session on Wednesday, though it remains close to over a one-month peak touched the previous day. The JPY continues to draw support from firming expectations that the Bank of Japan (BoJ) will hike interest rates on Friday. This marks a big divergence in comparison to bets that the Federal Reserve (Fed) will cut rates twice this year, which keeps the US Dollar (USD) depressed near a two-week low and contributes to capping the USD/JPY pair.
Furthermore, uncertainties surrounding US President Donald Trump's potential tariffs could benefit the safe-haven JPY. Traders, however, seem reluctant and might opt to move to the sidelines ahead of the highly-anticipated two-day BoJ monetary policy meeting starting Thursday. The outcome will play a key role in influencing the near-term JPY price dynamics and provide some meaningful impetus to the USD/JPY pair. Nevertheless, the aforementioned fundamental backdrop seems tilted firmly in favor of the JPY bulls.
Japanese Yen bulls have the upper hand amid bets for an imminent BoJ rate hike on Friday
- Against the backdrop of hawkish remarks from Bank of Japan officials, optimism that rising wages will help Japan stay on track to meet the 2% inflation target sustainably supports prospects for an imminent rate hike on Friday.
- The head of Japan's largest trade union Rengo – Tomoko Yoshino – agrees with BoJ that there is wage rise momentum. The BoJ has repeatedly said that sustained, broad-based wage hikes are a prerequisite to raising short-term rates.
- According to government sources, Japanese Prime Minister Shigeru Ishiba will emphasize strong wage growth surpassing inflation as a key element of his economic revival strategy in an upcoming policy speech to parliament.
- The markets are now pricing in over a 90% chance that the BoJ will raise interest rates at the end of a two-day policy meeting on January 23-24, from 0.25% to 0.5%, which would be the highest since the 2008 global financial crisis.
- US President Donald Trump told reporters on Monday that he was thinking about implementing 25% tariffs on imports from Canada and Mexico as soon as early February, and also raised the possibility of a universal tariff.
- Higher tariffs hinder economic growth and are often thought to lift inflation. Trump, however, did not outline any specific plans for tariffs. Moreover, officials said that any new taxes would be imposed in a measured way.
- Moreover, the US Producer Price Index (PPI) and the Consumer Price Index (CPI) recently pointed to signs of abating inflation, strengthening expectations for two more interest rate cuts by the Federal Reserve later this year.
- A modest bounce in the US Treasury bond yields assists the US Dollar to move away from a two-week low and the USD/JPY pair to stage recovery from the 154.75 region, or over a one-month trough touched on Tuesday.
USD/JPY needs to find acceptance below the 155.00 mark for bears to seize near-term control
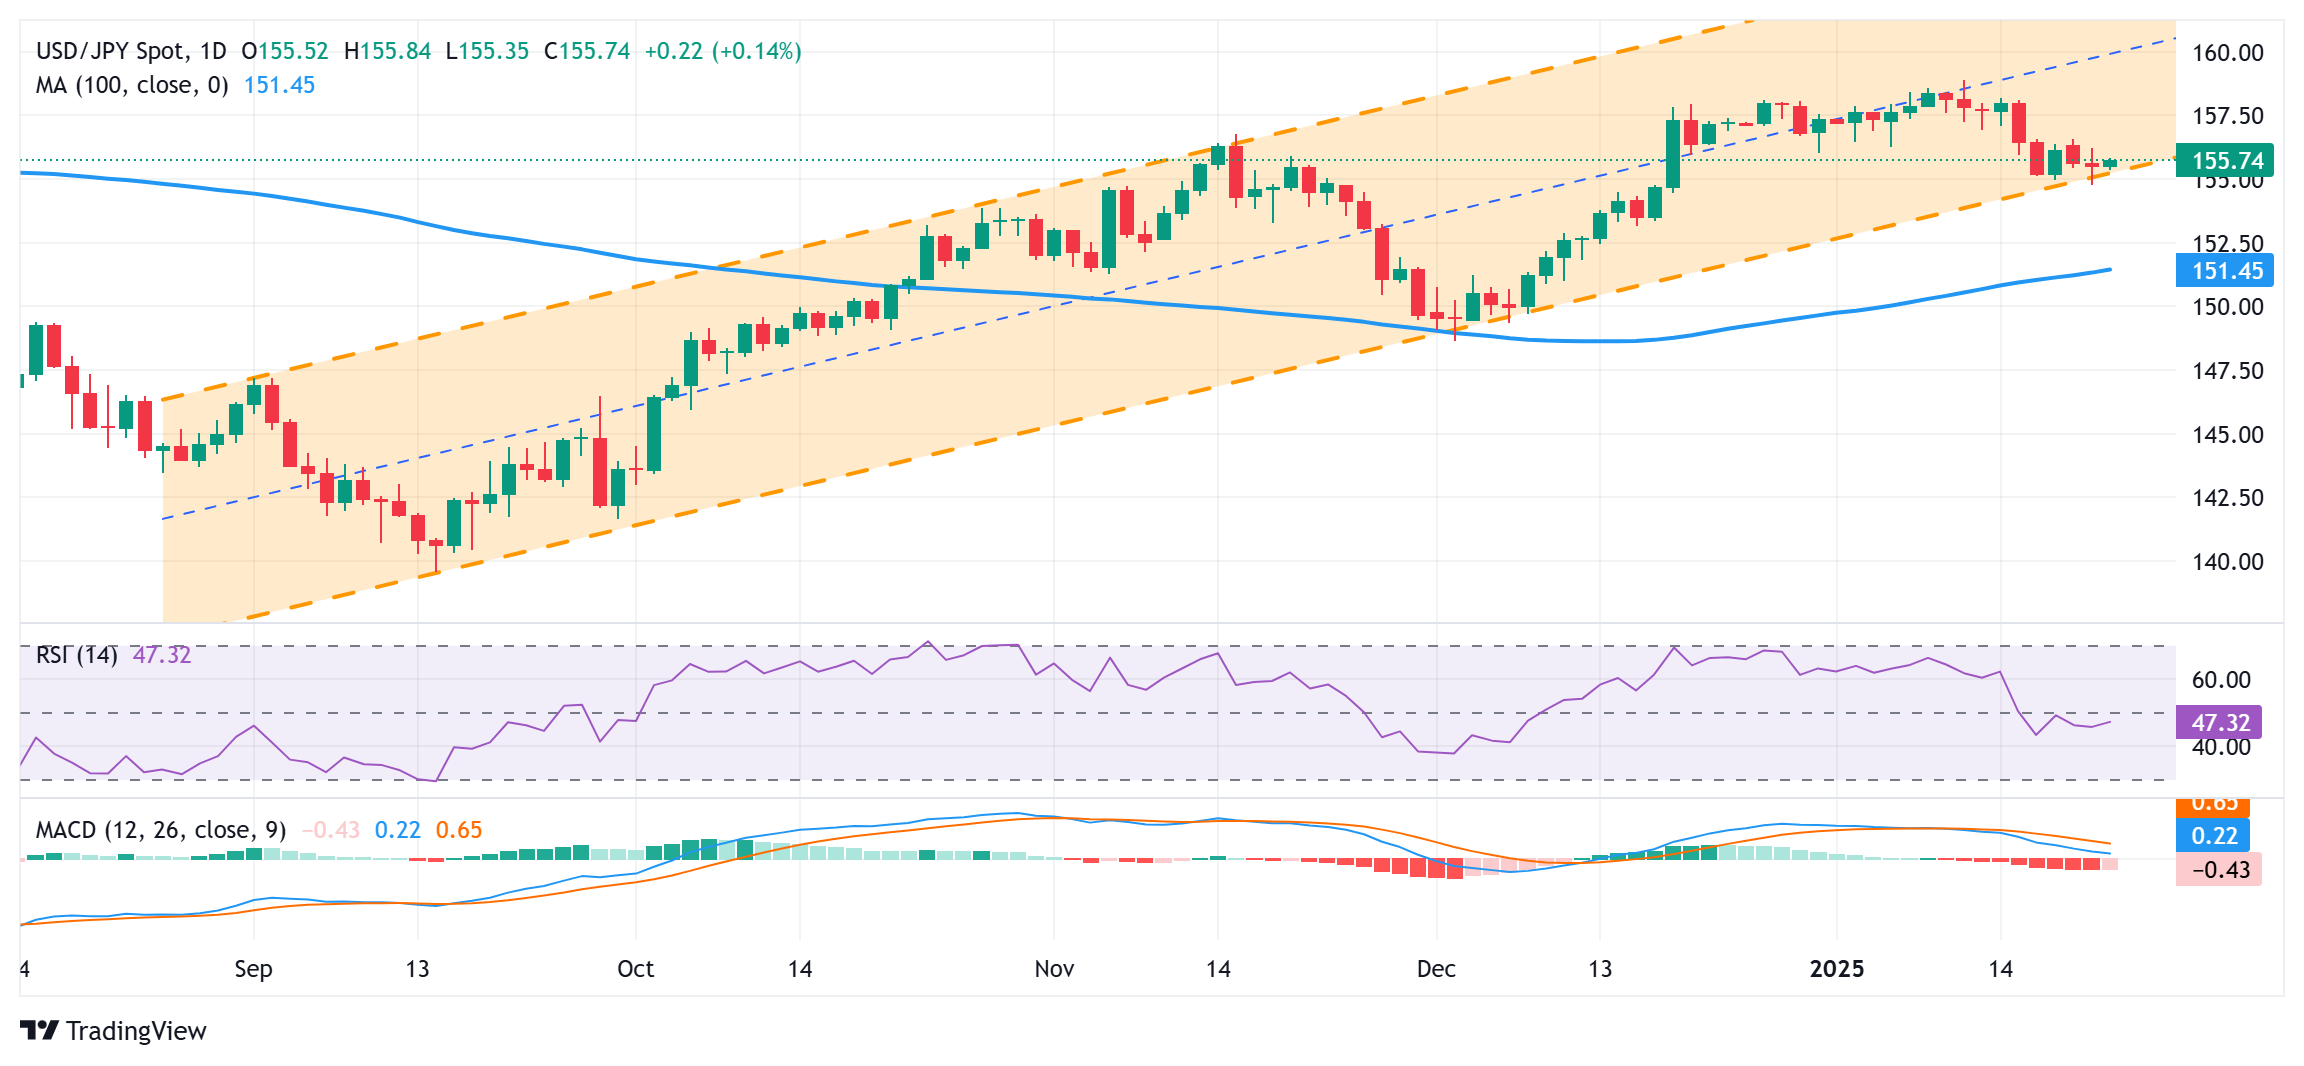
From a technical perspective, the USD/JPY pair has been showing resilience below the 155.00 psychological mark and the lower boundary of a multi-month-old ascending channel. The subsequent move up, along with the fact that oscillators on the daily chart are yet to gain any meaningful negative traction, warrants some caution for bearish traders. Hence, it will be prudent to wait for a sustained break and acceptance below the trend-channel support before positioning for any further depreciating move. Spot prices might then accelerate the fall towards the 154.50-154.45 intermediate support en route to the 154.00 round figure, mid-153.00s and the 153.00 mark.
On the flip side, the 156.00 round figure, closely followed by the overnight swing high, around the 156.25 region, now seems to act as an immediate hurdle ahead of the weekly top, around the 156.55-156.60 area touched on Monday. Some follow-through buying has the potential to lift the USD/JPY pair towards the 157.00 mark. The momentum could extend further towards the 157.25-157.30 area en route to the 157.60 region and the 158.00 round figure. A sustained strength beyond the latter could set the stage for a move towards retesting the multi-month peak, around the 159.00 neighborhood touched on January 10.
Bank of Japan FAQs
The Bank of Japan (BoJ) is the Japanese central bank, which sets monetary policy in the country. Its mandate is to issue banknotes and carry out currency and monetary control to ensure price stability, which means an inflation target of around 2%.
The Bank of Japan embarked in an ultra-loose monetary policy in 2013 in order to stimulate the economy and fuel inflation amid a low-inflationary environment. The bank’s policy is based on Quantitative and Qualitative Easing (QQE), or printing notes to buy assets such as government or corporate bonds to provide liquidity. In 2016, the bank doubled down on its strategy and further loosened policy by first introducing negative interest rates and then directly controlling the yield of its 10-year government bonds. In March 2024, the BoJ lifted interest rates, effectively retreating from the ultra-loose monetary policy stance.
The Bank’s massive stimulus caused the Yen to depreciate against its main currency peers. This process exacerbated in 2022 and 2023 due to an increasing policy divergence between the Bank of Japan and other main central banks, which opted to increase interest rates sharply to fight decades-high levels of inflation. The BoJ’s policy led to a widening differential with other currencies, dragging down the value of the Yen. This trend partly reversed in 2024, when the BoJ decided to abandon its ultra-loose policy stance.
A weaker Yen and the spike in global energy prices led to an increase in Japanese inflation, which exceeded the BoJ’s 2% target. The prospect of rising salaries in the country – a key element fuelling inflation – also contributed to the move.
-
03:13
Australian Dollar edges lower as Trump administration considers tariff on Chinese imports
- The Australian Dollar faces pressure after President Trump announced that his administration is considering a 10% tariff on Chinese imports.
- Chinese Vice Premier Ding Xuexiang warned about the consequences of a trade war.
- Trump issued a memorandum directing federal agencies to investigate and address the ongoing trade deficits.
The Australian Dollar (AUD) remains subdued against the US Dollar (USD) on Wednesday. The AUD/USD pair faces challenges as US President Donald Trump announced that his administration is considering imposing a 10% tariff on Chinese imports starting February 1. The move is reportedly linked to concerns over fentanyl shipments from China to Mexico and Canada, according to Reuters.
Trump mentioned earlier, "If we make a TikTok deal and China doesn’t approve it, we could maybe put tariffs on China." This comment follows his signing of an executive order delaying the enforcement of the TikTok ban by 75 days. Given the close trading relationship between China and Australia, any developments affecting China's economy could significantly influence Australian markets.
Chinese Vice Premier Ding Xuexiang issued a warning on Tuesday about the repercussions of a trade war, emphasizing that "there are no winners" in such conflicts as China faces the possibility of tariffs under Donald Trump's newly elected government, according to CNBC.
The S&P/ASX 200 Index climbed to around 8,450 on Wednesday, marking its highest level in nearly seven weeks. The rally was supported by a positive lead from Wall Street, driven by US President Donald Trump’s decision to delay implementing tariff threats, which provided relief to global markets.
Australian Dollar could gain ground as Trump opts not to impose new tariffs
- The US Dollar Index (DXY), which tracks the performance of the US Dollar against six major currencies, holds ground around 108.00 at the time of writing. However, the Greenback faced headwinds as President Donald Trump opted not to impose new tariffs on his first day in office. However, Trump issued a memorandum instructing federal agencies to investigate and address ongoing trade deficits. Trump also warned Mexico, Canada, China, and the EU about potential tariffs over a range of trade-related concerns.
- The US Federal Reserve (Fed) is expected to keep its benchmark overnight rate steady in the 4.25%-4.50% range at its January meeting. However, investors believe Trump’s policies could drive inflationary pressures, potentially limiting the Fed to just one more rate cut. This could help cushion the USD against significant losses in the near term.
- US Retail Sales rose by 0.4% MoM in December, reaching $729.2 billion. This reading was weaker than the market expectations of a 0.6% rise and lower than the previous reading of a 0.8% increase (revised from 0.7%).
- The US Consumer Price Index increased by 2.9% year-over-year in December, up from 2.7% in November, aligning with market expectations. Monthly, CPI rose 0.4%, following a 0.3% increase in the previous month. US Core CPI, which excludes volatile food and energy prices, rose 3.2% annually in December, slightly below November's figure and analysts' forecasts of 3.3%.
- Australia's Westpac Leading Index held steady in December 2024, showing no change from the previous month, which had recorded a 0.1% increase. Meanwhile, the six-month annualized growth rate—a measure of the expected pace of economic activity compared to the trend over the next three to nine months—dipped to 0.25% in December, down from 0.33% in November, but remained positive for the second consecutive month.
- Traders are increasingly expecting the Reserve Bank of Australia (RBA) to start cutting interest rates as soon as next month. This outlook is fueled by weaker core inflation data, which has fallen to its lowest level since Q4 2021, nearing the RBA's target range of 2% to 3%. All eyes are now on Australia's upcoming quarterly inflation report, set for release next week, as it could offer additional clues about the future direction of interest rates.
Australian Dollar stays below 0.6300 but is poised to test upper ascending channel’s boundary
AUD/USD trades near 0.6270 on Wednesday. A daily chart analysis suggests that the pair is moving within an ascending channel pattern, indicating the potential development of a bullish bias. Furthermore, the 14-day Relative Strength Index (RSI) is slightly above the 50 mark, reinforcing the presence of bullish sentiment in the market.
On the upside, the AUD/USD pair could test the psychological resistance level at 0.6300, with the next target being the upper boundary of the ascending channel near 0.6320.
The initial support is seen around the nine-day Exponential Moving Average (EMA) at 0.6235, followed by the 14-day EMA at 0.6231. A stronger support level lies at the ascending channel’s lower boundary around 0.6210, with additional support at the psychological level of 0.6200.
AUD/USD: Daily Chart
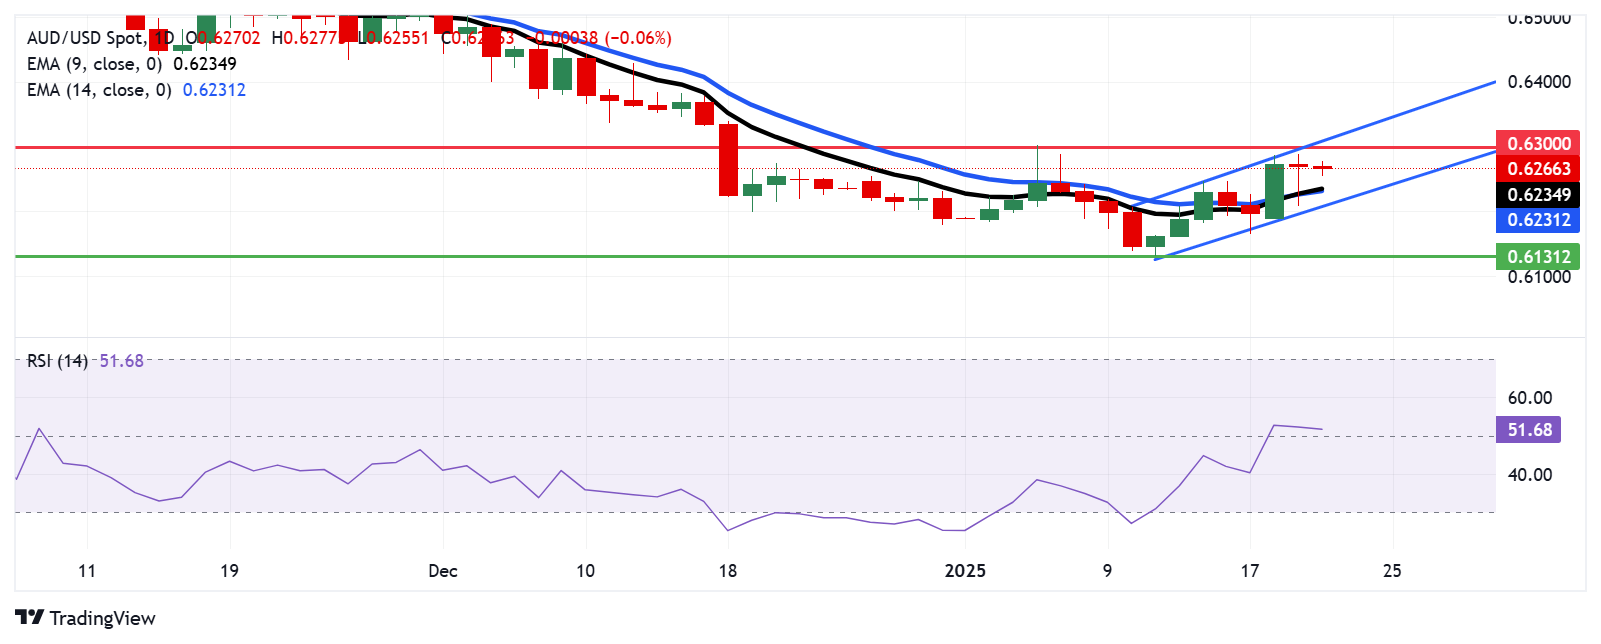
Australian Dollar PRICE Today
The table below shows the percentage change of Australian Dollar (AUD) against listed major currencies today. Australian Dollar was the weakest against the Canadian Dollar.
USD EUR GBP JPY CAD AUD NZD CHF USD 0.08% 0.04% 0.12% -0.03% 0.08% 0.28% 0.06% EUR -0.08% -0.04% 0.05% -0.09% -0.01% 0.19% -0.03% GBP -0.04% 0.04% 0.08% -0.07% 0.04% 0.24% 0.02% JPY -0.12% -0.05% -0.08% -0.14% -0.04% 0.15% -0.06% CAD 0.03% 0.09% 0.07% 0.14% 0.10% 0.30% 0.08% AUD -0.08% 0.00% -0.04% 0.04% -0.10% 0.20% -0.02% NZD -0.28% -0.19% -0.24% -0.15% -0.30% -0.20% -0.22% CHF -0.06% 0.03% -0.02% 0.06% -0.08% 0.02% 0.22% The heat map shows percentage changes of major currencies against each other. The base currency is picked from the left column, while the quote currency is picked from the top row. For example, if you pick the Australian Dollar from the left column and move along the horizontal line to the US Dollar, the percentage change displayed in the box will represent AUD (base)/USD (quote).
Australian Dollar FAQs
One of the most significant factors for the Australian Dollar (AUD) is the level of interest rates set by the Reserve Bank of Australia (RBA). Because Australia is a resource-rich country another key driver is the price of its biggest export, Iron Ore. The health of the Chinese economy, its largest trading partner, is a factor, as well as inflation in Australia, its growth rate and Trade Balance. Market sentiment – whether investors are taking on more risky assets (risk-on) or seeking safe-havens (risk-off) – is also a factor, with risk-on positive for AUD.
The Reserve Bank of Australia (RBA) influences the Australian Dollar (AUD) by setting the level of interest rates that Australian banks can lend to each other. This influences the level of interest rates in the economy as a whole. The main goal of the RBA is to maintain a stable inflation rate of 2-3% by adjusting interest rates up or down. Relatively high interest rates compared to other major central banks support the AUD, and the opposite for relatively low. The RBA can also use quantitative easing and tightening to influence credit conditions, with the former AUD-negative and the latter AUD-positive.
China is Australia’s largest trading partner so the health of the Chinese economy is a major influence on the value of the Australian Dollar (AUD). When the Chinese economy is doing well it purchases more raw materials, goods and services from Australia, lifting demand for the AUD, and pushing up its value. The opposite is the case when the Chinese economy is not growing as fast as expected. Positive or negative surprises in Chinese growth data, therefore, often have a direct impact on the Australian Dollar and its pairs.
Iron Ore is Australia’s largest export, accounting for $118 billion a year according to data from 2021, with China as its primary destination. The price of Iron Ore, therefore, can be a driver of the Australian Dollar. Generally, if the price of Iron Ore rises, AUD also goes up, as aggregate demand for the currency increases. The opposite is the case if the price of Iron Ore falls. Higher Iron Ore prices also tend to result in a greater likelihood of a positive Trade Balance for Australia, which is also positive of the AUD.
The Trade Balance, which is the difference between what a country earns from its exports versus what it pays for its imports, is another factor that can influence the value of the Australian Dollar. If Australia produces highly sought after exports, then its currency will gain in value purely from the surplus demand created from foreign buyers seeking to purchase its exports versus what it spends to purchase imports. Therefore, a positive net Trade Balance strengthens the AUD, with the opposite effect if the Trade Balance is negative.
-
03:07
RBNZ Sectoral Factor Inflation Model arrives at 3.1% YoY in Q4 2024
The Reserve Bank of New Zealand (RBNZ) published its Sectoral Factor Model Inflation gauge for the fourth quarter of 2024, following the release of the official Consumer Price Index (CPI) by the NZ Stats early Wednesday.
The inflation measure extends its downtrend to 3.1% year-over-year (YoY) in Q4 2024 vs. 3.4% in Q3.
The inflation measures are closely watched by the RBNZ, which has a monetary policy goal of achieving 1% to 3% inflation.
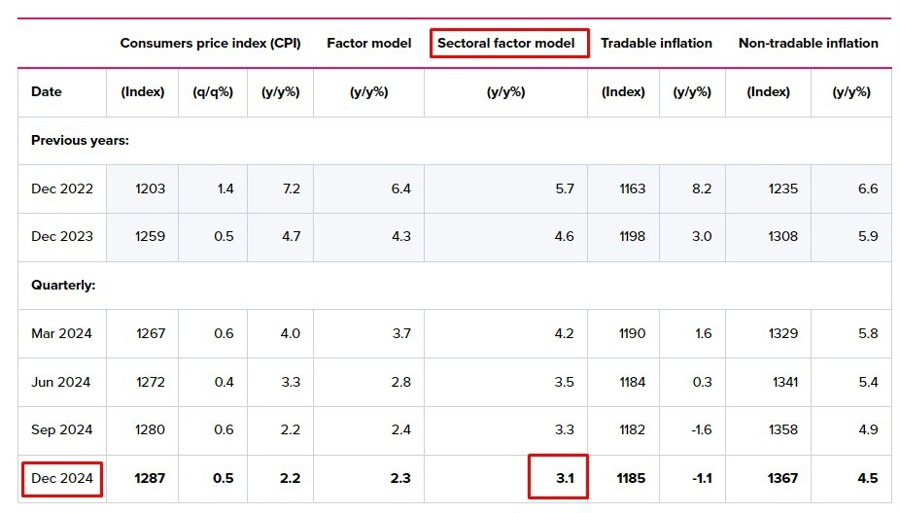
FX implications
The Kiwi Dollar sees a fresh selling wave after the RBNZ’s inflation data. At the time of writing, NZD/USD is down 0.44% on the day to hit intraday lows near 0.5650.
About the RBNZ Sectoral Factor Model Inflation
The Reserve Bank of New Zealand has a set of models that produce core inflation estimates. The sectoral factor model estimates a measure of core inflation based on co-movements - the extent to which individual price series move together. It takes a sectoral approach, estimating core inflation based on two sets of prices: prices of tradable items, which are those either imported or exposed to international competition, and prices of non-tradable items, which are those produced domestically and not facing competition from imports.
-
02:56
Japan’s Rengo agrees with BoJ that there is wage hike momentum in regions
With markets fully pricing in an interest rate hike by the Bank of Japan (BoJ) on Friday, the head of Rengo – Japan’s largest national trade union center said Wednesday that he agrees with the BoJ there is wage hike momentum in Japanese regions.
No further details are provided about the same.
Despite these hawkish headlines, USD/JPY is trading 0.14% higher on the day at 155.70 as of writing.
Bank of Japan FAQs
The Bank of Japan (BoJ) is the Japanese central bank, which sets monetary policy in the country. Its mandate is to issue banknotes and carry out currency and monetary control to ensure price stability, which means an inflation target of around 2%.
The Bank of Japan embarked in an ultra-loose monetary policy in 2013 in order to stimulate the economy and fuel inflation amid a low-inflationary environment. The bank’s policy is based on Quantitative and Qualitative Easing (QQE), or printing notes to buy assets such as government or corporate bonds to provide liquidity. In 2016, the bank doubled down on its strategy and further loosened policy by first introducing negative interest rates and then directly controlling the yield of its 10-year government bonds. In March 2024, the BoJ lifted interest rates, effectively retreating from the ultra-loose monetary policy stance.
The Bank’s massive stimulus caused the Yen to depreciate against its main currency peers. This process exacerbated in 2022 and 2023 due to an increasing policy divergence between the Bank of Japan and other main central banks, which opted to increase interest rates sharply to fight decades-high levels of inflation. The BoJ’s policy led to a widening differential with other currencies, dragging down the value of the Yen. This trend partly reversed in 2024, when the BoJ decided to abandon its ultra-loose policy stance.
A weaker Yen and the spike in global energy prices led to an increase in Japanese inflation, which exceeded the BoJ’s 2% target. The prospect of rising salaries in the country – a key element fuelling inflation – also contributed to the move.
-
02:31
WTI tumbles to near $75.50 as Trump plans to boost oil output, impose tariffs
- WTI price extends its downside to around $75.55 in Wednesday’s Asian session.
- Trump's announcement of tariffs and plan to increase US oil and gas output weigh on the WTI price.
- EIA projected a lower oil price in 2025 amid the uncertainties.
West Texas Intermediate (WTI), the US crude oil benchmark, is trading around $75.55 on Wednesday. The WTI price edges lower as US President Donald Trump weighs imposing tariffs on key trade partners and vowing to increase US oil and gas production.
Trump declared a national energy emergency on Monday and used the authority to rapidly approve new oil, gas, and electricity projects that would normally take years to get permits. This raises the concerns of higher US output in a market widely expected to be oversupplied this year.
Additionally, Trump said that he was considering imposing 25% tariffs on Canada and Mexico while discussing imposing a 10% tariff on goods imported from China on February 1. Tariffs could potentially slow economic growth and exert some selling pressure on black gold.
The US Energy Information Administration (EIA) suggested on Tuesday that Oil prices are expected to decline both this year and next as weak economic activity and energy transition efforts weighed heavily on the US and China. "Strong global growth in production of petroleum and other liquids and slower demand growth put downward pressure on prices," noted EIA economists.WTI Oil FAQs
WTI Oil is a type of Crude Oil sold on international markets. The WTI stands for West Texas Intermediate, one of three major types including Brent and Dubai Crude. WTI is also referred to as “light” and “sweet” because of its relatively low gravity and sulfur content respectively. It is considered a high quality Oil that is easily refined. It is sourced in the United States and distributed via the Cushing hub, which is considered “The Pipeline Crossroads of the World”. It is a benchmark for the Oil market and WTI price is frequently quoted in the media.
Like all assets, supply and demand are the key drivers of WTI Oil price. As such, global growth can be a driver of increased demand and vice versa for weak global growth. Political instability, wars, and sanctions can disrupt supply and impact prices. The decisions of OPEC, a group of major Oil-producing countries, is another key driver of price. The value of the US Dollar influences the price of WTI Crude Oil, since Oil is predominantly traded in US Dollars, thus a weaker US Dollar can make Oil more affordable and vice versa.
The weekly Oil inventory reports published by the American Petroleum Institute (API) and the Energy Information Agency (EIA) impact the price of WTI Oil. Changes in inventories reflect fluctuating supply and demand. If the data shows a drop in inventories it can indicate increased demand, pushing up Oil price. Higher inventories can reflect increased supply, pushing down prices. API’s report is published every Tuesday and EIA’s the day after. Their results are usually similar, falling within 1% of each other 75% of the time. The EIA data is considered more reliable, since it is a government agency.
OPEC (Organization of the Petroleum Exporting Countries) is a group of 12 Oil-producing nations who collectively decide production quotas for member countries at twice-yearly meetings. Their decisions often impact WTI Oil prices. When OPEC decides to lower quotas, it can tighten supply, pushing up Oil prices. When OPEC increases production, it has the opposite effect. OPEC+ refers to an expanded group that includes ten extra non-OPEC members, the most notable of which is Russia.
-
02:15
PBOC sets USD/CNY reference rate at 7.1696 vs. 7.1703 previous
On Wednesday, the People’s Bank of China (PBOC) set the USD/CNY central rate for the trading session ahead at 7.1696 as compared to the previous day's fix of 7.1703 and 7.2642 Reuters estimates.
PBOC FAQs
The primary monetary policy objectives of the People's Bank of China (PBoC) are to safeguard price stability, including exchange rate stability, and promote economic growth. China’s central bank also aims to implement financial reforms, such as opening and developing the financial market.
The PBoC is owned by the state of the People's Republic of China (PRC), so it is not considered an autonomous institution. The Chinese Communist Party (CCP) Committee Secretary, nominated by the Chairman of the State Council, has a key influence on the PBoC’s management and direction, not the governor. However, Mr. Pan Gongsheng currently holds both of these posts.
Unlike the Western economies, the PBoC uses a broader set of monetary policy instruments to achieve its objectives. The primary tools include a seven-day Reverse Repo Rate (RRR), Medium-term Lending Facility (MLF), foreign exchange interventions and Reserve Requirement Ratio (RRR). However, The Loan Prime Rate (LPR) is China’s benchmark interest rate. Changes to the LPR directly influence the rates that need to be paid in the market for loans and mortgages and the interest paid on savings. By changing the LPR, China’s central bank can also influence the exchange rates of the Chinese Renminbi.
Yes, China has 19 private banks – a small fraction of the financial system. The largest private banks are digital lenders WeBank and MYbank, which are backed by tech giants Tencent and Ant Group, per The Straits Times. In 2014, China allowed domestic lenders fully capitalized by private funds to operate in the state-dominated financial sector.
-
02:02
China’s Vice Premier Xuexiang warns trade war has no winners
Chinese Vice Premier Ding Xuexiang warned on Tuesday that there are “no winners” in a trade war as China confronts the threat of tariffs under Donald Trump's newly elected government, per CNBC.
Key quotes
“Protectionism leads nowhere. [A] trade war has no winners.”
“Pursuing protectionism is just like locking one’s self in a dark room. Wind and rain might be kept outside, but so are light and air.”Market reaction
At the press time, the AUD/USD pair is up 0.09% on the day to trade at 0.6275.
Australian Dollar FAQs
One of the most significant factors for the Australian Dollar (AUD) is the level of interest rates set by the Reserve Bank of Australia (RBA). Because Australia is a resource-rich country another key driver is the price of its biggest export, Iron Ore. The health of the Chinese economy, its largest trading partner, is a factor, as well as inflation in Australia, its growth rate and Trade Balance. Market sentiment – whether investors are taking on more risky assets (risk-on) or seeking safe-havens (risk-off) – is also a factor, with risk-on positive for AUD.
The Reserve Bank of Australia (RBA) influences the Australian Dollar (AUD) by setting the level of interest rates that Australian banks can lend to each other. This influences the level of interest rates in the economy as a whole. The main goal of the RBA is to maintain a stable inflation rate of 2-3% by adjusting interest rates up or down. Relatively high interest rates compared to other major central banks support the AUD, and the opposite for relatively low. The RBA can also use quantitative easing and tightening to influence credit conditions, with the former AUD-negative and the latter AUD-positive.
China is Australia’s largest trading partner so the health of the Chinese economy is a major influence on the value of the Australian Dollar (AUD). When the Chinese economy is doing well it purchases more raw materials, goods and services from Australia, lifting demand for the AUD, and pushing up its value. The opposite is the case when the Chinese economy is not growing as fast as expected. Positive or negative surprises in Chinese growth data, therefore, often have a direct impact on the Australian Dollar and its pairs.
Iron Ore is Australia’s largest export, accounting for $118 billion a year according to data from 2021, with China as its primary destination. The price of Iron Ore, therefore, can be a driver of the Australian Dollar. Generally, if the price of Iron Ore rises, AUD also goes up, as aggregate demand for the currency increases. The opposite is the case if the price of Iron Ore falls. Higher Iron Ore prices also tend to result in a greater likelihood of a positive Trade Balance for Australia, which is also positive of the AUD.
The Trade Balance, which is the difference between what a country earns from its exports versus what it pays for its imports, is another factor that can influence the value of the Australian Dollar. If Australia produces highly sought after exports, then its currency will gain in value purely from the surplus demand created from foreign buyers seeking to purchase its exports versus what it spends to purchase imports. Therefore, a positive net Trade Balance strengthens the AUD, with the opposite effect if the Trade Balance is negative.
-
01:30
Stocks. Daily history for Tuesday, January 21, 2025
Index Change, points Closed Change, % NIKKEI 225 125.48 39027.98 0.32 Hang Seng 180.74 20106.55 0.91 KOSPI -2.02 2518.03 -0.08 ASX 200 55 8402.4 0.66 DAX 51.69 21042 0.25 CAC 40 37.45 7770.95 0.48 Dow Jones 537.98 44025.81 1.24 S&P 500 52.58 6049.24 0.88 NASDAQ Composite 126.58 19756.78 0.64 -
01:17
NZD/USD weakens to near 0.5650 as Trump threatens tariffs on China
- NZD/USD softens to around 0.5660 in Wednesday’s early Asian session, down 0.18% on the day.
- Trump’s tariff threats undermine the China-proxy Kiwi.
- The RBNZ will likely deliver a third jumbo rate cut at its February meeting.
The NZD/USD pair attracts some sellers to near 0.5660 during the early Asian session on Wednesday. The New Zealand Dollar (NZD) faces some selling pressure after US President Donald Trump said that he is discussing a 10% tariff on China on February 1.
Trump stated on Tuesday that his administration is discussing imposing a 10% tariff on goods imported from China on February 1 because fentanyl is being sent from China to Mexico and Canada, per Reuters. Investors will closely watch the developments surrounding US tariff policies, as China is a major trading partner to New Zealand.
New Zealand Consumer Price Index (CPI) inflation was slightly hotter than expected in December. Nonetheless, the overshoot doesn’t appear significant enough to dampen expectations for another jumbo rate cut from the Reserve Bank of New Zealand (RBNZ) in February.
Swaps markets are now pricing in a 90% chance of another 50 basis points (bps) reduction on February 19, adding to the two delivered earlier in the cycle. The RBNZ is expected to deliver a total of 100 bps of rate cuts for the remainder of 2025. The dovish stance of the RBNZ continues to weigh on the Kiwi against the US Dollar (USD).New Zealand Dollar FAQs
The New Zealand Dollar (NZD), also known as the Kiwi, is a well-known traded currency among investors. Its value is broadly determined by the health of the New Zealand economy and the country’s central bank policy. Still, there are some unique particularities that also can make NZD move. The performance of the Chinese economy tends to move the Kiwi because China is New Zealand’s biggest trading partner. Bad news for the Chinese economy likely means less New Zealand exports to the country, hitting the economy and thus its currency. Another factor moving NZD is dairy prices as the dairy industry is New Zealand’s main export. High dairy prices boost export income, contributing positively to the economy and thus to the NZD.
The Reserve Bank of New Zealand (RBNZ) aims to achieve and maintain an inflation rate between 1% and 3% over the medium term, with a focus to keep it near the 2% mid-point. To this end, the bank sets an appropriate level of interest rates. When inflation is too high, the RBNZ will increase interest rates to cool the economy, but the move will also make bond yields higher, increasing investors’ appeal to invest in the country and thus boosting NZD. On the contrary, lower interest rates tend to weaken NZD. The so-called rate differential, or how rates in New Zealand are or are expected to be compared to the ones set by the US Federal Reserve, can also play a key role in moving the NZD/USD pair.
Macroeconomic data releases in New Zealand are key to assess the state of the economy and can impact the New Zealand Dollar’s (NZD) valuation. A strong economy, based on high economic growth, low unemployment and high confidence is good for NZD. High economic growth attracts foreign investment and may encourage the Reserve Bank of New Zealand to increase interest rates, if this economic strength comes together with elevated inflation. Conversely, if economic data is weak, NZD is likely to depreciate.
The New Zealand Dollar (NZD) tends to strengthen during risk-on periods, or when investors perceive that broader market risks are low and are optimistic about growth. This tends to lead to a more favorable outlook for commodities and so-called ‘commodity currencies’ such as the Kiwi. Conversely, NZD tends to weaken at times of market turbulence or economic uncertainty as investors tend to sell higher-risk assets and flee to the more-stable safe havens.
-
01:15
Currencies. Daily history for Tuesday, January 21, 2025
Pare Closed Change, % AUDUSD 0.62752 0.11 EURJPY 162.154 0.15 EURUSD 1.04274 0.13 GBPJPY 192.106 0.25 GBPUSD 1.23541 0.31 NZDUSD 0.56764 0.1 USDCAD 1.43167 0.05 USDCHF 0.90557 -0.01 USDJPY 155.498 -0.05 -
01:07
EUR/USD muddles along as trade headlines dominate
- EUR/USD cycled around the ever-familiar 1.0400 level on Tuesday.
- European data remains thin this week until Friday’s PMI prints.
- Trade headlines as President Trump waffles on tariff threats will dominate market attention.
EUR/USD ground into a circle on Tuesday, marking in chart churn around the 1.0400 handle as Fiber bids struggle to find direction. European and US economic data remains thin throughout this week, with investor sentiment hinging entirely on whatever trade war rhetoric new US President Donald Trump tweets from one moment to the next.
Over the course of the current trading week, Donald Trump has waffled on his campaign promises of flat tariffs on all of the US’ trading partners on the day he took office. He brushed off his own statements to pivot to threatening new looming tariffs on Mexico, Canada, and China, ranging from 10% to 25%, to start possibly as soon as February 1, over a 48 hour period. President Trump’s ire over perceived trade slights has seen Europe drop from his revenge tariff list, leaving the Euro to get swamped out near familiar technical levels.
The Euro’s expanding interest rate differential against the Greenback has left Fiber in a technically weak position, and a steady slew of mixed messages from a parade of European Central Bank (ECB) speakers is numbing investor interest in further talking points from policymakers. ECB President Christine Lagarde is due to make yet another public appearance on Wednesday, but little of note is likely to come from the exchange.
Looking ahead, Friday will bring a fresh update of Purchasing Managers Index (PMI) business survey results from both the EU and the US. Both datasets are expected to give a mixed print.
EUR/USD price forecast
EUR/USD price action is getting squeezed into a breakout trap in the near term, with an immediate technical floor priced in near 1.0350 and topside momentum getting strangled by the 50-day Exponential Moving Average (EMA) near 1.0450.
Fiber is still trading on the wrong side of the 200-day EMA near 1.0700, but the pair’s slow grind lower appears to be staging something approaching, but not quite reaching, a technical recovery.
EUR/USD daily chart
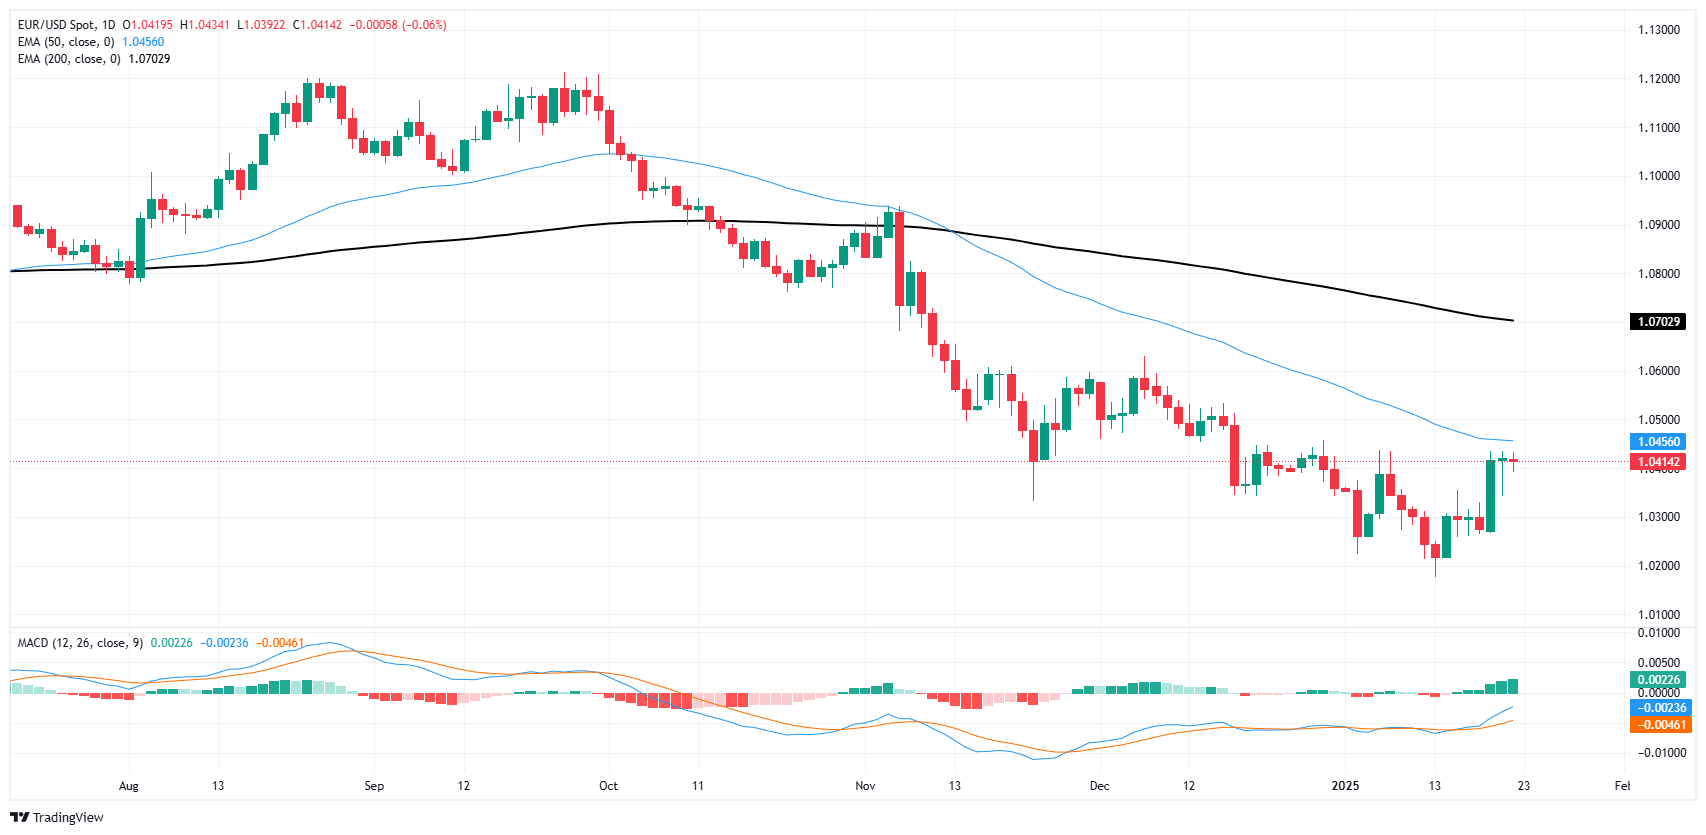
Euro FAQs
The Euro is the currency for the 19 European Union countries that belong to the Eurozone. It is the second most heavily traded currency in the world behind the US Dollar. In 2022, it accounted for 31% of all foreign exchange transactions, with an average daily turnover of over $2.2 trillion a day. EUR/USD is the most heavily traded currency pair in the world, accounting for an estimated 30% off all transactions, followed by EUR/JPY (4%), EUR/GBP (3%) and EUR/AUD (2%).
The European Central Bank (ECB) in Frankfurt, Germany, is the reserve bank for the Eurozone. The ECB sets interest rates and manages monetary policy. The ECB’s primary mandate is to maintain price stability, which means either controlling inflation or stimulating growth. Its primary tool is the raising or lowering of interest rates. Relatively high interest rates – or the expectation of higher rates – will usually benefit the Euro and vice versa. The ECB Governing Council makes monetary policy decisions at meetings held eight times a year. Decisions are made by heads of the Eurozone national banks and six permanent members, including the President of the ECB, Christine Lagarde.
Eurozone inflation data, measured by the Harmonized Index of Consumer Prices (HICP), is an important econometric for the Euro. If inflation rises more than expected, especially if above the ECB’s 2% target, it obliges the ECB to raise interest rates to bring it back under control. Relatively high interest rates compared to its counterparts will usually benefit the Euro, as it makes the region more attractive as a place for global investors to park their money.
Data releases gauge the health of the economy and can impact on the Euro. Indicators such as GDP, Manufacturing and Services PMIs, employment, and consumer sentiment surveys can all influence the direction of the single currency. A strong economy is good for the Euro. Not only does it attract more foreign investment but it may encourage the ECB to put up interest rates, which will directly strengthen the Euro. Otherwise, if economic data is weak, the Euro is likely to fall. Economic data for the four largest economies in the euro area (Germany, France, Italy and Spain) are especially significant, as they account for 75% of the Eurozone’s economy.
Another significant data release for the Euro is the Trade Balance. This indicator measures the difference between what a country earns from its exports and what it spends on imports over a given period. If a country produces highly sought after exports then its currency will gain in value purely from the extra demand created from foreign buyers seeking to purchase these goods. Therefore, a positive net Trade Balance strengthens a currency and vice versa for a negative balance.
-
00:55
Australia Westpac Leading Index (MoM) dipped from previous 0.1% to 0% in December
-
00:27
US President Donald Trump says he is discussing 10% tariff on China on February 1
US President Donald Trump said on Tuesday that his administration is discussing imposing a 10% tariff on goods imported from China on February 1 because fentanyl is being sent from China to Mexico and Canada, per Reuters.
Market reaction
At the press time, the AUD/USD pair is down 0.12% on the day to trade at 0.6262.
Australian Dollar FAQs
One of the most significant factors for the Australian Dollar (AUD) is the level of interest rates set by the Reserve Bank of Australia (RBA). Because Australia is a resource-rich country another key driver is the price of its biggest export, Iron Ore. The health of the Chinese economy, its largest trading partner, is a factor, as well as inflation in Australia, its growth rate and Trade Balance. Market sentiment – whether investors are taking on more risky assets (risk-on) or seeking safe-havens (risk-off) – is also a factor, with risk-on positive for AUD.
The Reserve Bank of Australia (RBA) influences the Australian Dollar (AUD) by setting the level of interest rates that Australian banks can lend to each other. This influences the level of interest rates in the economy as a whole. The main goal of the RBA is to maintain a stable inflation rate of 2-3% by adjusting interest rates up or down. Relatively high interest rates compared to other major central banks support the AUD, and the opposite for relatively low. The RBA can also use quantitative easing and tightening to influence credit conditions, with the former AUD-negative and the latter AUD-positive.
China is Australia’s largest trading partner so the health of the Chinese economy is a major influence on the value of the Australian Dollar (AUD). When the Chinese economy is doing well it purchases more raw materials, goods and services from Australia, lifting demand for the AUD, and pushing up its value. The opposite is the case when the Chinese economy is not growing as fast as expected. Positive or negative surprises in Chinese growth data, therefore, often have a direct impact on the Australian Dollar and its pairs.
Iron Ore is Australia’s largest export, accounting for $118 billion a year according to data from 2021, with China as its primary destination. The price of Iron Ore, therefore, can be a driver of the Australian Dollar. Generally, if the price of Iron Ore rises, AUD also goes up, as aggregate demand for the currency increases. The opposite is the case if the price of Iron Ore falls. Higher Iron Ore prices also tend to result in a greater likelihood of a positive Trade Balance for Australia, which is also positive of the AUD.
The Trade Balance, which is the difference between what a country earns from its exports versus what it pays for its imports, is another factor that can influence the value of the Australian Dollar. If Australia produces highly sought after exports, then its currency will gain in value purely from the surplus demand created from foreign buyers seeking to purchase its exports versus what it spends to purchase imports. Therefore, a positive net Trade Balance strengthens the AUD, with the opposite effect if the Trade Balance is negative.
-
00:16
GBP/USD poised for further headline-fueled gains
- GBP/USD roiled on Tuesday, finding support from 1.2300.
- UK labor data came in mixed, flubbing forecasts in both directions.
- With low-tier data on the docket for Wednesday, trade headlines will rule the roost.
GBP/USD spun in a circle on Tuesday, falling and then climbing in lockstep with global money flows into and out of the US Dollar. The Pound Sterling saw mixed labor data results from the UK, but the UK’s own labor department takes the numbers with a grain of salt. On the American side, US President Donald Trump brushed off his own campaign trail promises of instituting sweeping day-one tariffs on all of the US’ trading partners, focusing newer, more refined tariff threats on the US’ North American trade partners Canada and Mexico.
Markets have whipsawed as investors race to catch up with the newest headline generator on the block, President Trump. Investors have been betting big that the newly-minted US President wouldn’t impose day-one tariffs as he had long threatened, however a fresh round of updated trade rhetoric is keeping market sentiment tangled in the midrange.
Only low-tier data is on the offering for Wednesday, leaving Cable traders to focus on developing headlines likely to be concentrated during the US trading hours. Pound Sterling traders will be on the lookout for Friday’s S&P Global Purchasing Managers Index (PMI) figures due on both sides of the Atlantic.
GBP/USD price forecast
GBP/USD continues to grind its way into a half-hearted technical recovery, with bidders struggling to lock their grip on the 1.2300 level convincingly. Price action is tilted into the bullish side with technical oscillators pivoting into buy signals, but the pair remains steeply off of recent highs after knocking into a 15-month low last week.
Topside momentum is set to face firm technical barriers at the 50-day Exponential Moving Average (EMA) falling into 1.2500, the same level that the pair’s last major swing low clocked in late November.
GBP/USD daily chart
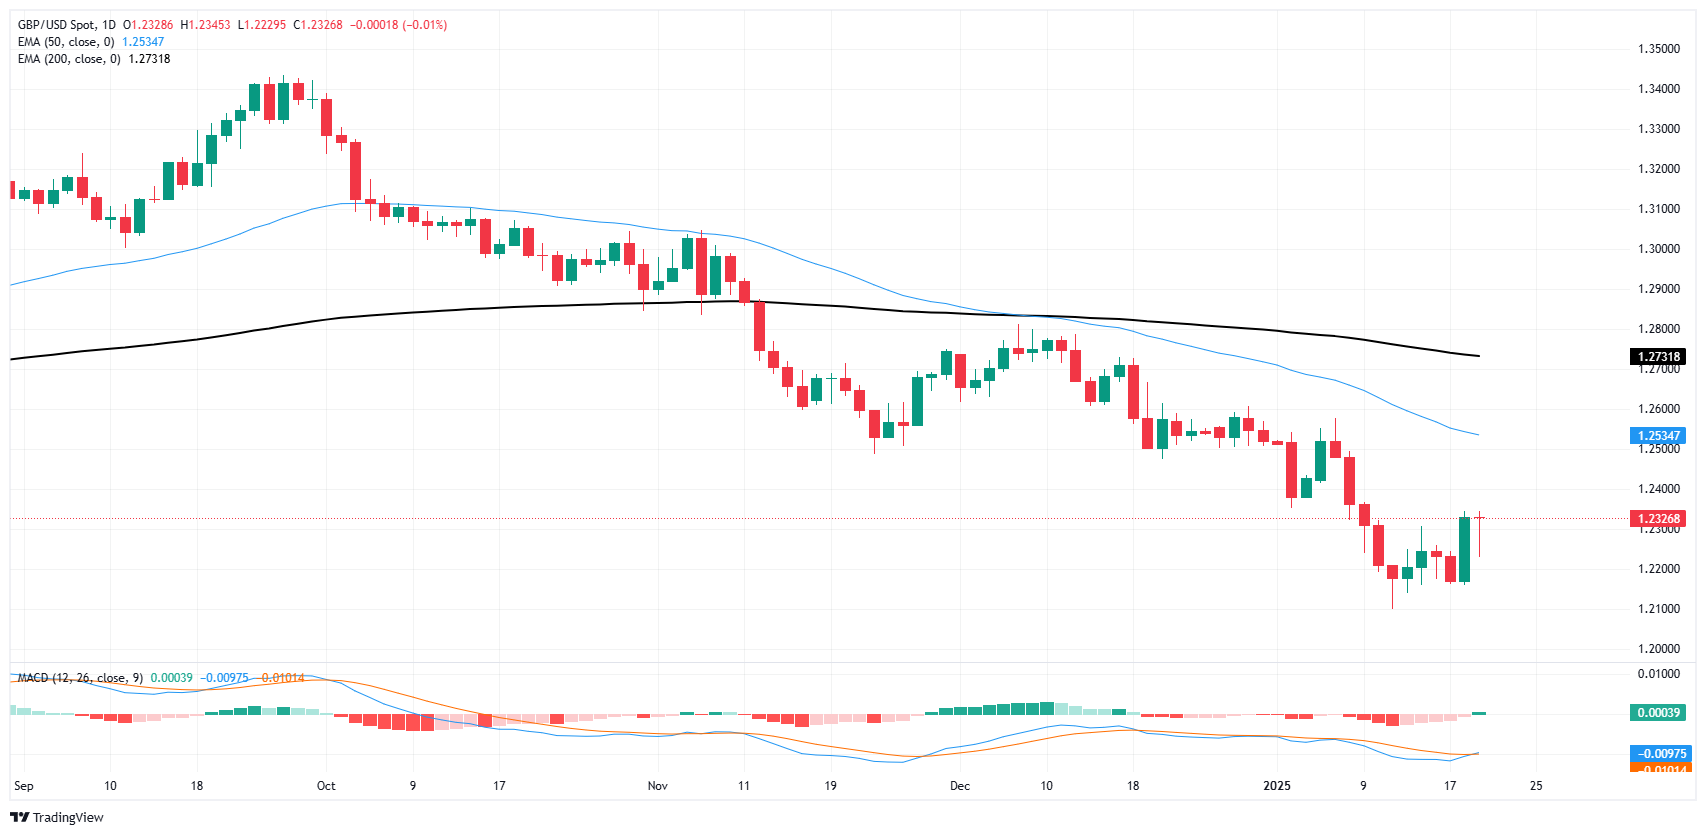
Pound Sterling FAQs
The Pound Sterling (GBP) is the oldest currency in the world (886 AD) and the official currency of the United Kingdom. It is the fourth most traded unit for foreign exchange (FX) in the world, accounting for 12% of all transactions, averaging $630 billion a day, according to 2022 data. Its key trading pairs are GBP/USD, also known as ‘Cable’, which accounts for 11% of FX, GBP/JPY, or the ‘Dragon’ as it is known by traders (3%), and EUR/GBP (2%). The Pound Sterling is issued by the Bank of England (BoE).
The single most important factor influencing the value of the Pound Sterling is monetary policy decided by the Bank of England. The BoE bases its decisions on whether it has achieved its primary goal of “price stability” – a steady inflation rate of around 2%. Its primary tool for achieving this is the adjustment of interest rates. When inflation is too high, the BoE will try to rein it in by raising interest rates, making it more expensive for people and businesses to access credit. This is generally positive for GBP, as higher interest rates make the UK a more attractive place for global investors to park their money. When inflation falls too low it is a sign economic growth is slowing. In this scenario, the BoE will consider lowering interest rates to cheapen credit so businesses will borrow more to invest in growth-generating projects.
Data releases gauge the health of the economy and can impact the value of the Pound Sterling. Indicators such as GDP, Manufacturing and Services PMIs, and employment can all influence the direction of the GBP. A strong economy is good for Sterling. Not only does it attract more foreign investment but it may encourage the BoE to put up interest rates, which will directly strengthen GBP. Otherwise, if economic data is weak, the Pound Sterling is likely to fall.
Another significant data release for the Pound Sterling is the Trade Balance. This indicator measures the difference between what a country earns from its exports and what it spends on imports over a given period. If a country produces highly sought-after exports, its currency will benefit purely from the extra demand created from foreign buyers seeking to purchase these goods. Therefore, a positive net Trade Balance strengthens a currency and vice versa for a negative balance.
-
00:14
USD/CAD holds positive ground near 1.4350 as Trump vows Canada tariffs
- USD/CAD posts modest gains around 1.4340 in Wednesday’s early Asian session.
- Trump threatened 25% tariffs on Mexico and Canada on February 1, weighing on the CAD.
- Canadian headline CPI rose below consensus in December.
The USD/CAD pair trades with mild gains around 1.4340 during the early Asian session on Wednesday. The Canadian Dollar (CAD) weakens amid softer Canada’s December Consumer Price Index (CPI) inflation data and concerns about a trade war between the United States and Canada.
On Monday, US President Donald Trump said that he was thinking of imposing 25% tariffs on imports from Canada and Mexico on February 1 as both countries were allowing many people to cross the border as well as fentanyl. Trump’s remarks exert some selling pressure on the Loonie as Canada is highly dependent on trade with the US, with roughly 75% of its exports heading south.
Canadian Prime Minister Justin Trudeau stated that his government is ready to respond to any scenario if Trump implements tariffs on Canada. Trudeau added that Trump's promised prosperity for the United States would need Canadian resources to fuel it.
Canada’s CPI report has opened the door to the Bank of Canada (BoC) rate cut in January. Data released by Statistics Canada on Tuesday showed that the country’s CPI inflation eased to 1.8% YoY in December from 1.9% in November. This reading was slightly below the 1.9% expected.
“We believe that the Bank of Canada should continue to ease monetary policy by cutting its policy rate by 25 basis points next week. This would give us a little more hope of seeing economic growth above potential assuming Canada is able to avoid a tariff war with our largest trading partner,” said Matthieu Arseneau, economist at the National Bank of Canada.Canadian Dollar FAQs
The key factors driving the Canadian Dollar (CAD) are the level of interest rates set by the Bank of Canada (BoC), the price of Oil, Canada’s largest export, the health of its economy, inflation and the Trade Balance, which is the difference between the value of Canada’s exports versus its imports. Other factors include market sentiment – whether investors are taking on more risky assets (risk-on) or seeking safe-havens (risk-off) – with risk-on being CAD-positive. As its largest trading partner, the health of the US economy is also a key factor influencing the Canadian Dollar.
The Bank of Canada (BoC) has a significant influence on the Canadian Dollar by setting the level of interest rates that banks can lend to one another. This influences the level of interest rates for everyone. The main goal of the BoC is to maintain inflation at 1-3% by adjusting interest rates up or down. Relatively higher interest rates tend to be positive for the CAD. The Bank of Canada can also use quantitative easing and tightening to influence credit conditions, with the former CAD-negative and the latter CAD-positive.
The price of Oil is a key factor impacting the value of the Canadian Dollar. Petroleum is Canada’s biggest export, so Oil price tends to have an immediate impact on the CAD value. Generally, if Oil price rises CAD also goes up, as aggregate demand for the currency increases. The opposite is the case if the price of Oil falls. Higher Oil prices also tend to result in a greater likelihood of a positive Trade Balance, which is also supportive of the CAD.
While inflation had always traditionally been thought of as a negative factor for a currency since it lowers the value of money, the opposite has actually been the case in modern times with the relaxation of cross-border capital controls. Higher inflation tends to lead central banks to put up interest rates which attracts more capital inflows from global investors seeking a lucrative place to keep their money. This increases demand for the local currency, which in Canada’s case is the Canadian Dollar.
Macroeconomic data releases gauge the health of the economy and can have an impact on the Canadian Dollar. Indicators such as GDP, Manufacturing and Services PMIs, employment, and consumer sentiment surveys can all influence the direction of the CAD. A strong economy is good for the Canadian Dollar. Not only does it attract more foreign investment but it may encourage the Bank of Canada to put up interest rates, leading to a stronger currency. If economic data is weak, however, the CAD is likely to fall.
-