Noticias del mercado
-
00:10
Silver Price Analysis: XAG/USD climbs above $29.00 on soft US PCE
- Silver up 0.49, boosted by lower US inflation data and Fed rate cut prospects.
- Technical analysis shows bearish trends; RSI indicates selling pressure with lower highs, lower lows.
- Resistance levels: $29.19 (50-DMA), $31.54 (June 7 high), $32.00, $32.51 (YTD high).
- Support points: $29.00, $28.28 (June 10, 2021, high), $28.00, $27.01 (May 8 low), $26.82 (100-DMA).
Silver price registered gains of 0.49% as inflationary figures released by the US Bureau of Economic Analysis (BEA) dipped as expected, reigniting Fed rate cut hopes amongst investors. Therefore, the Greenback edged lower, while XAG/USD traded at $29.13 after hitting a daily low of $28.78.
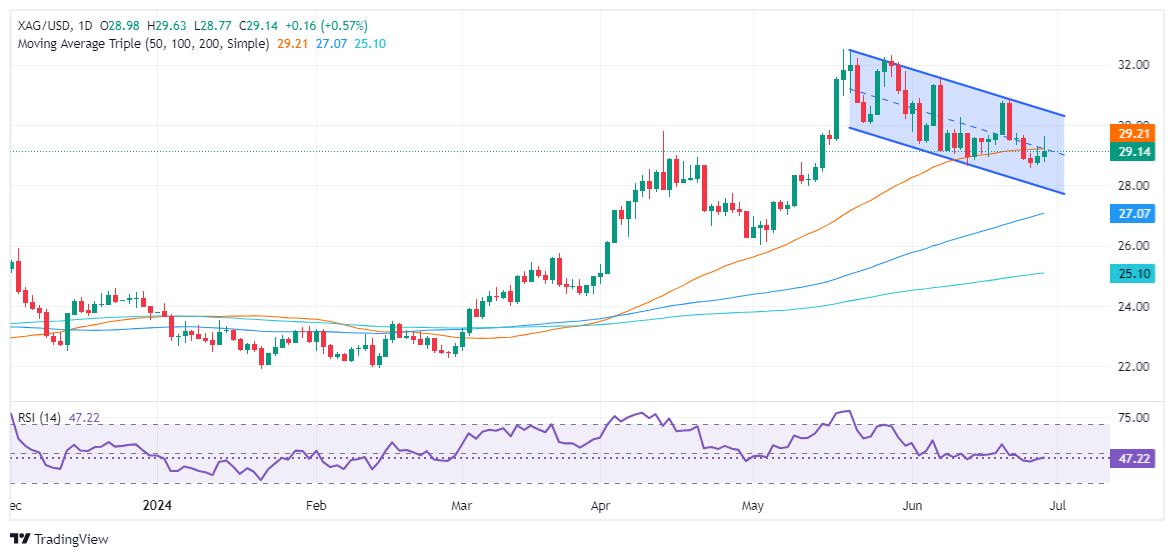
XAG/USD Price Analysis: Technical outlook
After forming a quasi ‘double top,’ the Silver price extended its losses, which amounted to more than 10% after it peaked at around $32.51 on May 20. The uptrend seems exhausted, as shown by different signals: momentum shifted bearishly as the Relative Strength Index (RSI) entered seller territory, while successive series of lower highs and lower lows confirm the change of the trend.
If buyers want to regain control, they must clear the 50-day moving average (DMA) at $29.19. Once hurdle, the next level would be the June 7 high of $31.54. Clearing this would aim for $32.00 before challenging the year-to-date (YTD) high of $32.51.
Conversely, and the path of least resistance, if XAG/USD slides below $29.00 that could put into play the June 10, 2021, high turned support at $28.28, ahead of exposing the psychological $28.00 mark.
Key support levels lie underneath the latter, with the May 8 swing low of $27.01 up next before challenging the 100-DMA at $26.82.
XAG/USD Price Action – Daily Chart
Economic Indicator
Personal Consumption Expenditures - Price Index (MoM)
The Personal Consumption Expenditures (PCE), released by the US Bureau of Economic Analysis on a monthly basis, measures the changes in the prices of goods and services purchased by consumers in the United States (US).. The MoM figure compares prices in the reference month to the previous month. Price changes may cause consumers to switch from buying one good to another and the PCE Deflator can account for such substitutions. This makes it the preferred measure of inflation for the Federal Reserve. Generally speaking, a high reading is bullish for the US Dollar (USD), while a low reading is bearish.
Read more.Last release: Fri Jun 28, 2024 12:30
Frequency: Monthly
Actual: 0%
Consensus: 0%
Previous: 0.3%
Source: US Bureau of Economic Analysis
-
00:08
NZD/JPY Price Analysis: Bullish bias continues as pair surpasses 98.00
- NZD/JPY's bullish run persists as the cross surges past 98.00, marking fresh highs since 2007.
- The 20-day SMA provides robust support at 96.90.
- The strong bullish outlook stays intact, but a consolidation looms.
On Friday, the NZD/JPY cross made significant strides, gaining momentum and setting new cycle highs beyond 98.00. Notably, this represents the pair's highest position since 2007, substantiating the strong bullish bias. However, given the overbought conditions, a healthy correction would be necessary.
The daily chart's Relative Strength Index (RSI) value now sits at 68, entering the overbought territory. This demonstrates a continued bullish advance from earlier in the week, indicating that positive momentum still drives the pair. Despite these strong bullish indicators, the Moving Average Convergence Divergence (MACD) is not turning out green bars, suggesting that buyers may be losing their momentum.
NZD/JPY daily chart
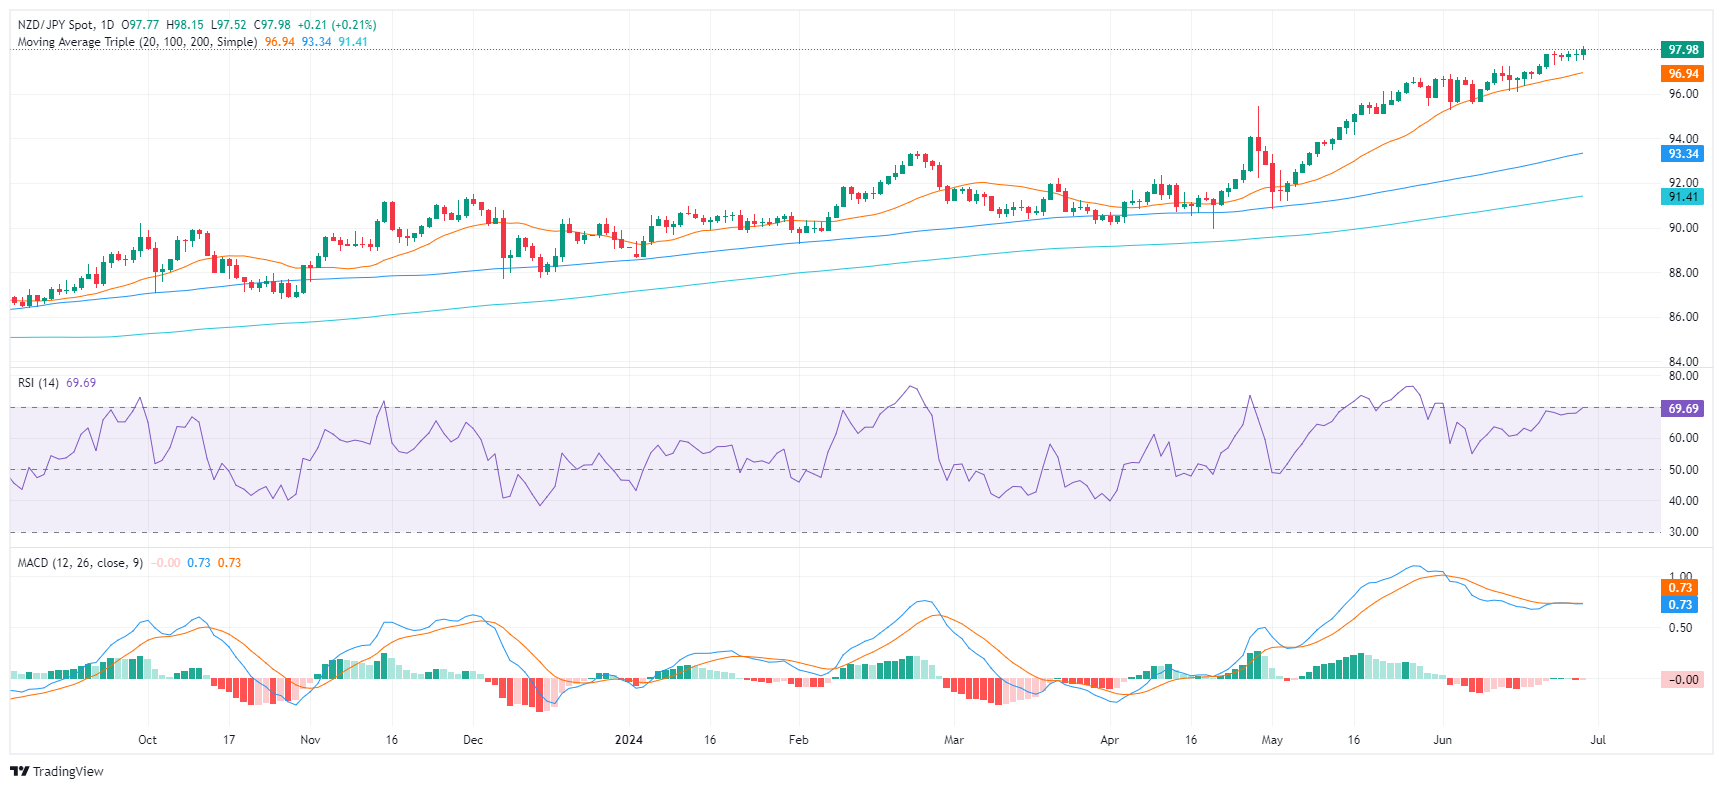
Going forward, market participants keep a keen eye on the immediate support level of 97.00, with additional support at 96.90, close to the 20-day SMA and the previous low of 95.00. Moreover, they have trained their sights on the resistance targets of 98.50 and 99.00. A decisive breach above the ongoing range will provide further confirmation of the upside potential while slipping beneath the 20-day SMA could signal a more profound correction.
-