Noticias del mercado
-
22:23
Gold hovers near all-time highs as tariff confusion sparks market jitters
- Gold sustains gains, trading at $2,797, as White House clarifies tariff timeline confusion.
- Revised tariff announcements lead to brief dip in Gold with traders eyeing $2,800 resistance.
- Despite steady December Core PCE data, geopolitical uncertainty keeps Gold prices elevated.
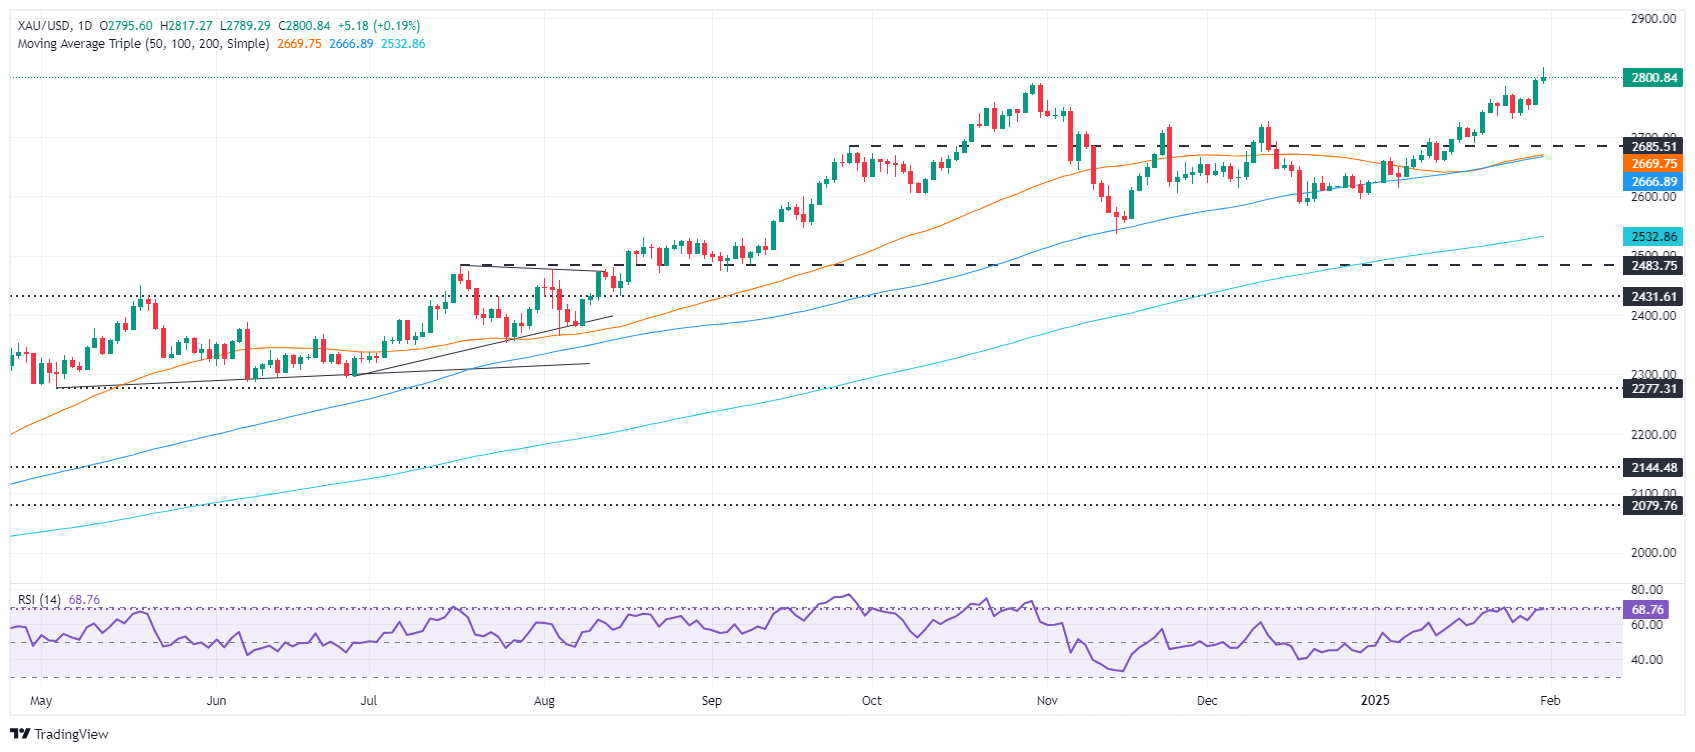
Gold price trades near all-time highs above $2,800 on Friday as market participants turn risk-averse after the White House corrected earlier reports from Reuters that the United States (US) would not impose tariffs on Canada and Mexico on February 1 and instead would do it on March 1. At the time of writing, XAU/USD trades at $2,797, up 0.15%.
US Press Secretary Karoline Leavitt emphasized that tariffs of 25% would be enacted on Canada and Mexico on February 1, Saturday, adding that previous reports were wrong. She also added that Washington would apply 10% duties on goods imported from China.
Following the report, the Greenback advanced, and Gold trimmed some of its earlier gains above $2,800. Bullion’s failure to print a daily close above the latter could pave the way for booking profits ahead of next week’s US Nonfarm Payrolls data.
An earlier report from Reuters revealed that the US was set to impose tariffs until March 1. The article pointed out that Trump will announce tariffs that will include a process for the countries to seek exemption on certain imports.December’s Core Personal Consumption Expenditures (PCE) Price Index, the Fed’s preferred inflation gauge, increased in December as expected, surpassing November’s number. However, on a yearly basis, Core PCE remained unchanged from the previous figures.
The data comes after soft Q4 GDP figures and the Federal Reserve’s latest monetary policy meeting. Meanwhile, Fed officials have begun making public remarks, with Governor Michelle Bowman and Chicago Fed President Austan Goolsbee weighing in on economic conditions.
Daily digest market movers: Gold price advances on US tariff headlines
- Gold price edges up despite the rise of US Treasury yields. The US 10-year T-note yield rises six basis points to 4.571%. US real yields, as measured by the 10-year Treasury Inflation-Protected Securities (TIPS), followed suit, climbing seven basis points to 2.146%.
- The US Core PCE rose by 2.8% YoY in December, in line with expectations, while monthly inflation increased by 0.2%, up from November’s 0.1%.
- Fed Governor Michelle Bowman maintained a hawkish stance, boosting the US Dollar by emphasizing that inflation risks remain skewed to the upside. While she did not rule out rate cuts, she stressed they would be data-dependent and likely gradual.
- Chicago Fed President Austan Goolsbee expressed confidence in the December inflation report, stating that inflation is progressing toward the 2% target.
- Money market futures now price in 50 basis points of Fed rate cuts in 2025, with traders anticipating the first move in June.
XAU/USD technical outlook: Gold price bulls lurk near $2,800
Gold’s uptrend has regained momentum, surging to a record high of $2,817 hit earlier as bulls eye higher prices like the $2,850 milestone. A sustained rally could see buyers targeting the latter, followed by $2,900 and eventually the $3,000 mark.
Conversely, sellers must clear the January 27 swing low of $2,730, before the golden metal tumbles toward $2,700. If surpassed, the next stop would be the confluence of the 50 and 100-day Simple Moving Averages (SMAs) from $2,666 to $2,671.
On the downside, sellers would need to push XAU/USD below $2,750 to strengthen bearish prospects toward $2,700. A break below that level could open the door for further losses with key support at $2,663 where the 50-day and 100-day Simple Moving Averages (SMAs) converge.
Gold FAQs
Gold has played a key role in human’s history as it has been widely used as a store of value and medium of exchange. Currently, apart from its shine and usage for jewelry, the precious metal is widely seen as a safe-haven asset, meaning that it is considered a good investment during turbulent times. Gold is also widely seen as a hedge against inflation and against depreciating currencies as it doesn’t rely on any specific issuer or government.
Central banks are the biggest Gold holders. In their aim to support their currencies in turbulent times, central banks tend to diversify their reserves and buy Gold to improve the perceived strength of the economy and the currency. High Gold reserves can be a source of trust for a country’s solvency. Central banks added 1,136 tonnes of Gold worth around $70 billion to their reserves in 2022, according to data from the World Gold Council. This is the highest yearly purchase since records began. Central banks from emerging economies such as China, India and Turkey are quickly increasing their Gold reserves.
Gold has an inverse correlation with the US Dollar and US Treasuries, which are both major reserve and safe-haven assets. When the Dollar depreciates, Gold tends to rise, enabling investors and central banks to diversify their assets in turbulent times. Gold is also inversely correlated with risk assets. A rally in the stock market tends to weaken Gold price, while sell-offs in riskier markets tend to favor the precious metal.
The price can move due to a wide range of factors. Geopolitical instability or fears of a deep recession can quickly make Gold price escalate due to its safe-haven status. As a yield-less asset, Gold tends to rise with lower interest rates, while higher cost of money usually weighs down on the yellow metal. Still, most moves depend on how the US Dollar (USD) behaves as the asset is priced in dollars (XAU/USD). A strong Dollar tends to keep the price of Gold controlled, whereas a weaker Dollar is likely to push Gold prices up.
-
22:16
US President Donald Trump: I will impose tariffs on the EU
United States (US) President Donald Trump spoke with reporters late on Friday, further amending statements made by his own White House personnel which were also meant to amend reports that the Trump administration may be kicking the tariff can down the road to March 1. President Trump's team reiterated that tariffs on Mexico, Canada, and China were all starting this weekend on February 1.
Donald Trump himself added further fuel to the trade war fire, noting that not only are 25% tariffs landing on Mexico and Canada, but China is also getting its own 10% tariff. President Trump then added the European Union to his list of grievances he intends to solve with import taxes levied against US consumers, but added a caveat that Canadian Crude Oil imports, which the US energy sector is heavily reliant on, will see a specific tariff level of only 10%.
President Trump's clarifying statements to select reporters rambled somewhat, adding Venezuela to the mix of countries that the US intends to "do something about". Trump also addressed his concepts of a plan for tariffs on the EU at multiple points, however specific details remain thin.
Key highlights
Trump: Nothing can be done by China, Mexico and Canada right now to forestall tariffs.
We have big deficits and tariffs are something we're doing.
We may increase tariffs.
We're not looking for concession.
Canada has treated us very unfairly.
We will eventually put tariffs on chips.
We will put tariffs on steel, aluminum, and copper.
We will put tariffs on steel and aluminum this month or next.
I want to bring pharmaceuticals back to America with tariffs.
We are going to take back the Panama Canal.
I'm bringing tomorrow’s tariffs down to 10% on Canadian oil.
We want to do something with Venezuela.
I will impose tariffs on the European union.
Absolutely will put tariffs on the EU.
Tariff costs are sometimes passed along to consumers.
Tariffs may cause short-term disruption.
I'm not concerned about market reactions to tariffs.
We'll be doing something very substantial on tariffs with European union.
-
22:09
Australian Dollar trades softly higher despite tariff concerns
- AUD/USD hovers above 0.6200, defending mild bids amid US tariff concerns and weak Chinese data.
- US PCE data showed no surprises, Fed remains cautious.
- RBA dovish bets continue to pressure the pair.
The Australian Dollar clings to mild gains on Friday, trading around 0.6215 after briefly touching a two-week low. The pair remains under pressure as US President Donald Trump reaffirmed plans to impose tariffs on Chinese imports, dampening risk sentiment.
Meanwhile, speculation over a potential rate cut by the Reserve Bank of Australia (RBA) in February and ongoing economic struggles in China continue to weigh on the Aussie.
Daily digest market movers: Aussie struggles on US tariffs concerns
- US confirms 25% tariffs on Canada and Mexico, 10% on China, effective February 1.
- US Dollar retreats as weak economic data erases weekly gains, pushing the DXY lower from its peak near 108.00.
- China’s PMI data disappoints with manufacturing contracting and services barely expanding, pressuring the Aussie.
- Iron ore prices hit yearly highs, offering mild support to AUD despite concerns over China’s weak demand.
- Markets consider that the RBA cutting rates in February is a done deal, which is also weakening the Aussie.
- On the US data front, the Personal Consumption Expenditures (PCE) Price Index, the Federal Reserve's preferred inflation measure, rose by 0.3% MoM in December, following a 0.1% increase in November.
- On an annual basis, the PCE inflation rate increased to 2.6% from the previous month's 2.4%. The core PCE, which excludes food and energy prices, remained steady at 2.8% YoY for the third consecutive month.
- Markets are expecting no rate cut by the Fed in March.
Technical outlook: AUD/USD struggles for direction
AUD/USD remains confined within a narrow range, facing resistance near 0.6230 while holding support at 0.6200. The Relative Strength Index (RSI) stands at 42 in negative territory, reflecting a lack of clear directional momentum. Meanwhile, the Moving Average Convergence Divergence (MACD) histogram prints decreasing green bars, suggesting fading bullish strength.
Despite recent recovery attempts, the Aussie’s upside potential appears limited. A break below 0.6200 could trigger further losses, while a move above 0.6230 may offer short-term relief.
Australian Dollar FAQs
One of the most significant factors for the Australian Dollar (AUD) is the level of interest rates set by the Reserve Bank of Australia (RBA). Because Australia is a resource-rich country another key driver is the price of its biggest export, Iron Ore. The health of the Chinese economy, its largest trading partner, is a factor, as well as inflation in Australia, its growth rate and Trade Balance. Market sentiment – whether investors are taking on more risky assets (risk-on) or seeking safe-havens (risk-off) – is also a factor, with risk-on positive for AUD.
The Reserve Bank of Australia (RBA) influences the Australian Dollar (AUD) by setting the level of interest rates that Australian banks can lend to each other. This influences the level of interest rates in the economy as a whole. The main goal of the RBA is to maintain a stable inflation rate of 2-3% by adjusting interest rates up or down. Relatively high interest rates compared to other major central banks support the AUD, and the opposite for relatively low. The RBA can also use quantitative easing and tightening to influence credit conditions, with the former AUD-negative and the latter AUD-positive.
China is Australia’s largest trading partner so the health of the Chinese economy is a major influence on the value of the Australian Dollar (AUD). When the Chinese economy is doing well it purchases more raw materials, goods and services from Australia, lifting demand for the AUD, and pushing up its value. The opposite is the case when the Chinese economy is not growing as fast as expected. Positive or negative surprises in Chinese growth data, therefore, often have a direct impact on the Australian Dollar and its pairs.
Iron Ore is Australia’s largest export, accounting for $118 billion a year according to data from 2021, with China as its primary destination. The price of Iron Ore, therefore, can be a driver of the Australian Dollar. Generally, if the price of Iron Ore rises, AUD also goes up, as aggregate demand for the currency increases. The opposite is the case if the price of Iron Ore falls. Higher Iron Ore prices also tend to result in a greater likelihood of a positive Trade Balance for Australia, which is also positive of the AUD.
The Trade Balance, which is the difference between what a country earns from its exports versus what it pays for its imports, is another factor that can influence the value of the Australian Dollar. If Australia produces highly sought after exports, then its currency will gain in value purely from the surplus demand created from foreign buyers seeking to purchase its exports versus what it spends to purchase imports. Therefore, a positive net Trade Balance strengthens the AUD, with the opposite effect if the Trade Balance is negative.
-
21:31
Japan CFTC JPY NC Net Positions rose from previous ¥-14.7K to ¥-1K
-
21:31
United States CFTC S&P 500 NC Net Positions climbed from previous $-75.7K to $-56.2K
-
21:31
United States CFTC Oil NC Net Positions fell from previous 298.8K to 264.1K
-
21:31
Eurozone CFTC EUR NC Net Positions fell from previous €-62.5K to €-66.6K
-
21:31
Australia CFTC AUD NC Net Positions fell from previous $-71.3K to $-71.8K
-
21:30
United Kingdom CFTC GBP NC Net Positions dipped from previous £-8.3K to £-21.7K
-
21:30
United States CFTC Gold NC Net Positions: $299.4K vs previous $300.8K
-
20:46
Dow Jones Industrial Average sinks amid renewed tariff threats
- The Dow Jones tumbled around 300 points on Friday.
- According to the White House, reports of a delay in tariffs is false.
- US PCE inflation met expectations, and trade tariffs are inbound this weekend.
The Dow Jones Industrial Average (DJIA) broke to the bearish side toward the tail end of the US trading session on Friday. Equities backslid after a spokesperson for US President Donald Trump reaffirmed that trade tariffs against Canada, Mexico, and China will be implemented this Saturday.
Pre-market reports suggested that President Trump’s team would be kicking the tariff can down the road, and the White House would be instituting exemption policies that US trade partners would be able to use to soften the blow of tariffs on key industries. The reports were enough to keep investor sentiment buoyed, with analysts from JPMorgan pivoting to expect a “base case” of no tariffs at all. However, White House Press Secretary Karoline Leavitt crushed those hopes, reiterating that import tariffs of 25% on Canada and Mexico and a 10% tariff on all Chinese goods would be implemented beginning February 1.
White House: Earlier reports are wrong, tariffs are coming February 1
Further cold water was splashed on investor sentiment after Press Secretary Leavitt confirmed that, while President Trump is ‘exploring’ an exemption mechanism and an exemption specifically for the Canadian Crude Oil industry, nothing is currently on the books. The US economy heavily relies on Canadian Crude Oil imports, with most US refineries geared to process heavy Crude Oil products from Canada and Mexico, not the light sweet crude oil products produced by US pumpjacks.
US Personal Consumption Expenditures Price Index (PCEPI) inflation came in exactly as expected on Friday, showing that key core inflation metrics are holding stubbornly higher than the Federal Reserve’s (Fed) 2% annual target, making it difficult for the US central bank to deliver rate cuts in a timely manner. US PCE inflation held steady at 2.8% YoY in December.
Dow Jones news
Almost the entire Dow Jones equity board fell into the red on Friday, with a few tech giants managing to hold onto thin gains for the day. Amazon (AMZN) held 1.6% above Friday’s opening bids near $240 per share, followed by Cisco Systems (CSCO), which gained 0.4% on the day to cross $60 per share.
Chevron (CVX) fell to the bottom of the Dow Jones, sinking 4.5% and falling below $150 per share. US energy companies are largely exposed to possible trade tariffs that may include Canadian Crude Oil sources. Chevron also reported a miss in its earnings per share in its pre-market earnings update, citing lower margins on refined products.
Dow Jones price action
The Dow Jones’ bearish price action on Friday sent bids back below 44,800, crimping chances for a bullish recapture of record highs above 45,000. The major equity index is now testing back into the 44,600 region, and the DJIA’s recent bull run appears to be evaporating.
Dow Jones daily chart

Dow Jones FAQs
The Dow Jones Industrial Average, one of the oldest stock market indices in the world, is compiled of the 30 most traded stocks in the US. The index is price-weighted rather than weighted by capitalization. It is calculated by summing the prices of the constituent stocks and dividing them by a factor, currently 0.152. The index was founded by Charles Dow, who also founded the Wall Street Journal. In later years it has been criticized for not being broadly representative enough because it only tracks 30 conglomerates, unlike broader indices such as the S&P 500.
Many different factors drive the Dow Jones Industrial Average (DJIA). The aggregate performance of the component companies revealed in quarterly company earnings reports is the main one. US and global macroeconomic data also contributes as it impacts on investor sentiment. The level of interest rates, set by the Federal Reserve (Fed), also influences the DJIA as it affects the cost of credit, on which many corporations are heavily reliant. Therefore, inflation can be a major driver as well as other metrics which impact the Fed decisions.
Dow Theory is a method for identifying the primary trend of the stock market developed by Charles Dow. A key step is to compare the direction of the Dow Jones Industrial Average (DJIA) and the Dow Jones Transportation Average (DJTA) and only follow trends where both are moving in the same direction. Volume is a confirmatory criteria. The theory uses elements of peak and trough analysis. Dow’s theory posits three trend phases: accumulation, when smart money starts buying or selling; public participation, when the wider public joins in; and distribution, when the smart money exits.
There are a number of ways to trade the DJIA. One is to use ETFs which allow investors to trade the DJIA as a single security, rather than having to buy shares in all 30 constituent companies. A leading example is the SPDR Dow Jones Industrial Average ETF (DIA). DJIA futures contracts enable traders to speculate on the future value of the index and Options provide the right, but not the obligation, to buy or sell the index at a predetermined price in the future. Mutual funds enable investors to buy a share of a diversified portfolio of DJIA stocks thus providing exposure to the overall index.
-
19:44
White House: Earlier reports are wrong, tariffs are coming February 1
United States (US) Press Secretary Karoline Leavitt dashed investor hopes for a delay in tariffs on Friday, announcing from the White House's press podium that President Donald Trump's wide tariffs of 25% on Canada and Mexico, as well as 10% on China, would be taking effect on February 1. The announcement shattered earlier reports that the Trump administration would be pushing tariff implementation out to March.
Key highlights
Press Sec. Leavitt reiterates February 1st deadline for Canada and Mexico tariff.
Canada and Mexico tariff at 25% and China at 10%.
Tariffs will be up for public consumption on Saturday.
There is no update on exemptions.
Trump reviewing details of tariff plans, which may allow some exemptions but they will be few and far between.
White House: We're not seeing start of trade war with Canada.
Canada and Mexico tariffs are over flow of fentanyl.
Trump has not made up mind on tariff timeline for the EU.
-
19:30
US Dollar consolidates ahead of possible weekend tariffs
- The Dollar Index gains traction, hitting a fresh weekly high above 108.00 as market sentiment deteriorates.
- US Durable Goods Orders disappointed, declining by 2.2% in December, missing expectations for a 0.8% increase.
- Treasury Secretary Scott Bessent proposed gradual tariffs, but Trump pushed for higher, uniform rates, spooking investors.
- Consumer Confidence in January fell to 104.1 from December's 109.5, reflecting growing concerns over the economic outlook.
The US Dollar Index (DXY), which measures the value of the US Dollar against a basket of currencies, extended its gains on Tuesday, consolidating above the psychological 108.00 level. Market sentiment soured after renewed concerns over tariffs and weak US economic data, including lower-than-expected Durable Goods Orders and declining Consumer Confidence. Despite these headwinds, the DXY managed to hold above its recent lows, signaling some resilience.
Daily digest market movers: US Dollar gains despite weak economic data
- Treasury Secretary Scott Bessent proposed incremental tariffs on all US imports, starting at 2.5%, triggering risk aversion in markets.
- President Trump countered Bessent’s suggestion, demanding significantly higher tariffs, further unsettling global financial markets.
- The Conference Board's Consumer Confidence Index fell to 104.1 in January from 109.5 in December, indicating weaker sentiment.
- Durable Goods Orders decreased by 2.2% in December, led by a 7.4% drop in transportation equipment, marking another economic setback.
- Excluding transportation, new orders rose modestly by 0.3%, offering limited optimism amidst broader declines.
- Concerns over overvalued AI shares contributed to a cautious market mood, limiting risk appetite and favoring the US Dollar.
- Investors now flick their eyes to Wednesday’s Federal Reserve decision, where a hold is already priced in.
DXY technical outlook: Resilience above 108.00, correction risks linger
The Dollar Index showed resilience by reclaiming levels above 108.00, bolstered by renewed safe-haven demand. Technical indicators, however, paint a mixed picture. While the RSI remains below 50, hinting at weak momentum, the MACD shows growing flat bars, signaling sustained bearish pressure.
On the bright side, an upward correction could extend if the downward movement becomes overstretched. Immediate resistance lies at 108.50, while a failure to maintain 108.00 could see the DXY index revisiting support near 107.50.
Tariffs FAQs
Tariffs are customs duties levied on certain merchandise imports or a category of products. Tariffs are designed to help local producers and manufacturers be more competitive in the market by providing a price advantage over similar goods that can be imported. Tariffs are widely used as tools of protectionism, along with trade barriers and import quotas.
Although tariffs and taxes both generate government revenue to fund public goods and services, they have several distinctions. Tariffs are prepaid at the port of entry, while taxes are paid at the time of purchase. Taxes are imposed on individual taxpayers and businesses, while tariffs are paid by importers.
There are two schools of thought among economists regarding the usage of tariffs. While some argue that tariffs are necessary to protect domestic industries and address trade imbalances, others see them as a harmful tool that could potentially drive prices higher over the long term and lead to a damaging trade war by encouraging tit-for-tat tariffs.
During the run-up to the presidential election in November 2024, Donald Trump made it clear that he intends to use tariffs to support the US economy and American producers. In 2024, Mexico, China and Canada accounted for 42% of total US imports. In this period, Mexico stood out as the top exporter with $466.6 billion, according to the US Census Bureau. Hence, Trump wants to focus on these three nations when imposing tariffs. He also plans to use the revenue generated through tariffs to lower personal income taxes.
-
19:24
Mexican Peso rallies as Trump softens tariffs threats
- Mexican Peso gains 0.35%, recovering after Trump's threat of a 25% tariff rattles markets.
- Trump is expected to delay tariffs implementation to March 1, hints at potential exemptions for certain imports.
- Mixed US economic indicators and Fed commentary maintain cautious market sentiment.
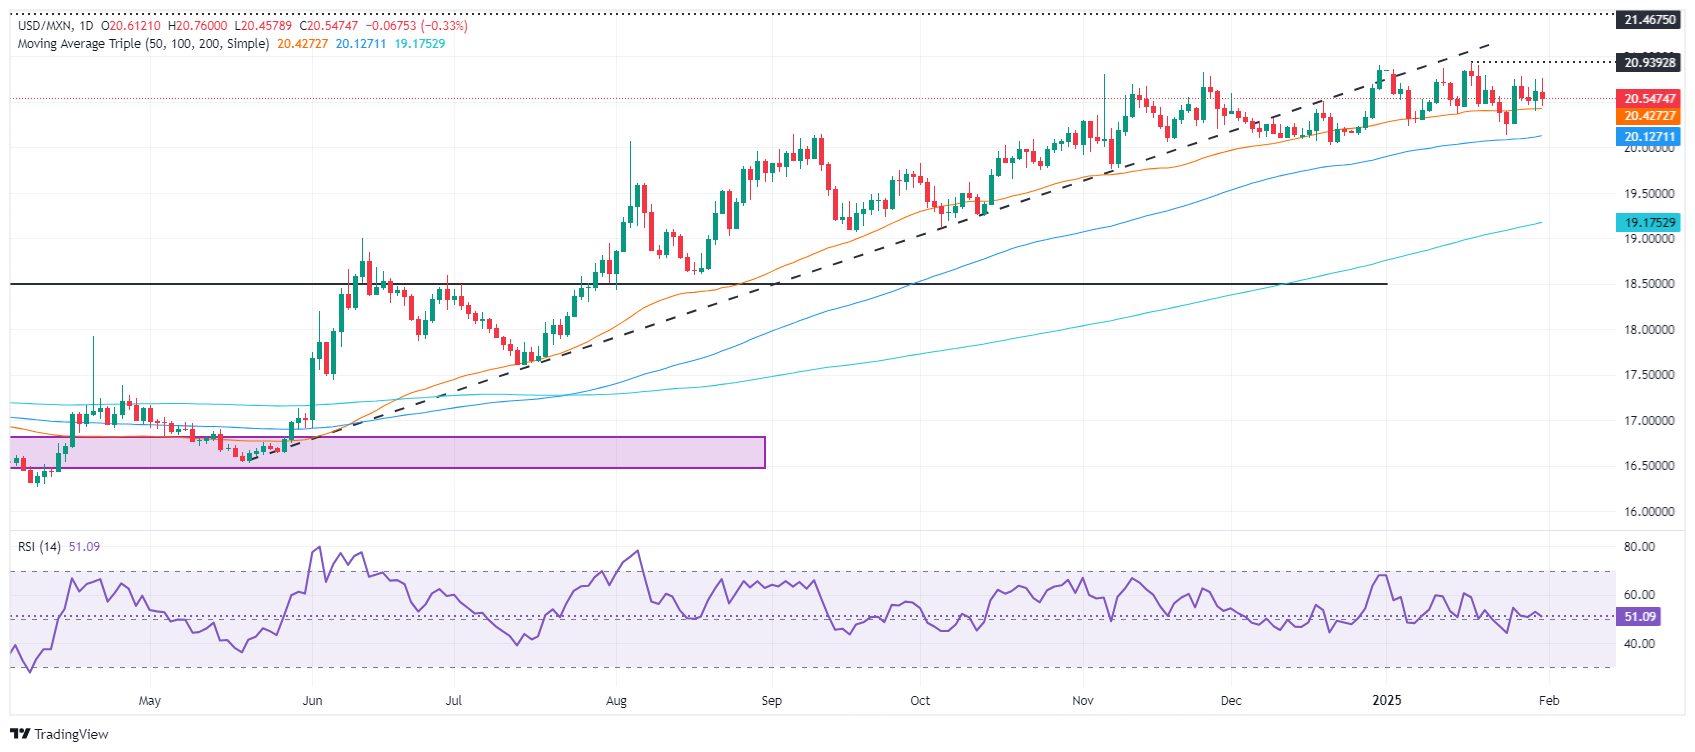
The Mexican Peso (MXN) recovered some ground against the US Dollar (USD), rising 0.35% on Friday after posting losses of more than 1% on Thursday on United States (US) President Donald Trump's tariffs rhetoric. At the time of writing, the USD/MXN trades at 20.60 after hitting a daily high of 20.74.
Lately, the main driver of the USD/MXN pair has been US President Trump. On Thursday, he said that 25% tariffs imposed on Mexico would commence on February 1, adding that his decision is justified by the Mexican government's failure to fight drug cartels fentanyl traffic to the US and that his country subsidizes Mexico as the trade deficit grows.
After those remarks, the USD/MXN jumped from around 20.49 to a two-day peak of 20.79 as the market digested Trump's comments. However, Reuters revealed on Friday that Trump has backpedaled as sources said the US would apply new tariffs on Mexico and Canada on March 1. According to Reuters, the White House will announce a process for countries to seek exemptions for certain imports.
Aside from this, the latest US inflation report and the Federal Reserve’s (Fed) preferred inflation gauge, the Core Personal Consumption Expenditures (PCE) Price Index, increased in December as expected, exceeding November’s reading. In the twelve months to December, Core PCE remained unchanged compared to the latest figures.
The data comes after the US GDP report for the last quarter was weaker than expected and following the Fed’s last monetary policy meeting.
Of note, the Fed parade has begun, as Governor Michelle Bowman and Chicago’s Fed President Austan Goolsbee crossed the newswires.
Daily digest market movers: Mexican Peso boosted by Reuters sources article on US tariffs on Mexico
- A Reuters exclusive report revealed that US President Trump is expected to announce new tariffs against Canada and Mexico that will begin March 1.
- “The sources, who asked not to be named because they are not authorized to speak publicly on the matter, said they did not have details on a final tariff rate, but noted Trump has consistently said that he plans to impose a 25% tariff on imports from the two countries on Saturday,” said the Reuters report.
- JP Morgan revealed via Reuters that the Mexican Peso could depreciate 11.8% if the US imposes 25% tariffs on Saturday. The US bank said that the “base case” is for tariffs to be postponed.
- The US Core PCE rose by 2.8% YoY in December as expected. Monthly, the underlying inflation rose 0.2%, up from 0.1%
- Fed Governor Michelle Bowman remained hawkish and supported the US Dollar after saying that inflation risks are tilted to the upside. Although she doesn’t disregard rate cuts, they would be data-dependent and might be gradual.
- Chicago’s Fed President Austan Goolsbee added that he liked December’s inflation report and is comfortable that inflation is on the path to the 2% target.
- Money market futures expect the Fed to cut interest rates by 50 bps in 2025, with traders expecting the first move in June.
Technical outlook: Mexican Peso appreciates but clashes with support at 20.50
USD/MXN uptrend is intact despite the ongoing pullback following Reuters source's tariffs news on Mexico. The exotic pair dupped to 20.45 shy of challenging the 50-day Simple Moving Average (SMA) of 20.40 but jumped a sign that sellers were outnumbered by buyers, opening the door to reclaim 20.50.
On further strength, the USD/MXN's next resistance would be the January 28 swing high of 20.77. If that level is taken out, the next resistance would be 21.00, followed by the March 8, 2022, high at 21.46. Conversely, if the exotic pair tumbles below the 50-day SMA, further downside is seen at the 100-day SMA at 20.08, before the 20.00 figure.
Mexican Peso FAQs
The Mexican Peso (MXN) is the most traded currency among its Latin American peers. Its value is broadly determined by the performance of the Mexican economy, the country’s central bank’s policy, the amount of foreign investment in the country and even the levels of remittances sent by Mexicans who live abroad, particularly in the United States. Geopolitical trends can also move MXN: for example, the process of nearshoring – or the decision by some firms to relocate manufacturing capacity and supply chains closer to their home countries – is also seen as a catalyst for the Mexican currency as the country is considered a key manufacturing hub in the American continent. Another catalyst for MXN is Oil prices as Mexico is a key exporter of the commodity.
The main objective of Mexico’s central bank, also known as Banxico, is to maintain inflation at low and stable levels (at or close to its target of 3%, the midpoint in a tolerance band of between 2% and 4%). To this end, the bank sets an appropriate level of interest rates. When inflation is too high, Banxico will attempt to tame it by raising interest rates, making it more expensive for households and businesses to borrow money, thus cooling demand and the overall economy. Higher interest rates are generally positive for the Mexican Peso (MXN) as they lead to higher yields, making the country a more attractive place for investors. On the contrary, lower interest rates tend to weaken MXN.
Macroeconomic data releases are key to assess the state of the economy and can have an impact on the Mexican Peso (MXN) valuation. A strong Mexican economy, based on high economic growth, low unemployment and high confidence is good for MXN. Not only does it attract more foreign investment but it may encourage the Bank of Mexico (Banxico) to increase interest rates, particularly if this strength comes together with elevated inflation. However, if economic data is weak, MXN is likely to depreciate.
As an emerging-market currency, the Mexican Peso (MXN) tends to strive during risk-on periods, or when investors perceive that broader market risks are low and thus are eager to engage with investments that carry a higher risk. Conversely, MXN tends to weaken at times of market turbulence or economic uncertainty as investors tend to sell higher-risk assets and flee to the more-stable safe havens.
-
19:01
Canadian Dollar recovers ground after quick dip to fresh multi-year lows
- The Canadian Dollar recovered 0.65% against the Greenback on Friday.
- Little of note from Canada to wrap up the week as US Dollar flows dominate.
- Market sentiment lurched higher after Trump kicks the tariff can down the road.
The Canadian Dollar (CAD) is recovering ground on Friday, climbing over six-tenths of one percent against the Greenback. The Loonie briefly tumbled to a fresh five-year low against the US Dollar during the overnight session after US President Donald Trump went on a new social media escapade promising a stiff package of tariffs against both Canada and Mexico. A last-minute pivot by the White House that incoming tariffs now may not happen until March has sent market sentiment back into the high side, giving the CAD room to breathe and recover some lost footing.
US Personal Consumption Expenditures Price Index (PCEPI) inflation figures came in exactly as expected on Friday. Canadian Gross Domestic Product (GDP) growth missed the mark, showing a steeper-than-expected contraction in November, but the back-dated data print had little measurable impact on Loonie flows.
Daily digest market movers: Canadian Dollar rebounds on broad Greenback weakness
- The Canadian Dollar has knocked back into its ongoing consolidation range after testing fresh multi-year lows, gaining 0.65% on Friday. The USD/CAD pair briefly tested 1.4600 before slumping back below 1.4400 once again.
- President Donald Trump’s latest iteration of his own tariff package threats now suggests that tariffs won’t begin until March 1, kicking the can down the road on tariffs that markets initially expected to begin this weekend.
- The last-minute pivot on President Trump’s tariffs threats are being scooped up by markets, sending sentiment higher. Some market insiders, such as analysts at JPMorgan, now expect tariffs not to happen at all unless something significantly changes.
- US PCEPI inflation clocked in exactly as expected on Friday, with December’s MoM figure ticking up to 0.2% from 0.1%, and the annualized figure holding steady at 2.8%.
- Canadian November GDP printed below expectations at -0.2%, falling below the -0.1% forecast and tumbling back from the previous month’s 0.3%.
Canadian Dollar price forecast
The Canadian Dollar’s back-and-forth action against the Greenback has increased volatility in USD/CAD charts, but momentum is still limited as underlying drivers remain unchanged. USD/CAD rose to within touch range of the 1.4600 handle late Thursday, before easing back and backsliding into congestion near the 1.4400 handle. The pair is now poised to resume chugging along in familiar consolidation territory, and Loonie bulls are running out of time to spark a fresh bid behind the Canadian Dollar and push USD/CAD back down below the 50-day Exponential Moving Average (EMA) at 1.4280.
USD/CAD daily chart

Canadian Dollar FAQs
The key factors driving the Canadian Dollar (CAD) are the level of interest rates set by the Bank of Canada (BoC), the price of Oil, Canada’s largest export, the health of its economy, inflation and the Trade Balance, which is the difference between the value of Canada’s exports versus its imports. Other factors include market sentiment – whether investors are taking on more risky assets (risk-on) or seeking safe-havens (risk-off) – with risk-on being CAD-positive. As its largest trading partner, the health of the US economy is also a key factor influencing the Canadian Dollar.
The Bank of Canada (BoC) has a significant influence on the Canadian Dollar by setting the level of interest rates that banks can lend to one another. This influences the level of interest rates for everyone. The main goal of the BoC is to maintain inflation at 1-3% by adjusting interest rates up or down. Relatively higher interest rates tend to be positive for the CAD. The Bank of Canada can also use quantitative easing and tightening to influence credit conditions, with the former CAD-negative and the latter CAD-positive.
The price of Oil is a key factor impacting the value of the Canadian Dollar. Petroleum is Canada’s biggest export, so Oil price tends to have an immediate impact on the CAD value. Generally, if Oil price rises CAD also goes up, as aggregate demand for the currency increases. The opposite is the case if the price of Oil falls. Higher Oil prices also tend to result in a greater likelihood of a positive Trade Balance, which is also supportive of the CAD.
While inflation had always traditionally been thought of as a negative factor for a currency since it lowers the value of money, the opposite has actually been the case in modern times with the relaxation of cross-border capital controls. Higher inflation tends to lead central banks to put up interest rates which attracts more capital inflows from global investors seeking a lucrative place to keep their money. This increases demand for the local currency, which in Canada’s case is the Canadian Dollar.
Macroeconomic data releases gauge the health of the economy and can have an impact on the Canadian Dollar. Indicators such as GDP, Manufacturing and Services PMIs, employment, and consumer sentiment surveys can all influence the direction of the CAD. A strong economy is good for the Canadian Dollar. Not only does it attract more foreign investment but it may encourage the Bank of Canada to put up interest rates, leading to a stronger currency. If economic data is weak, however, the CAD is likely to fall.
-
19:01
United States Baker Hughes US Oil Rig Count above forecasts (468): Actual (479)
-
17:17
AUD/USD edges higher despite tariff concerns
- Trump reiterates tariff threats on Mexico, Canada, and China.
- Fed maintains cautious stance on inflation risks, holding rates steady.
- AUD/USD hovers near 0.6215 amid RBA rate cut bets and China’s economic slowdown.
The AUD/USD pair trades slightly higher at 0.6215 in the Asian session on Friday but remains under pressure due to fresh tariff threats from US President Trump. Market participants continue to anticipate a dovish shift from the Reserve Bank of Australia (RBA) in February, adding to the Aussie’s downside risks.
Trade tensions weigh on sentiment
Trump reaffirmed plans to impose tariffs on Mexico, Canada, and China, fueling safe-haven demand for the US Dollar and claiming to plan to impose 100% tariffs on BRICS nations if they try to replace the US Dollar (USD) with a new currency in international trade. Trump posted on TruthSocial: “We are going to require a commitment from these seemingly hostile countries that they will neither create a new BRICS currency, nor back any other currency to replace the mighty US Dollar or, they will face 100% tariff,
On the data front, the US Core Personal Consumption Expenditures (PCE) Price Index rose 0.2% month-on-month as expected, while annual core PCE remained unchanged at 2.8%. Fed officials, including Governor Michelle Bowman, warned of lingering upside inflation risks, reinforcing expectations that rate cuts could be delayed.
In Australia, the latest data reinforced expectations that the RBA will pivot to policy easing. Q4 inflation figures came in lower than anticipated, with trimmed mean CPI easing to 3.2%, below the RBA’s previous forecast of 3.4%. Traders now fully price in a 25-basis-point rate cut at the February meeting.
Technical overview
AUD/USD remains range-bound, lacking strong directional momentum. The Relative Strength Index (RSI) is at 47, still in negative territory but recovering. The MACD histogram shows decreasing green bars, suggesting fading bullish momentum.
Immediate resistance is seen at 0.6230 at the the 20-day Simple Moving Average (SMA). On the downside, key support lies at 0.6200, with a break lower opening the door to further declines toward 0.6170. Until a decisive move occurs, the pair is likely to consolidate within the current range. -
16:22
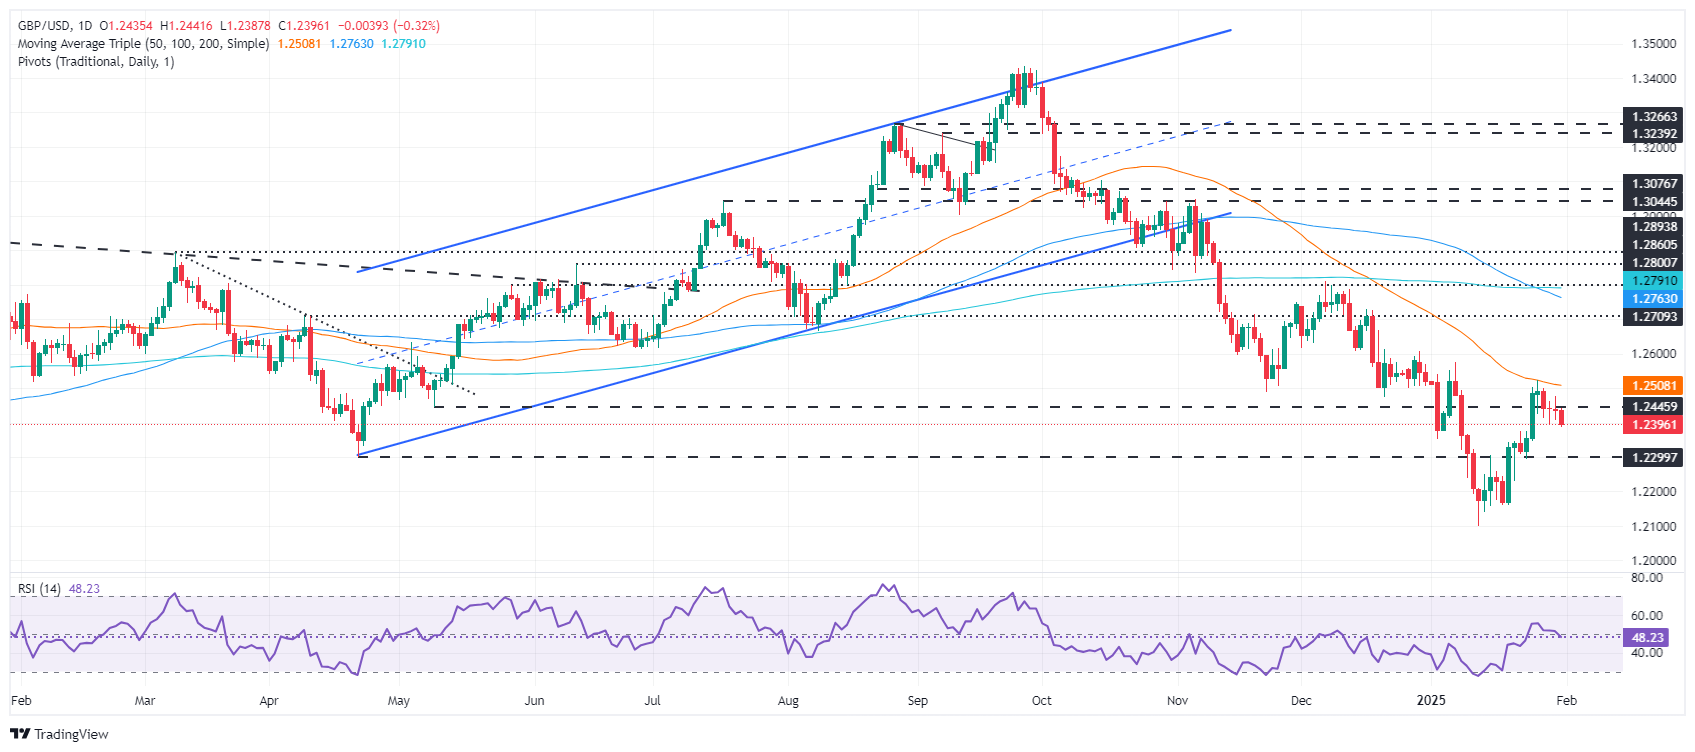
GBP/USD slumps as Trump’s tariff talk overpowers US PCE data
- GBP/USD falls 0.16% to 1.2398, continuing its decline as Trump threatens tariffs on Canada and Mexico.
- US inflation aligns with expectations, Core PCE Index rises 0.2% MoM; Fed's rhetoric supports dollar strength.
- US Dollar Index (DXY) climbs 0.20%, reflecting gains against major currencies, including the Pound.
The Pound Sterling extended its losses for the second consecutive day as US President Donald Trump tariffs rhetoric sent ripples across the financial markets. Therefore, the Greenback remains bid, as economic data takes the backseat. The GBP/USD trades at 1.2398, down 0.16%.
GBP/USD dips amid heightened US trade tension, persistent UK economic concerns.
On Thursday, Trump reiterated that he will impose tariffs on Mexico and Canada, which lent a lifeline to the US Dollar, which was posting losses before ending the day in the green. Most G10 Forex currencies, depreciated, including Sterling.
Worries about an economic slowdown in the UK kept the GBP pressured amid concerns on the budget presented by chancellor Rachel Reeves.
In the meantime, inflation in the United States (USD) rose in December. The Core Personal Consumption Expenditures (PCE) Price Index, the Federal Reserve’s (Fed) preferred inflation gauge increased by 0.2% MoM as expected, up from November 0.1%. On an annual basis, the underlying PCE remained unchanged at 2.8% as projected.
Fed speakers are also providing some support for the US Dollar, as Governor Michelle Bowman said that inflation risks are tilted to the upside. At the time of writing, Chicago’s Fed President Austan Goolsbee added that he liked December’s inflation report, stating that he’s comfortable that inflation is on the path to 2% target.
The data maintained the “status quo.” US equities continued to trend higher, and the buck gained some traction, as the GBP/USD dropped from around 1.2430 to 1.2408.
The US Dollar Index (DXY), which tracks the buck’s value against a basket of six currencies, is rising 0.20% up at 108.41. The US 10-year Treasury bond yield drops one and a half basis points to 4.50%, after the data.
GBP/USD Price Forecast: Technical outlook
Given the backdrop, the GBP/USD bias remains downwards. Following the pair’s clash at the 50-day Simple Moving Average (SMA) near 1.2500, it has trended lower, extending its fall beneath 1.2400. If Sterling weakens further, the next support would be intermediate support at January’s 23 low of 1.2292, before challenging January 17 swing low of 1.2159.
British Pound PRICE Today
The table below shows the percentage change of British Pound (GBP) against listed major currencies today. British Pound was the strongest against the Euro.
USD EUR GBP JPY CAD AUD NZD CHF USD 0.39% 0.29% 0.25% 0.19% -0.11% -0.11% 0.02% EUR -0.39% -0.10% -0.16% -0.20% -0.49% -0.50% -0.36% GBP -0.29% 0.10% -0.08% -0.09% -0.39% -0.39% -0.26% JPY -0.25% 0.16% 0.08% -0.04% -0.33% -0.34% -0.20% CAD -0.19% 0.20% 0.09% 0.04% -0.31% -0.30% -0.16% AUD 0.11% 0.49% 0.39% 0.33% 0.31% -0.01% 0.14% NZD 0.11% 0.50% 0.39% 0.34% 0.30% 0.00% 0.14% CHF -0.02% 0.36% 0.26% 0.20% 0.16% -0.14% -0.14% The heat map shows percentage changes of major currencies against each other. The base currency is picked from the left column, while the quote currency is picked from the top row. For example, if you pick the British Pound from the left column and move along the horizontal line to the US Dollar, the percentage change displayed in the box will represent GBP (base)/USD (quote).
-
16:18
Fed's Goolsbee: Policy uncertainties might affect prices
In an interview with CNBC on Friday, Federal Reserve (Fed) Bank of Chicago President Austan Goolsbee said that he has comfort that they are on the path to 2% inflation, per Reuters.
Key takeaways
"Policy uncertainties might affect prices."
"With uncertainty should slow down as take rates toward neutral."
"We have multiple months of solid performance of inflation right around 2%."
"I still think rates will be lower 12-18 months from now."
"Job market looks settled in around full employment."
"If policy uncertainty affects prices, it affects the Fed."
"A one-time increase in tariffs in theory is transitory, policy response may not be needed."
"Underlying economy on excellent path."
"I have no problem slowing pace of cutting, feeling our way toward neutral rates."
Market reaction
The US Dollar Index clings to small daily gains and was last seen rising 0.15% on the day at 108.35.
-
16:05
Colombia National Jobless Rate increased to 9.1% in December from previous 8.2%
-
15:54
CTA selling activity in crude oil markets to run out of steam – TDS
In most scenarios for price action, we expect that CTA selling activity in **crude oil** markets will run out of steam, TDS' Senior Commodity Strategist Daniel Ghali notes.
Flat or bullish trading can lead to significant CTA buying activity
"Barring a big downtape next week, CTAs will refrain from selling either WTI crude or Brent crude markets, whereas a flat tape or uptape can lead to significant CTA buying activity. While this set-up for flows is not extreme, it is already pointing to an asymmetry in algo trading behavior that will favour buying activity over selling activity next week."
-
15:48
Silver: Likelihood of outright spot purchases is rising by the day – TDS
Silver's breakout last session fueled strong price action (+3.5% close/close in SIH5) associated with several consecutive CTA buying programs that ultimately increased their net length by 70%, which is only equivalent to +13% of CTAs' max size given repeated whipsaws have diminished trend signals' strength, TDS' Senior Commodity Strategist Daniel Ghali notes.
XAU/XAG ratio remains at elevated level
"Nonetheless, we expect this strength in prices to attract subsequent discretionary trader interest, given this cohort remained nearly flat as of last week, with gold printing new all-time highs and the XAU/XAG ratio remaining at elevated levels. Interestingly, under the hood, the cross-section of the broad commodity complex continues to point to a resilient demand environment, with our real-time gauge of commodity demand expectations still not showing any notable sign of weakness."
"Historically, this has been associated with a strengthening in the relative value in silver to gold. Ultimately, CTAs will not sell silver in any scenario for prices other than a big downtape over the coming week, suggesting limited scope for the breakout to fail."
"Whether tariffs are announced this weekend or not, we expect continued pressure on the EFPs, which will ultimately continue to tighten London forwards and drain inventories towards levels that can challenge the market's structure. With lease rates remaining elevated, the likelihood of outright spot purchases may be rising by the day. With liquidity critically challenged, such purchases would have a non-linear impact on flat prices."
-
15:46
USD/CAD jumps to near 1.4550 as Donald Trump is poised to impose tariffs on Canada
- USD/CAD gains sharply to near 1.4550 as the USD refreshes weekly high on Trump’s tariff threats.
- The Canadian Dollar weakens as US Donald Trump is poised to impose 25% tariffs on Canada on February 1.
- The Fed has stated that it has frozen monetary policy adjustments until it sees some progress in inflation or weakness in the labor market.
The USD/CAD pair climbs to near 1.4550 in Friday’s North American session. The Loonie pair strengthens as investors continue to dump the Canadian Dollar (CAD) amid worries that United States (US) President Donald Trump is poised to slap hefty tariffs on Canada on February 1. Such a scenario will weaken the Canadian economic outlook, given that 75% of total exports from Canada are bought by the US.
On Thursday, Donald Trump reiterated his intensions of imposing 25% tariffs on Canada and Mexico. Trump had been accusing Canada and Mexico of allowing illegal immigrants and the deadly opioid fentanyl to enter the US economy.
On Wednesday, Bank of Canada (BoC) Governor Tiff Macklem said "A long-lasting and broad-based trade conflict would badly hurt economic activity in Canada." His comments came after the policy decision in which the central bank reduced its interest rates by 25 basis points (bps) to 3% to overcome deepening risks of inflation undershooting their target of 2%
Trump’s tariffs on Canada could result in a stagflation in the economy. Market experts view tariffs as inflationary for Canada as business owners would shift to lower operating capacity, which will result in higher layoffs. Lower productivity will also result in higher costs, which would boost price pressures. The scenario would be discomforting for the BoC.
Meanwhile, the US Dollar (USD) performs strongly as Trump’s tariff threats have improved its safe-haven appeal. The US Dollar Index (DXY), which tracks the Greenback’s value against six major currencies, posts a fresh weekly high near 108.40.
Market participants believe that Trump’s tariffs will be inflationary for the US economy, which will allow the Federal Reserve (Fed) to remain on standby. On Wednesday, Fed Chair Jerome Powell guided a cautious approach on interest rates, saying that monetary policy adjustments will become appropriate only when the committee will see “real progress on inflation or at least some weakness in the labor market”.
Canadian Dollar FAQs
The key factors driving the Canadian Dollar (CAD) are the level of interest rates set by the Bank of Canada (BoC), the price of Oil, Canada’s largest export, the health of its economy, inflation and the Trade Balance, which is the difference between the value of Canada’s exports versus its imports. Other factors include market sentiment – whether investors are taking on more risky assets (risk-on) or seeking safe-havens (risk-off) – with risk-on being CAD-positive. As its largest trading partner, the health of the US economy is also a key factor influencing the Canadian Dollar.
The Bank of Canada (BoC) has a significant influence on the Canadian Dollar by setting the level of interest rates that banks can lend to one another. This influences the level of interest rates for everyone. The main goal of the BoC is to maintain inflation at 1-3% by adjusting interest rates up or down. Relatively higher interest rates tend to be positive for the CAD. The Bank of Canada can also use quantitative easing and tightening to influence credit conditions, with the former CAD-negative and the latter CAD-positive.
The price of Oil is a key factor impacting the value of the Canadian Dollar. Petroleum is Canada’s biggest export, so Oil price tends to have an immediate impact on the CAD value. Generally, if Oil price rises CAD also goes up, as aggregate demand for the currency increases. The opposite is the case if the price of Oil falls. Higher Oil prices also tend to result in a greater likelihood of a positive Trade Balance, which is also supportive of the CAD.
While inflation had always traditionally been thought of as a negative factor for a currency since it lowers the value of money, the opposite has actually been the case in modern times with the relaxation of cross-border capital controls. Higher inflation tends to lead central banks to put up interest rates which attracts more capital inflows from global investors seeking a lucrative place to keep their money. This increases demand for the local currency, which in Canada’s case is the Canadian Dollar.
Macroeconomic data releases gauge the health of the economy and can have an impact on the Canadian Dollar. Indicators such as GDP, Manufacturing and Services PMIs, employment, and consumer sentiment surveys can all influence the direction of the CAD. A strong economy is good for the Canadian Dollar. Not only does it attract more foreign investment but it may encourage the Bank of Canada to put up interest rates, leading to a stronger currency. If economic data is weak, however, the CAD is likely to fall.
-
15:46
United States Chicago Purchasing Managers' Index registered at 39.5, below expectations (40) in January
-
15:00
Fed's Bowman: Future moves should that be cautious and gradual
Federal Reserve governor Michelle Bowman said on Friday that rate cuts are still expected this year but added that future moves should that be cautious and gradual, with time to assess data, per Reuters.
Key takeaways
"Inflation is still elevated with upside risk."
"Still expecting inflation to moderate but need data to confirm that before more rate cuts."
"Current policy is in a good place for Fed to monitor data, be clear on economic impact of Trump administration policies before moving rates again."
"Not clear monetary policy is exerting much pressure on economy, with easy financial conditions and high asset prices possibly slowing progress on inflation."
"Watching long-term treasury yields as possible sign markets are expecting tighter policy will be needed to control inflation."
"Labor market not especially tight but wage growth still inconsistent with 2% inflation target."
"First quarter data important to how quickly inflation will improve going forward."
"Fragility of supply chains, geopolitical tensions, release of pent-up demand post election, other factors could also feed inflation."
Market reaction
The US Dollar Index holds its ground following these comments and was last seen posting small daily gains at 108.26.
-
14:46
EUR/JPY surges to 161.00 after flash German inflation data
- EUR/JPY gains sharply after advanced German HICP rose in line with expectations in January.
- The ECB cut its Deposit Facility rate by 25 bps to 2.75% on Thursday.
- The Japanese Yen meets profit booking after outperforming in the past few trading sessions.
The EUR/JPY pair soars to near 161.00 in Friday’s North American session. The asset attracts buyers after the release of the flash German Harmonized Index of Consumer Prices (HICP) data for January.
The German inflation came in line with estimates. Month-on-month HICP deflated by 0.2%, as expected, after a 0.7% increase in December. On year, the HICP data rose in line with estimates and the former release of 2.8%. The German Consumer Price Index (CPI) rose at a slower pace of 2.3%, compared to estimates and the former release of 2.6%.
Soft German inflation validates market expectations that the European Central Bank (ECB) will cut interest rates three times more this year. On Thursday, the ECB reduced its Deposit Facility rate by 25 basis points (bps) to 2.75%, as officials were confident that inflationary pressures would sustainably return to the desired rate of 2% this year.
In the press conference after the policy decision, ECB President Christine Lagarde keeps door open for further policy easing. Lagarde said that we are still in “restrictive territory” and it is premature to “anticipate at what point where will stop”. However, she avoided providing a pre-defined interest rate cut path and reiterated that we decide meeting by meeting on the basis of data.
Meanwhile, the Japanese Yen (JPY) underperforms across the board as investors take some profit after its recent outperformance. The Yen has performed strongly in the past few trading days on the assumption that the Bank of Japan (BoJ) will hike interest rates further this year. Last week, the BoJ hiked its borrowing rates by 25 bps to 0.5% but didn’t provide a specified tight policy path.
Euro FAQs
The Euro is the currency for the 19 European Union countries that belong to the Eurozone. It is the second most heavily traded currency in the world behind the US Dollar. In 2022, it accounted for 31% of all foreign exchange transactions, with an average daily turnover of over $2.2 trillion a day. EUR/USD is the most heavily traded currency pair in the world, accounting for an estimated 30% off all transactions, followed by EUR/JPY (4%), EUR/GBP (3%) and EUR/AUD (2%).
The European Central Bank (ECB) in Frankfurt, Germany, is the reserve bank for the Eurozone. The ECB sets interest rates and manages monetary policy. The ECB’s primary mandate is to maintain price stability, which means either controlling inflation or stimulating growth. Its primary tool is the raising or lowering of interest rates. Relatively high interest rates – or the expectation of higher rates – will usually benefit the Euro and vice versa. The ECB Governing Council makes monetary policy decisions at meetings held eight times a year. Decisions are made by heads of the Eurozone national banks and six permanent members, including the President of the ECB, Christine Lagarde.
Eurozone inflation data, measured by the Harmonized Index of Consumer Prices (HICP), is an important econometric for the Euro. If inflation rises more than expected, especially if above the ECB’s 2% target, it obliges the ECB to raise interest rates to bring it back under control. Relatively high interest rates compared to its counterparts will usually benefit the Euro, as it makes the region more attractive as a place for global investors to park their money.
Data releases gauge the health of the economy and can impact on the Euro. Indicators such as GDP, Manufacturing and Services PMIs, employment, and consumer sentiment surveys can all influence the direction of the single currency. A strong economy is good for the Euro. Not only does it attract more foreign investment but it may encourage the ECB to put up interest rates, which will directly strengthen the Euro. Otherwise, if economic data is weak, the Euro is likely to fall. Economic data for the four largest economies in the euro area (Germany, France, Italy and Spain) are especially significant, as they account for 75% of the Eurozone’s economy.
Another significant data release for the Euro is the Trade Balance. This indicator measures the difference between what a country earns from its exports and what it spends on imports over a given period. If a country produces highly sought after exports then its currency will gain in value purely from the extra demand created from foreign buyers seeking to purchase these goods. Therefore, a positive net Trade Balance strengthens a currency and vice versa for a negative balance.
-
14:32
Breaking: US core PCE inflation holds steady at 2.8% in December as expected
Inflation in the US, as measured by the change in the Personal Consumption Expenditures (PCE) Price Index, edged higher to 2.6% on a yearly basis in December from 2.4% in November, the US Bureau of Economic Analysis (BEA) reported on Friday.
The core PCE Price Index, which excludes volatile food and energy prices, rose 2.8% in the same period, matching November's reading and the market expectation. The core PCE Price Index rose 0.2% on a monthly basis.
Market reaction to US PCE inflation data
The US Dollar Index edged slightly higher after this data and was last seen rising 0.07% on the day at 108.25.
US Dollar PRICE This week
The table below shows the percentage change of US Dollar (USD) against listed major currencies this week. US Dollar was the strongest against the Australian Dollar.
USD EUR GBP JPY CAD AUD NZD CHF USD 1.09% 0.53% -0.46% 0.80% 1.51% 1.06% 0.56% EUR -1.09% -0.48% -1.40% -0.15% 0.43% 0.09% -0.41% GBP -0.53% 0.48% -1.23% 0.33% 0.90% 0.59% 0.07% JPY 0.46% 1.40% 1.23% 1.31% 2.17% 1.77% 1.18% CAD -0.80% 0.15% -0.33% -1.31% 0.52% 0.26% -0.26% AUD -1.51% -0.43% -0.90% -2.17% -0.52% -0.29% -0.79% NZD -1.06% -0.09% -0.59% -1.77% -0.26% 0.29% -0.73% CHF -0.56% 0.41% -0.07% -1.18% 0.26% 0.79% 0.73% The heat map shows percentage changes of major currencies against each other. The base currency is picked from the left column, while the quote currency is picked from the top row. For example, if you pick the US Dollar from the left column and move along the horizontal line to the Japanese Yen, the percentage change displayed in the box will represent USD (base)/JPY (quote).
Inflation FAQs
Inflation measures the rise in the price of a representative basket of goods and services. Headline inflation is usually expressed as a percentage change on a month-on-month (MoM) and year-on-year (YoY) basis. Core inflation excludes more volatile elements such as food and fuel which can fluctuate because of geopolitical and seasonal factors. Core inflation is the figure economists focus on and is the level targeted by central banks, which are mandated to keep inflation at a manageable level, usually around 2%.
The Consumer Price Index (CPI) measures the change in prices of a basket of goods and services over a period of time. It is usually expressed as a percentage change on a month-on-month (MoM) and year-on-year (YoY) basis. Core CPI is the figure targeted by central banks as it excludes volatile food and fuel inputs. When Core CPI rises above 2% it usually results in higher interest rates and vice versa when it falls below 2%. Since higher interest rates are positive for a currency, higher inflation usually results in a stronger currency. The opposite is true when inflation falls.
Although it may seem counter-intuitive, high inflation in a country pushes up the value of its currency and vice versa for lower inflation. This is because the central bank will normally raise interest rates to combat the higher inflation, which attract more global capital inflows from investors looking for a lucrative place to park their money.
Formerly, Gold was the asset investors turned to in times of high inflation because it preserved its value, and whilst investors will often still buy Gold for its safe-haven properties in times of extreme market turmoil, this is not the case most of the time. This is because when inflation is high, central banks will put up interest rates to combat it. Higher interest rates are negative for Gold because they increase the opportunity-cost of holding Gold vis-a-vis an interest-bearing asset or placing the money in a cash deposit account. On the flipside, lower inflation tends to be positive for Gold as it brings interest rates down, making the bright metal a more viable investment alternative.
-
14:30
Canada Gross Domestic Product (MoM) registered at -0.2%, below expectations (-0.1%) in November
-
14:30
United States Personal Income (MoM) in line with forecasts (0.4%) in December
-
14:30
United States Personal Consumption Expenditures - Price Index (YoY) meets forecasts (2.6%) in December
-
14:30
United States Core Personal Consumption Expenditures - Price Index (MoM) meets forecasts (0.2%) in December
-
14:30
United States Core Personal Consumption Expenditures - Price Index (YoY) meets forecasts (2.8%) in December
-
14:30
United States Personal Spending came in at 0.7%, above expectations (0.5%) in December
-
14:30
United States Personal Consumption Expenditures - Price Index (MoM) in line with forecasts (0.3%) in December
-
14:30
United States Employment Cost Index in line with expectations (0.9%) in 4Q
-
14:19
GBP/USD support noted around 1.2390/95 – Scotiabank
The Pound Sterling (GBP) is little changed on the session after dropping back against the USD in late trade yesterday, Scotiabank's Chief FX Strategist Shaun Osborne notes.
GBP little changed on the day
"UK data showed a smaller than expected, 0.1% rise in UK house prices in the Nationwide’s survey for January. Prices are up 4.1% in the year, down from December’s 4.7% clip."
"Spot is a little softer on the session but GBP losses are holding a little above the mid-week low (where a bullish 'hammer' pattern formed) at 1.2393. Cable should find support around 1.2390/95 today but it may be hard to resist a broader strengthening in the USD in the coming days."
"A deeper retracement of the mid-January rebound to test the 1.23 are looks a risk. Resistance is 1.2460/70."
-
14:16
EUR softer as spreads widen – Scotiabank
The ECB cut its policy rate 25bps Thursday, as expected, Scotiabank's Chief FX Strategist Shaun Osborne notes.
EUR is trading softer following this week’s central bank policy moves
"Another cut in March is expected, at which point the ECB may drop its reference to policy being 'restrictive', suggesting policymakers feel rates are nearing neutral. Swaps anticipate further easing over the coming year to take the policy rate back to 2%. Eurozone/US short-term spreads have nudged a little wider since the FOMC Wednesday, leaving the 2Y spread at –207bps today and weighing on the EUR."
"Spot is down for a fourth day in a row and trading below the 40-day MA (1.0393) which had provided some support for the EUR earlier in the week. More corrective losses for the EUR seem likely after spot’s top/reversal at 1.0535 at the start of the week. Support is 1.0360 and 1.0315."
-
14:13
CAD slips, but steadies on tariff news – Scotiabank
The Canadian Dollar (CAD) slid briefly in response to yesterday’s tariff headlines, making a new cycle low against the USD near 1.46 before recovering slightly. The CAD is little changed on the session so far today, Scotiabank's Chief FX Strategist Shaun Osborne notes, Scotiabank's Chief FX Strategist Shaun Osborne notes.
Markets await developments
"Every piece of analysis that I have seen in the past few weeks (Scotia’s included) has assumed that 25% tariffs on Canada would be deadly for the CAD, potentially driving spot to the 1.60/1.70 area. The fact that the markets are trading so calmly suggests that investors feel that tariffs won’t actually be applied or, if they are, they will not be applied for very long. CAD 1-week vol continues to climb, reaching 12.7% but that implies markets anticipate only about 100 pips of movement in spot either way next week."
"It’s close to freezing in upstate NY over the coming week and colder in Minnesota which will make it uncomfortable if Ontario turns off electricity exports this weekend, as Premier Ford suggested Ontario could do, as retaliation for tariffs. Canadian industry-level GDP is expected to fall 0.1% in the November month—in line with the flash estimate released with the October data."
"A new high for the USD yesterday just under 1.46 disrupts the USD-negative technical developments I have noted on the daily and weekly charts recently. The USD advance was very brief and spot quickly settled back into its former range. On the technical face of it, the USD’s advance to a new high tilts risks back to a further rise and test of 1.47. Support is 1.4400/10 and 1.4360."
-
14:10
USD gains on Trump tariff threat – Scotiabank
Markets remain quite subdued despite President Trump indicating late yesterday that 25% tariffs on Canada and Mexico will be announced this weekend, Scotiabank's Chief FX Strategist Shaun Osborne notes.
Markets remain calm overall
"The CAD wobbled but quickly steadied, ditto for the MXN. The USD is a little higher overall today but stocks are positive and bonds are mostly firmer. Treasurys are underperforming modestly. It’s all pretty calm in the face of the potential cataclysm that most hoped would be avoided."
"Universal and aggressive tariffs on Mexican and Canadian products will be enormously disruptive the domestic economies but will also raise prices for US consumers and be particularly damaging for the US auto and food industries. The calm market reaction suggests investors feel that tariffs are leverage and will not be sustained. There are also reports suggesting that Trump’s advisors are looking for a lastminute off-ramp to avoid tariffs. Trading may be light into the weekend as investors await developments."
"If tariffs are imposed, the USD will strengthen broadly early next week. If there is a stay, the tariff bark will have sounded worse than its bite—can President Trump afford that?—and the USD is likely to drop back. US data reports this morning include the Q4 Employment Cost Index and Personal Income/Spending and PCE/core PCE data. Headline PCE may accelerate a little in December and while core trends are expected to remain steady at 2.8% Y/Y, reflecting the “sticky” nature of underlying trends in the core measure in recent months."
-
14:04
Germany annual CPI inflation softens to 2.3% in January vs. 2.6% expected
- Annual inflation in Germany softened unexpectedly in January.
- EUR/USD continues to trade in a tight range at around 1.0400.
Inflation in Germany, as measured by the change in the Consumer Price Index (CPI), softened to 2.3% on a yearly basis in January from 2.6% in December, Destatis' flash estimate showed on Friday. This reading came in above the market expectation of 2.6%.
On a monthly basis, the CPI declined by 0.2% after rising 0.1% in December.
The Harmonized Index of Consumer Prices in Germany, the European Central Bank's preferred gauge of inflation, increased 2.8% on a yearly basis, matching December's increase and the market consensus.
Market reaction
EUR/USD showed no immediate reaction to this report and was last seen trading marginally lower on the day at 1.0385.
-
14:00
Germany Consumer Price Index (YoY) below forecasts (2.6%) in January: Actual (2.3%)
-
14:00
Germany Harmonized Index of Consumer Prices (MoM) meets forecasts (-0.2%) in January
-
14:00
Germany Harmonized Index of Consumer Prices (YoY) meets expectations (2.8%) in January
-
14:00
Germany Consumer Price Index (MoM) below forecasts (0.1%) in January: Actual (-0.2%)
-
13:49
US Dollar adds to gains with tariff talk and PCE as main drivers
- The US Dollar outperforms against most major peers on Friday ahead of the US PCE data release.
- US President Trump has announced 25% tariffs on Mexico and Canada as of Saturday.
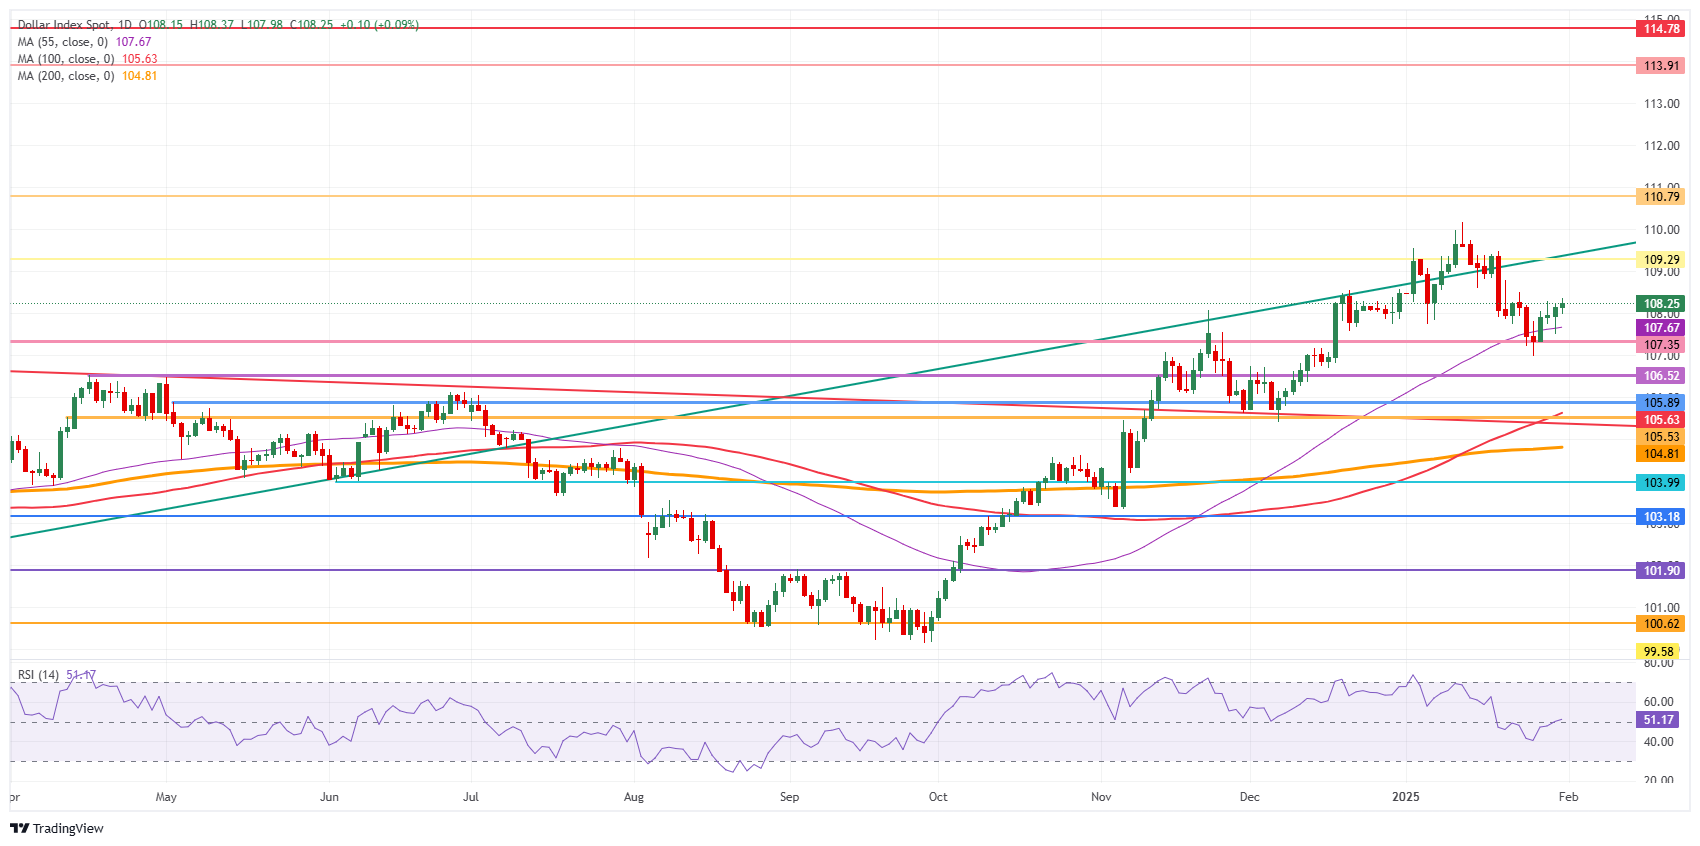
- The US Dollar Index (DXY) moves away from 108.00 and hits a fresh weekly high at 108.37.
The US Dollar Index (DXY), which tracks the performance of the US Dollar against six major currencies, currently trades at 108.25 at the time of writing and is receiving quite a few tailwinds this Friday. The first one comes from US President Donald Trump, who announced a first wave of tariffs on Mexico and Canada. The Trump administration will impose 25% tariffs on about $900 billion in goods from both Canada and Mexico, Bloomberg reports. The US President also threatened to impose 100% tariffs on BRICS nations if they try to replace the US Dollar with a new currency in international trade.
Meanwhile, the economic data calendar is helping the Greenback as well. In Europe, inflation data from Germany came in substantially lower than expected. This boosts the interest rate cut expectations for the European Central Bank (ECB) this year and widens the differential between the US and the Eurozone. In the US, the Fed’s preferred inflation gauge, the Personal Consumption Expenditures numbers, will be released later in the day.
Daily digest market movers: Finally some inflation data
- Asian markets remain quiet this week due to the Lunar New Year, which started on Tuesday, with Chinese traders returning to the markets on February 5.
- Volatility and nervousness are expected at the opening trade on Monday if US President Trump finally unleashes 25% tariffs on Canada and Mexico.
- Trump reiterated on Thursday his threat of imposing 100% tariffs on BRICS nations if they try to replace the US Dollar (USD) with a new currency in international trade. Trump posted on TruthSocial: “We are going to require a commitment from these seemingly hostile countries that they will neither create a new BRICS currency, nor back any other currency to replace the mighty US Dollar or, they will face 100% tariff,” and continued “there is no chance that BRICS will replace the US Dollar in international trade, or anywhere else, and any country that tries should say hello to tariffs, and goodbye to America!”
- At 13:30 GMT, US Personal Consumption Expenditures (PCE) Price Index data for December is due:
- Monthly headline PCE is expected to tick up 0.2% from 0.1% in November.
- Monthly core PCE is expected to jump 0.3% from 0.1% the previous month.
- At 14:45 GMT, the Chicago Purchasing Managers’ Index for January is due. The expectation is for an uptick to 40 from 36.9 in the prior reading, still in contraction.
- Equities are adding to gains, mostly based on the bigger interest rate cut prospects from the ECB after lower German inflation data was released earlier this Friday.
- The CME FedWatch tool projects an 82.0% chance for no change in the Fed’s policy rate for its next meeting on March 19.
- The US 10-year yield is trading around 4.524%, bouncing higher after hitting a fresh January low at 4.484% on XXX.
US Dollar Index Technical Analysis: Headline-filled weekend
The US Dollar Index (DXY) will face a shaky weekend while markets remain closed for business until Monday morning in Asia. With tariffs imposed on Canada and Mexico as earliest as Saturday, traders will be unable to move positions until Asian markets open, which means volatility is set to surge. Once the European session kicks in,the dust will start to settle on whichever event takes place over the weekend, with the DXY expected to remain caught between 107.30 to the downside and 109.30 on the upside.
Once 108.00 level has been acquired, the next level to pare back earlier losses is 109.30 (July 14, 2022, high and rising trendline). Further up, the next upside level to hit before advancing further remains at 110.79 (September 7, 2022, high).
On the downside, the 55-day Simple Moving Average (SMA) at 107.67 and the October 3, 2023, high at 107.35 acts as a double support to the DXY price. For now, that looks to be holding, though the Relative Strength Index (RSI) still has some room for the downside. Hence, rather look for 106.52 or even 105.89 as better levels.
US Dollar Index: Daily Chart
US-China Trade War FAQs
Generally speaking, a trade war is an economic conflict between two or more countries due to extreme protectionism on one end. It implies the creation of trade barriers, such as tariffs, which result in counter-barriers, escalating import costs, and hence the cost of living.
An economic conflict between the United States (US) and China began early in 2018, when President Donald Trump set trade barriers on China, claiming unfair commercial practices and intellectual property theft from the Asian giant. China took retaliatory action, imposing tariffs on multiple US goods, such as automobiles and soybeans. Tensions escalated until the two countries signed the US-China Phase One trade deal in January 2020. The agreement required structural reforms and other changes to China’s economic and trade regime and pretended to restore stability and trust between the two nations. However, the Coronavirus pandemic took the focus out of the conflict. Yet, it is worth mentioning that President Joe Biden, who took office after Trump, kept tariffs in place and even added some additional levies.
The return of Donald Trump to the White House as the 47th US President has sparked a fresh wave of tensions between the two countries. During the 2024 election campaign, Trump pledged to impose 60% tariffs on China once he returned to office, which he did on January 20, 2025. With Trump back, the US-China trade war is meant to resume where it was left, with tit-for-tat policies affecting the global economic landscape amid disruptions in global supply chains, resulting in a reduction in spending, particularly investment, and directly feeding into the Consumer Price Index inflation.
-
13:00
South Africa Trade Balance (in Rands) dipped from previous 34.7B to 15.46B in December
-
12:34
USD/SGD: Price pattern resembles a rising wedge – OCBC
USD/SGD was a touch firmer as Trump’s tariff threats ahead of 1 Feb deadline undermined sentiments. Pair was last seen at 1.3540, OCBC's FX analysts Frances Cheung and Christopher Wong note.
Bearish momentum seems to be fading
"Bearish momentum shows signs of fading while RSI rose. Rebound risks likely but price pattern resembles a rising wedge (which can be associated with a bearish reversal). Resistance here around 1.3520/40 levels (50 DMA, 23.6% fibo retracement of Sep low to Jan high), 1.36 (21 DMA). Support at 1.3480, 1.3440 levels."
-
12:34
India Infrastructure Output (YoY) down to 4% in December from previous 4.3%
-
12:30
India FX Reserves, USD climbed from previous $623.98B to $629.56B in January 20
-
12:25
Prospect for more RBNZ rate cuts can further weigh on NZD – BBH
NZD/USD is firmer but the prospect for more RBNZ rate cuts can further weigh on New Zealand Dollar (NZD), BBH FX analysts note.
Markets continue to imply another rate cut in February
"New Zealand January ANZ consumer confidence was disappointing. Consumer confidence dipped 4 points to a three-month low at 96.0 and remains below long-run average of 113.7. Additionally, the proportion of households thinking it’s a good time to buy a major household item, the best retail indicator, dropped a sharp 15 points to -16."
"In line with RBNZ guidance, markets continue to imply another 50bps rate cut to 3.75% at the February 19 meeting and the policy rate to bottom at 3.00% over the next 12 months."
-
12:09
USD/JPY: BoJ's Ueda notes more hikes in the pipeline – BBH
USD/JPY is holding above technical support at 154.00, BBH FX analysts note.
BOJ policy rate likely to peak around 1.00%
"Bank of Japan (BOJ) Governor Ueda stuck to the bank’s guidance. Ueda noted that more hikes are in the pipeline if the economic and price outlooks are realized but cautioned that monetary policy will remain accommodative to support price trend."
"The comments suggest the BOJ policy rate will likely peak around 1.00% over the next two years, in line with market pricing. This seems about right as the BOJ expects inflation to stabilize around its 2% target in 2026. Bottom line: the BOJ shallow policy normalization cycle is an ongoing headwind for JPY."
-
12:06
GBP/USD: BOE s widely expected to slash the policy rate – BBH
GBP/USD is range-bound around 1.2450, BBH FX analysts note.
Most indicators of UK near-term activity decline
"The UK January Lloyds business barometer was mixed. The headline index fell to a 13-month low at 37 vs. 39 in December suggesting business investment backdrop remains sluggish. However, the 12-month ahead business activity index improved to 51 vs. 47 in December."
"The Bank of England (BOE) is widely expected to slash the policy rate 25bps to 4.50% next Thursday. Most indicators of UK near-term activity have declined, and services inflation cooled more than the BOE anticipated in December."
-
11:56
AUD/USD Price Forecast: Falls back as US Dollar refreshes weekly high
- AUD/USD gives up some intraday gains as the US Dollar posts a fresh weekly high amid Donald Trump’s tariff fears.
- Donald Trump is poised to impose 25% tariffs on Canada and Mexico, and 100% on BRICS.
- Investors expect the RBA to pivot to a policy-easing stance from February.
The AUD/USD pair surrenders a majority of intraday gains after facing selling pressure above 0.6230 in Friday’s European session but is still almost 0.2% higher at the press time. The Aussie pair retreats as the US Dollar (USD) strengthens amid deepening risks of a global trade war, with United States (US) President Donald Trump threatening to impose hefty tariffs on BRICS, and other North American nations.
The US Dollar Index (DXY), which tracks the Greenback’s value against six major currencies, posts a fresh weekly high near 108.35.
Market participants expect higher tariffs would result in an acceleration in inflationary pressures on the assumption that the scenario will boost production domestically, which will increase labor demand and, eventually, wage growth. Such a scenario will allow the Federal Reserve (Fed) to hold interest rates at their current levels for longer.
Meanwhile, investors have underpinned the Australian Dollar (AUD) against the US Dollar even though traders have fully priced in the fact that the Reserve Bank of Australia (RBA) will start reducing interest rates from the policy meeting in February. Analysts at ANZ expect that a “sharper-than-expected” slowdown in inflation would provide the RBA with enough confidence to lower its Official Cash Rate by 25 basis points (bps) at its next meeting.
AUD/USD corrects to near 0.6200 after failing to extend the 11-day recovery above 0.6330 from an over-four-year low of 0.6130. The pair rebounded after a divergence in momentum and price action. The 14-period Relative Strength Index (RSI) formed a higher low, while the pair made lower lows on a four-hour timeframe.
The asset has also returned below the 50-period Exponential Moving Average (EMA), which trades around 0.6246.
Going forward, the pair would resume its downside journey if it fails to hold the January 13 low of 0.6130. This will push it lower to the round-level support of 0.6100 and the April 2020 low of 0.5990.
On the flip side, a sustenance move above the January 13 high of 0.6330 will open doors to the round-level resistance of 0.6400 and the December 5 high of 0.6456
AUD/USD four-hour chart
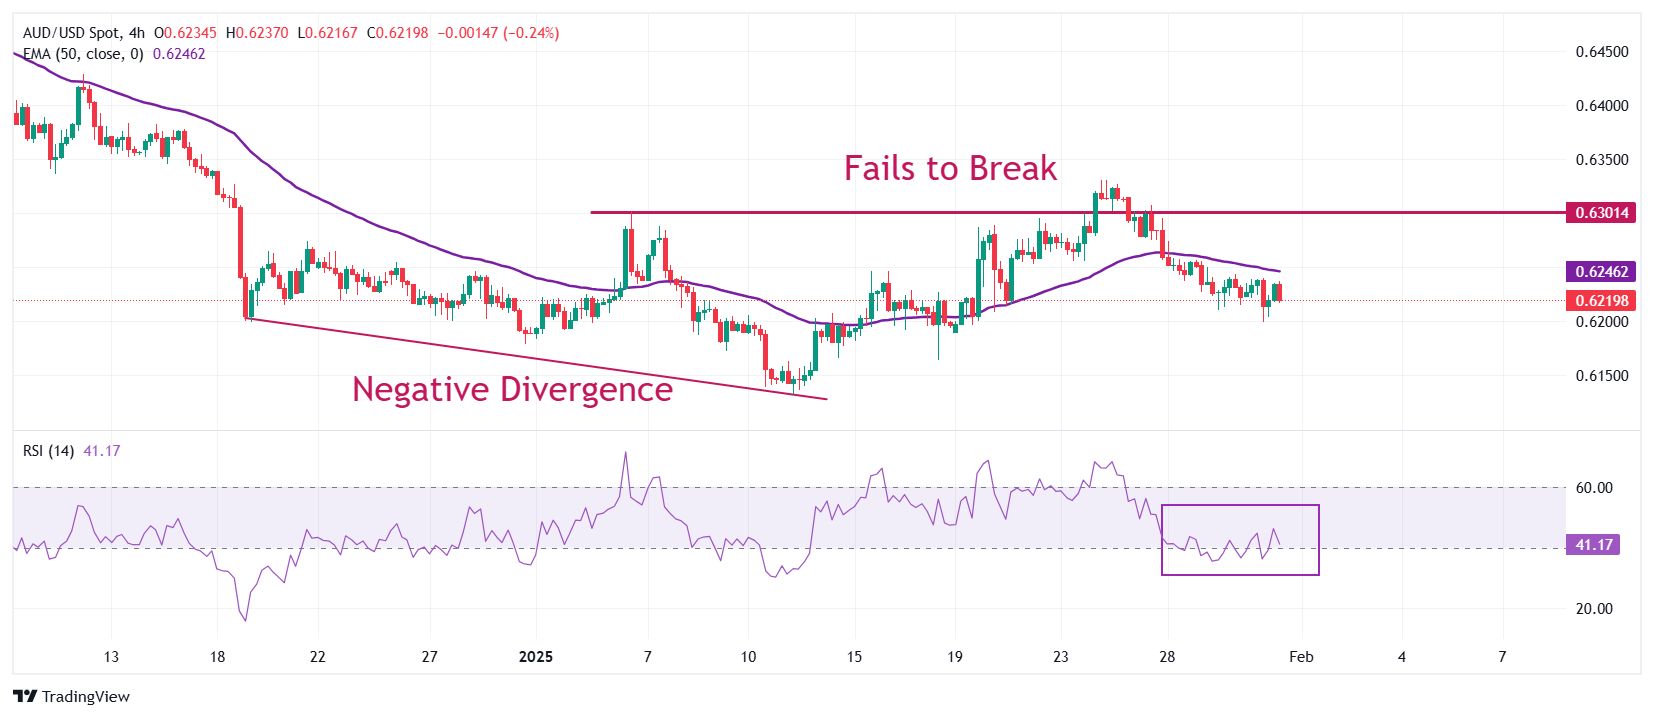
Australian Dollar FAQs
One of the most significant factors for the Australian Dollar (AUD) is the level of interest rates set by the Reserve Bank of Australia (RBA). Because Australia is a resource-rich country another key driver is the price of its biggest export, Iron Ore. The health of the Chinese economy, its largest trading partner, is a factor, as well as inflation in Australia, its growth rate and Trade Balance. Market sentiment – whether investors are taking on more risky assets (risk-on) or seeking safe-havens (risk-off) – is also a factor, with risk-on positive for AUD.
The Reserve Bank of Australia (RBA) influences the Australian Dollar (AUD) by setting the level of interest rates that Australian banks can lend to each other. This influences the level of interest rates in the economy as a whole. The main goal of the RBA is to maintain a stable inflation rate of 2-3% by adjusting interest rates up or down. Relatively high interest rates compared to other major central banks support the AUD, and the opposite for relatively low. The RBA can also use quantitative easing and tightening to influence credit conditions, with the former AUD-negative and the latter AUD-positive.
China is Australia’s largest trading partner so the health of the Chinese economy is a major influence on the value of the Australian Dollar (AUD). When the Chinese economy is doing well it purchases more raw materials, goods and services from Australia, lifting demand for the AUD, and pushing up its value. The opposite is the case when the Chinese economy is not growing as fast as expected. Positive or negative surprises in Chinese growth data, therefore, often have a direct impact on the Australian Dollar and its pairs.
Iron Ore is Australia’s largest export, accounting for $118 billion a year according to data from 2021, with China as its primary destination. The price of Iron Ore, therefore, can be a driver of the Australian Dollar. Generally, if the price of Iron Ore rises, AUD also goes up, as aggregate demand for the currency increases. The opposite is the case if the price of Iron Ore falls. Higher Iron Ore prices also tend to result in a greater likelihood of a positive Trade Balance for Australia, which is also positive of the AUD.
The Trade Balance, which is the difference between what a country earns from its exports versus what it pays for its imports, is another factor that can influence the value of the Australian Dollar. If Australia produces highly sought after exports, then its currency will gain in value purely from the surplus demand created from foreign buyers seeking to purchase its exports versus what it spends to purchase imports. Therefore, a positive net Trade Balance strengthens the AUD, with the opposite effect if the Trade Balance is negative.
-
11:48
USD/CAD: Canada’s November GDP is the domestic focus – BBH
USD/CAD pulled back to 1.4450 after a kneejerk uptick near 1.4600 yesterday.
Risk of all-out trade war can trigger a USD/CAD overshoot
"Canada’s November GDP is the domestic focus (1:30pm London). Statistics Canada advance information indicates that real GDP decreased -0.1% m/m after rising 0.3% in October. The December real GDP estimate will be published at the same time."
"The Bank of Canada (BOC) warned that a long-lasting and broad-based trade conflict would badly hurt economic activity in Canada and put direct upward pressure on inflation. This complicates the BOC’s job as monetary policy cannot lean against weaker output and higher inflation at the same time."
"The risk of all-out trade war between Canada and the US can trigger a more pronounced USD/CAD overshoot".
-
11:33
India Federal Fiscal Deficit, INR rose from previous 8465.94B to 9140.89B in December
-
11:31
DXY: Boosted by tariff threats – OCBC
USD dipped after 4Q GDP disappointed but erased losses after Trump drummed up tariff threats. Specifically, he spoke about 25% tariffs on about $900bn worth of goods from Canada and Mexico on 1 Feb (Sat). Cautious trading dominated sentiments. DXY was last seen trading at 108.24 levels, OCBC's FX analysts Frances Cheung and Christopher Wong note.
Rebound momentum likely still intact
"Prices of gold surged while JPY, USD were better bid. He also continued the tariff rhetoric, saying that US will make a determination on what the China tariff will be. On comments directed at BRICS nations, he said that there is no chance that BRICS will replace the USD and warned that any country trying to replace USD will face tariffs."
"Earlier, there was a report on US officials probing whether DeepSeek circumvented US restrictions and bought advanced Nvidia semiconductor chips through third parties in Singapore. Tariff concerns ahead of 1 Feb deadline should keep USD supported in the interim unless there is a surprise twist."
"That said, we cautioned that USD longs risk liquidation if tariffs were not imposed on 1 Feb or if they are being deferred. Bearish momentum on daily chart shows signs of fading while RSI continued to rise from near oversold conditions. Rebound momentum likely still intact. Resistance at 108.60 (21 DMA) and 109.50 levels. Support at 107.70/80 levels (50 DMA, 23.6% fibo retracement of Oct low to Jan high), 106.40 (38.2% fibo). Day ahead brings personal income, spending, core PCE and Chicago PMI data."
-
11:17
EUR/USD slides on soft inflation in Germany’s six states, Trump’s tariff threats
- EUR/USD declines to near 1.0370 as inflation in six states of Germany decelerates in January.
- Donald Trump threatens to impose 100% tariffs on BRICS and 25% on Mexico and Canada.
- The Fed kept interest rates at their current levels on Wednesday.
EUR/USD faces selling pressure and declines to near 1.0370 in Friday’s European session. The major currency pair declines as the Euro (EUR) weakens amid a slowdown in inflationary pressures in six German states. Softer-than-expected Consumer Price Index (CPI) data for January boosts confidence that Eurozone price pressures are on track to return sustainably to the European Central Bank’s (ECB) desired rate of 2%, which will support the central bank in easing the monetary policy.
On Thursday, ECB President Christine Lagarde showed confidence in announcing a victory over inflation this year in the monetary policy statement after the central bank reduced its Deposit Facility Rate by 25 basis points (bps) to 2.75%
Christine Lagarde’s comments at the press conference indicated that the ECB has kept the door open for further policy easing. Lagarde said that we are still in “restrictive territory” and it is premature to “anticipate at what point where will stop”. She avoided providing a pre-defined interest rate cut path and reiterated that we decide meeting by meeting based on data.
Going forward, investors will focus on the flash Eurozone Harmonized Index of Consumer Prices (HICP) data for January, which will be released on Monday.
But before that, the preliminary German HICP data for January will be published at 13:00 GMT. However, the impact is expected to be limited, as the inflation data in six German states have already indicated the current status of price pressures.
Daily digest market movers: EUR/USD weakens amid US Dollar’s strength
- EUR/USD remains under pressure as the broader outlook of the US Dollar (USD) remains firm, with the US Dollar Index (DXY) wobbling around 108.20. The safe-haven appeal of the Greenback strengthens as United States (US) President Donald Trump reiterated his intentions of imposing hefty tariffs on his North American peers and BRICS on Thursday.
- Donald Trump said on his social media platform, TruthSocial, that he requires a commitment from the BRICS that it will “neither create a new currency nor back any other currency” to replace the US Dollar. Trump threatened that any country tries should “face 100% tariffs”, and expect to say “goodbye to selling into the wonderful US economy.”
- Market experts believe that Donald Trump is using tariff measures as a tool to fulfill his economic agenda, and the imposition of hefty tariffs will be inflationary for the US economy. Such a scenario would support the Federal Reserve (Fed) in holding its stance of keeping interest rates unchanged in the range of 4.25%-4.50% for longer.
- On Wednesday, the Fed maintained the status quo and guided to remain in the waiting mode until the central bank sees any “real progress in inflation or some weakness in the labor market”.
- Meanwhile, the next move in the US Dollar will be guided by the US Personal Consumption Expenditure Price Index (PCE) data for December, which will be published at 13:30 GMT. Economists expect monthly core PCE inflation to have grown at a faster pace of 0.2%, compared to a 0.1% increase in November. Year-on-year, core PCE is estimated to have grown steadily by 2.8%.
Technical Analysis: EUR/USD slides below 20-day EMA
EUR/USD declines to near 1.0370 in Friday’s European session, below the 20-day Exponential Moving Average (EMA) around 1.0390. The major currency pair resumed its correction after failing to sustain above the 50-day EMA, which trades around 1.0449 at the press time.
The 14-day Relative Strength Index (RSI) faces barricades near 60.00. Such a scenario indicates that the recovery move was short-lived.
Looking down, the January 20 low of 1.0266 and January 13 low of 1.0177 will act as major support for the pair. Conversely, the December 6 high of 1.0630 will be the key barrier for the Euro bulls.
Euro FAQs
The Euro is the currency for the 19 European Union countries that belong to the Eurozone. It is the second most heavily traded currency in the world behind the US Dollar. In 2022, it accounted for 31% of all foreign exchange transactions, with an average daily turnover of over $2.2 trillion a day. EUR/USD is the most heavily traded currency pair in the world, accounting for an estimated 30% off all transactions, followed by EUR/JPY (4%), EUR/GBP (3%) and EUR/AUD (2%).
The European Central Bank (ECB) in Frankfurt, Germany, is the reserve bank for the Eurozone. The ECB sets interest rates and manages monetary policy. The ECB’s primary mandate is to maintain price stability, which means either controlling inflation or stimulating growth. Its primary tool is the raising or lowering of interest rates. Relatively high interest rates – or the expectation of higher rates – will usually benefit the Euro and vice versa. The ECB Governing Council makes monetary policy decisions at meetings held eight times a year. Decisions are made by heads of the Eurozone national banks and six permanent members, including the President of the ECB, Christine Lagarde.
Eurozone inflation data, measured by the Harmonized Index of Consumer Prices (HICP), is an important econometric for the Euro. If inflation rises more than expected, especially if above the ECB’s 2% target, it obliges the ECB to raise interest rates to bring it back under control. Relatively high interest rates compared to its counterparts will usually benefit the Euro, as it makes the region more attractive as a place for global investors to park their money.
Data releases gauge the health of the economy and can impact on the Euro. Indicators such as GDP, Manufacturing and Services PMIs, employment, and consumer sentiment surveys can all influence the direction of the single currency. A strong economy is good for the Euro. Not only does it attract more foreign investment but it may encourage the ECB to put up interest rates, which will directly strengthen the Euro. Otherwise, if economic data is weak, the Euro is likely to fall. Economic data for the four largest economies in the euro area (Germany, France, Italy and Spain) are especially significant, as they account for 75% of the Eurozone’s economy.
Another significant data release for the Euro is the Trade Balance. This indicator measures the difference between what a country earns from its exports and what it spends on imports over a given period. If a country produces highly sought after exports then its currency will gain in value purely from the extra demand created from foreign buyers seeking to purchase these goods. Therefore, a positive net Trade Balance strengthens a currency and vice versa for a negative balance.
-
11:03
Italy Producer Price Index (MoM) down to 0.6% in December from previous 1.2%
-
11:03
Italy Producer Price Index (YoY) climbed from previous -0.5% to 1.1% in December
-
11:00
Greece Retail Sales (YoY) rose from previous -1.5% to 1.1% in November
-
10:54
Gold at fresh all-time highs ahead of US PCE
- Gold broke through $2,790 and printed a fresh all-time at $2,800.93 on Friday.
- US President Donald Trump confirmed that 25% tariffs will be imposed on Canada and Mexico starting Saturday.
- Gold's price could print more new all-time highs if US PCE data comes out weaker than expected later during the day.
Gold’s price (XAU/USD) is trading around a fresh all-time high, for now on record at $2,800.93, with still a long Friday ahead. On the geopolitical front, markets got rattled by comments from US President Donald Trump who confirmed 25% tariffs to be imposed on Canada and Mexico, the two largest US trading partners, starting on Saturday, and threatened to impose 100% tariffs on BRICS nations if they try to replace the US Dollar with a new currency in international trade. This should act as a headwind for Bullion since it could lead to a trade war and inflation fears with price surges for consumers and manufacturers in the US.
On the economic data front, inflation will be drawing all the attention, with the US Personal Consumption Expenditures (PCE) Price Index releases for December, the Federal Reserve’s preferred inflation gauge, due later on the day. Overall, figures are expected to remain stable or marginally higher.
Daily digest market movers: Ready for a fresh all-time high
- US President Donald Trump is poised to unleash his first wave of tariffs on Saturday, sending foreign governments and businesses rushing to skirt potential duties and prepare for retaliation. Trump has pledged 25% tariffs on about $900 billion in goods from both Canada and Mexico, Bloomberg reports.
- On Thursday, bullion already printed a fresh all-time high after the preliminary 2024 fourth-quarter reading of the US Gross Domestic Product (GDP) came in softer than expected, pointing to lesser growth in the US, Reuters reports.
- President Trump reiterated on Thursday his threat of imposing 100% tariffs on BRICS nations if they try to replace the US Dollar (USD) with a new currency in international trade. Trump posted on TruthSocial: “We are going to require a commitment from these seemingly hostile countries that they will neither create a new BRICS currency, nor back any other currency to replace the mighty US Dollar or, they will face 100% tariff,” and continued “there is no chance that BRICS will replace the US Dollar in international trade, or anywhere else, and any country that tries should say hello to tariffs, and goodbye to America!”
- At 13:30 GMT, the US Personal Consumption Expenditures (PCE) Price Index data for December will be released. Expectations are for the monthly core PCE reading to increase by 0.2% from 0.1% in November. The monthly headline PCE data should tick up 0.3% from 0.1% the previous month.
- Markets might face substantial volatility on Monday due to the possible sanctions being imposed over the weekend by the Trump administration on Canada and Mexico.
Technical Analysis: Litmus test at all-time highs
After a spike higher on early Friday, hitting a fresh all-time high of $2,800.93, the question will be whether bullion will not face some substantial profit-taking. Tariffs are always considered inflationary, thus a headwind for the precious metal. Should the US data come in higher than expected later in the day, inflation concerns would spark more selling pressure, and Gold might quickly dive lower in search of support.
The first support is quite far off, at $2,721, a triple top in November, December and January, broken on January 21. Just below that, $2,709 (October 23, 2024, low) is in focus as a second nearby support. In case both abovementioned levels snap, look for a dive back to $2,680 with a full-swing sell-off.
Analysts and strategists have called for $3,000, but $2,800 looks like a good starting point for the next upside resistance. Based on the price action from Thursday, technical analysis (pivots) shows $2,809 and $2,824 as important daily resistance levels.
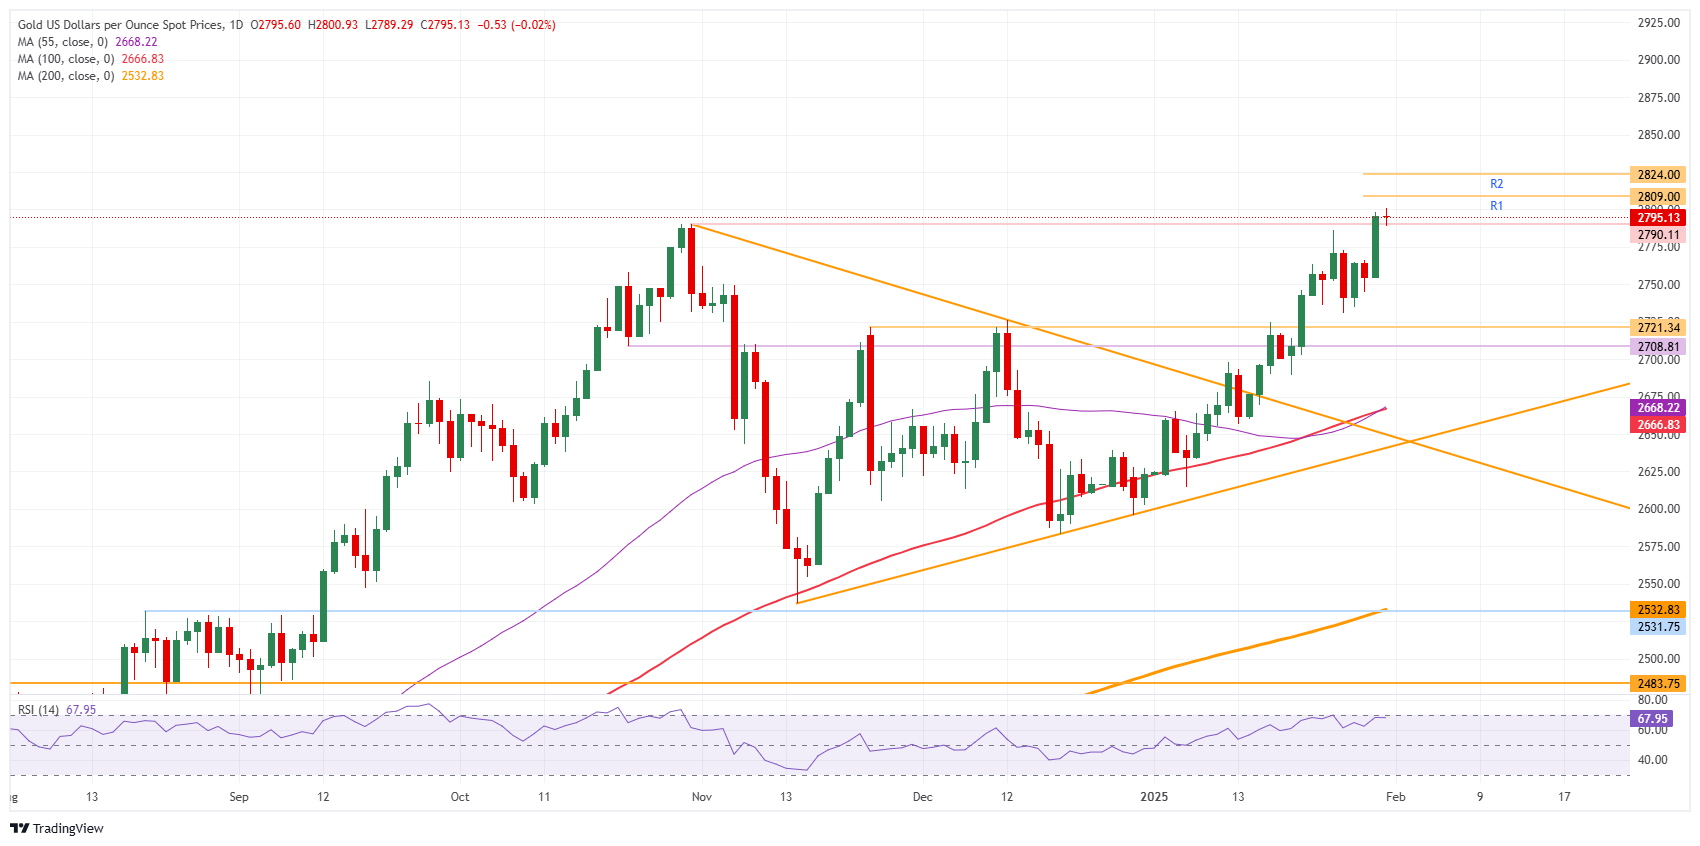
XAU/USD: Daily Chart
Tariffs FAQs
Tariffs are customs duties levied on certain merchandise imports or a category of products. Tariffs are designed to help local producers and manufacturers be more competitive in the market by providing a price advantage over similar goods that can be imported. Tariffs are widely used as tools of protectionism, along with trade barriers and import quotas.
Although tariffs and taxes both generate government revenue to fund public goods and services, they have several distinctions. Tariffs are prepaid at the port of entry, while taxes are paid at the time of purchase. Taxes are imposed on individual taxpayers and businesses, while tariffs are paid by importers.
There are two schools of thought among economists regarding the usage of tariffs. While some argue that tariffs are necessary to protect domestic industries and address trade imbalances, others see them as a harmful tool that could potentially drive prices higher over the long term and lead to a damaging trade war by encouraging tit-for-tat tariffs.
During the run-up to the presidential election in November 2024, Donald Trump made it clear that he intends to use tariffs to support the US economy and American producers. In 2024, Mexico, China and Canada accounted for 42% of total US imports. In this period, Mexico stood out as the top exporter with $466.6 billion, according to the US Census Bureau. Hence, Trump wants to focus on these three nations when imposing tariffs. He also plans to use the revenue generated through tariffs to lower personal income taxes.
-
10:52
ECB’s Muller: It is realistic for inflation to be near 2% by the middle of this year
European Central Bank (ECB) policymaker Madis Muller said on Friday that “it is realistic for inflation to be near 2% by the middle of this year.”
“Rates are nearing the point where they won't curb investment,” Muller added.
Market reaction
EUR/USD leeps the red near 1.0380 following these comments, losing 0.12% on the day.
-
10:40
FOMC: Powell sounded more dovish at the post-meeting press conference – OCBC
The Committee decided to maintain the target range for the Fed funds rate at 4.25-4.50% at the January meeting; the decision was unanimous, OCBC's FX Frances Cheung and Christopher Wong analysts note.
Current monetary policy is 'meaningfully above the neutral rate'
"The Statement was seen as carrying a hawkish tilt on two fronts: 1/It dropped the reference that 'inflation has made progress towards the Committee’s 2 percent objective'; and 2/ it also dropped the assessment that 'the labor market conditions have generally eased'. Powell sounded more dovish at the post-meeting press conference, saying the economy is strong overall, and 'has made significant progress towards our goals over the past two years'."
"Indeed, the progress has been there for a long time, and we do not read too much into the shortening of that phrase in the statement, which was 'a little language cleanup' as how Powell described it. That said, stabilization in the labor market conditions reduces the urgency to ease policy rapidly. Powell opined 'we do not need to be in a hurry to adjust our policy stances', but 'reducing policy constraint too slowly or too little could unduly weaken economic activity and employment'."
"On balance, the case for a March cut is not close yet, in our view. First, Powell said the current monetary policy stance is 'meaningfully above the neutral rate'; second, the favorable base effect for CPI may result in some downside surprises for Q1 readings."
-
10:35
USD: Will Trump hit Canada and Mexico? – ING
The weekend will present the first test of how serious US President Donald Trump is with his protectionism threat, as Canada and Mexico face a 25% tariff deadline tomorrow, ING's FX analyst Francesco Pesole notes.
Tariffs on Canada and Mexico to influence the USD
"Neither CAD nor MXN were fully pricing in the tariff risk when Trump reiterated his protectionism plans versus USMCA partners yesterday, and the remarks caused a CAD and MXN selloff and broader dollar rally. Markets continue to treat those threats with a dose of caution, and should we effectively see an official imposition of tariffs tomorrow, both CAD and MXN look at major downside risks."
"If Trump doesn’t deliver on his threat by tomorrow, we should see the USD depreciate not just against CAD and MXN but also with other currencies that are embedding tariff risks (like AUD, NZD, EUR). Investors’ intuition could be that Trump will only use tariffs mostly as threat for negotiations, but ultimately refrain from hitting its major partners."
"On the data side, US core PCE is released today and is expected to have accelerated 0.2% in December, although risks are skewed to a stronger print. Anyway, expect the dollar to be primarily driven by the tariff story. If by the end of today we get no news on Canada and Mexico, the risks are probably of a stronger dollar, as markets could price in a greater chance of tariffs being announced tomorrow."
-
10:30
Silver price today: Silver rises, according to FXStreet data
Silver prices (XAG/USD) rose on Friday, according to FXStreet data. Silver trades at $31.60 per troy ounce, up 0.18% from the $31.55 it cost on Thursday.
Silver prices have increased by 9.37% since the beginning of the year.
Unit measure Silver Price Today in USD Troy Ounce 31.60 1 Gram 1.02
The Gold/Silver ratio, which shows the number of ounces of Silver needed to equal the value of one ounce of Gold, stood at 88.42 on Friday, down from 88.62 on Thursday.
Silver FAQs
Silver is a precious metal highly traded among investors. It has been historically used as a store of value and a medium of exchange. Although less popular than Gold, traders may turn to Silver to diversify their investment portfolio, for its intrinsic value or as a potential hedge during high-inflation periods. Investors can buy physical Silver, in coins or in bars, or trade it through vehicles such as Exchange Traded Funds, which track its price on international markets.
Silver prices can move due to a wide range of factors. Geopolitical instability or fears of a deep recession can make Silver price escalate due to its safe-haven status, although to a lesser extent than Gold's. As a yieldless asset, Silver tends to rise with lower interest rates. Its moves also depend on how the US Dollar (USD) behaves as the asset is priced in dollars (XAG/USD). A strong Dollar tends to keep the price of Silver at bay, whereas a weaker Dollar is likely to propel prices up. Other factors such as investment demand, mining supply – Silver is much more abundant than Gold – and recycling rates can also affect prices.
Silver is widely used in industry, particularly in sectors such as electronics or solar energy, as it has one of the highest electric conductivity of all metals – more than Copper and Gold. A surge in demand can increase prices, while a decline tends to lower them. Dynamics in the US, Chinese and Indian economies can also contribute to price swings: for the US and particularly China, their big industrial sectors use Silver in various processes; in India, consumers’ demand for the precious metal for jewellery also plays a key role in setting prices.
Silver prices tend to follow Gold's moves. When Gold prices rise, Silver typically follows suit, as their status as safe-haven assets is similar. The Gold/Silver ratio, which shows the number of ounces of Silver needed to equal the value of one ounce of Gold, may help to determine the relative valuation between both metals. Some investors may consider a high ratio as an indicator that Silver is undervalued, or Gold is overvalued. On the contrary, a low ratio might suggest that Gold is undervalued relative to Silver.
(An automation tool was used in creating this post.)
-
10:28
EUR/USD: Consolidation is likely in near term – OCBC
Euro (EUR) traded under pressure amid broad US Dollar (USD) strength on tariff threats. Yesterday at the last GC meeting, ECB lowered policy rates for the 5 the consecutive meeting by 25bp. Pair was last at 1.0370 levels, OCBC's FX Frances Cheung and Christopher Wong analysts note.
Near term risks for EUR skewed to the downside
"Deposit rate now stands at 2.75%. Decision was unanimous and the Council did not discuss the possibility of a larger cut. Lagarde said that rates remain in restrictive territory, and it is premature to discuss when ECB should stop cutting rates. According to a Reuters report, 3 ECB policymakers commented that they thought a further rate cut was likely to go through in March meeting without much resistance before debate within the Governing Council on further easing becomes more heated."
"On tariff implications, Lagarde said that tariffs would have a 'global negative impact' on growth but their potential effect on inflation was 'far more complicated' due to possible retaliation and market adjustment. Recall earlier this week, FT reported that US Treasury secretary Scott Bessent favors universal tariffs on US imports, starting at 2.5% while Trump said he wants tariffs ‘much bigger’ than 2.5%."
"Near term risks for EUR skewed to the downside on tariff threats and EU growth concerns (a risk that ECB may need to cut deeper). Bullish momentum on daily chart shows signs of fading but decline in RSI moderates. Consolidation likely. Support at 1.0360 (21 DMA) and 1.0240 levels. Resistance at 1.0420/30 levels (23.6% fibo retracement of Sep high to Jan low, 50 DMA), 1.0520 levels."
-
10:20
EUR: Post-meeting leak not too relevant for now – ING
The European Central Bank cut rates by 25bp yesterday, and the accompanying communication fully matched expectations, ING's FX analyst Francesco Pesole notes
EUR/USD can easily head below 1.030
"The Governing Council retained a meeting-by-meeting, data-dependent approach but also reaffirmed its dovish bias on the back of optimistic disinflation expectations and a grim growth outlook. Unlike the Bank of Canada, which on Wednesday had strictly tied future cuts to US trade policy, the ECB seems to be heading to lower rates regardless of Trump’s tariff plans."
"The most interesting development was probably the leak to media that the Governing Council will drop the 'restrictive' reference to interest rates when it cuts rates again in March. That could be read as a moderately hawkish signal as things stand now, but it needs to be weighed against the new assessment on the neutral rate. Some hints on that will be given on 7 February when the ECB will publish a note on R*. For now, the ECB in-meeting and out-of-meeting communication has simply been too dovish to justify a rethink of dovish expectations."
"EUR/USD will anyway continue to follow the tariff-driven swings in the dollar. Should Trump impose tariffs on Canada and Mexico by tomorrow, we think EUR/USD can easily head below 1.030 on the back of USD strength and greater tariff risk could be embedded into the euro."
-
10:03
Germany Bavaria CPI (YoY) declined to 2.5% in January from previous 3.2%
-
10:03
Germany Bavaria CPI (MoM) declined to -0.3% in January from previous 0.5%
-
10:02
Germany Baden-Wuerttemberg CPI (MoM): -0.2% (January) vs previous 0.5%
-
10:02
Germany Baden-Wuerttemberg CPI (YoY) down to 2.3% in January from previous 2.6%
-
10:01
Germany Hesse CPI (MoM) declined to 0.1% in January from previous 1.8%
-
10:01
Germany Hesse CPI (YoY) down to 2.5% in January from previous 2.7%
-
10:01
Germany Brandenburg CPI (MoM) dipped from previous 0.4% to 0% in January
-
10:01
Germany North Rhine-Westphalia CPI (YoY) declined to 2% in January from previous 2.5%
-
10:01
Spain Current Account Balance declined to €1.26B in November from previous €4.93B
-
10:01
Germany North Rhine-Westphalia CPI (MoM) dipped from previous 0.5% to -0.1% in January
-
10:00
Germany Saxony CPI (YoY): 2.4% (January) vs previous 3.2%
-
10:00
Germany Saxony CPI (MoM): -0.4% (January) vs previous 0.5%
-
10:00
Germany Brandenburg CPI (YoY) down to 2.3% in January from previous 2.4%
-
09:55
Germany Unemployment Rate s.a. meets expectations (6.2%) in December
-
09:55
Germany Unemployment Change below forecasts (14K) in December: Actual (11K)
-
09:43
Silver Price Forecast: XAG/USD recovers to near $30.50 as Trump’s tariff threats keep outlook intact
- Silver price bounces back to near $30.50 as its outlook remains firm on Donald Trump’s tariff fears.
- Donald Trump reiterated that he will impose 25% tariffs on North American peers and 100% on BRICS.
- Investors await the US PCE inflation data for December.
Silver price (XAG/USD) recovers a majority of intraday losses and rebounds to near $30.50 in Friday’s European session. The white metal bounces back strongly as its outlook remains firm amid fears that United States (US) President Donald Trump will impose 25% tariffs on Canada and Mexico on Saturday for allowing illegal immigrants and the deadly opioid fentanyl enter into the economy. Such a scenario could lead to a trade war, which heightens geopolitical uncertainty, which is favorable for precious metals, like Silver.
Donald Trump has also threatened to implement 100% tariffs on the BRICS for attempting to create a new currency to diminish their reliance on the US Dollar. On his social media platform, Truth Social, on Thursday, Trump said, "There is no chance that the BRICS will replace the U.S. Dollar in International Trade or anywhere else, and any Country that tries should say hello to Tariffs and goodbye to America."
Meanwhile, the US Dollar’s (USD) appeal has also increased on Trump’s tariff threats but is trading subduedly in European trading hours ahead of the US Personal Consumption Expenditure Price Index (PCE) data for December, which will be published at 13:30 GMT. Economists estimate the core PCE inflation to have risen by 0.2% against 0.1% growth seen in November on month-on-month, with annual figures growing steadily by 2.8%.
Signs of persistent inflationary pressures would boost market expectations that the Federal Reserve (Fed) will keep interest rates at their current levels for a lengthy period. On Wednesday, the Fed left its key borrowing rates steady at 4.25%- 4.50% and guided that the central bank will remain in the waiting mode until it sees real progress in inflation or some weakness in the labor market.
Silver technical analysis
Silver price strengthens on a decisive break above the upward-sloping trendline around $30.85, which is plotted from the 29 February 2024 low of $22.30 on a daily timeframe. The near-term outlook of the white metal remains firm as it holds the 20-day Exponential Moving Average (EMA), which trades around $30.57.
The 14-day Relative Strength Index (RSI) climbs above 60.00. A fresh bullish momentum would trigger if the RSI manages to hold above 60.00.
Looking down, the January 27 low of $29.70 will act as a key support zone for the Silver price. On the upside, the December 12 high of $32.33 will act as key resistance.
Silver daily chart
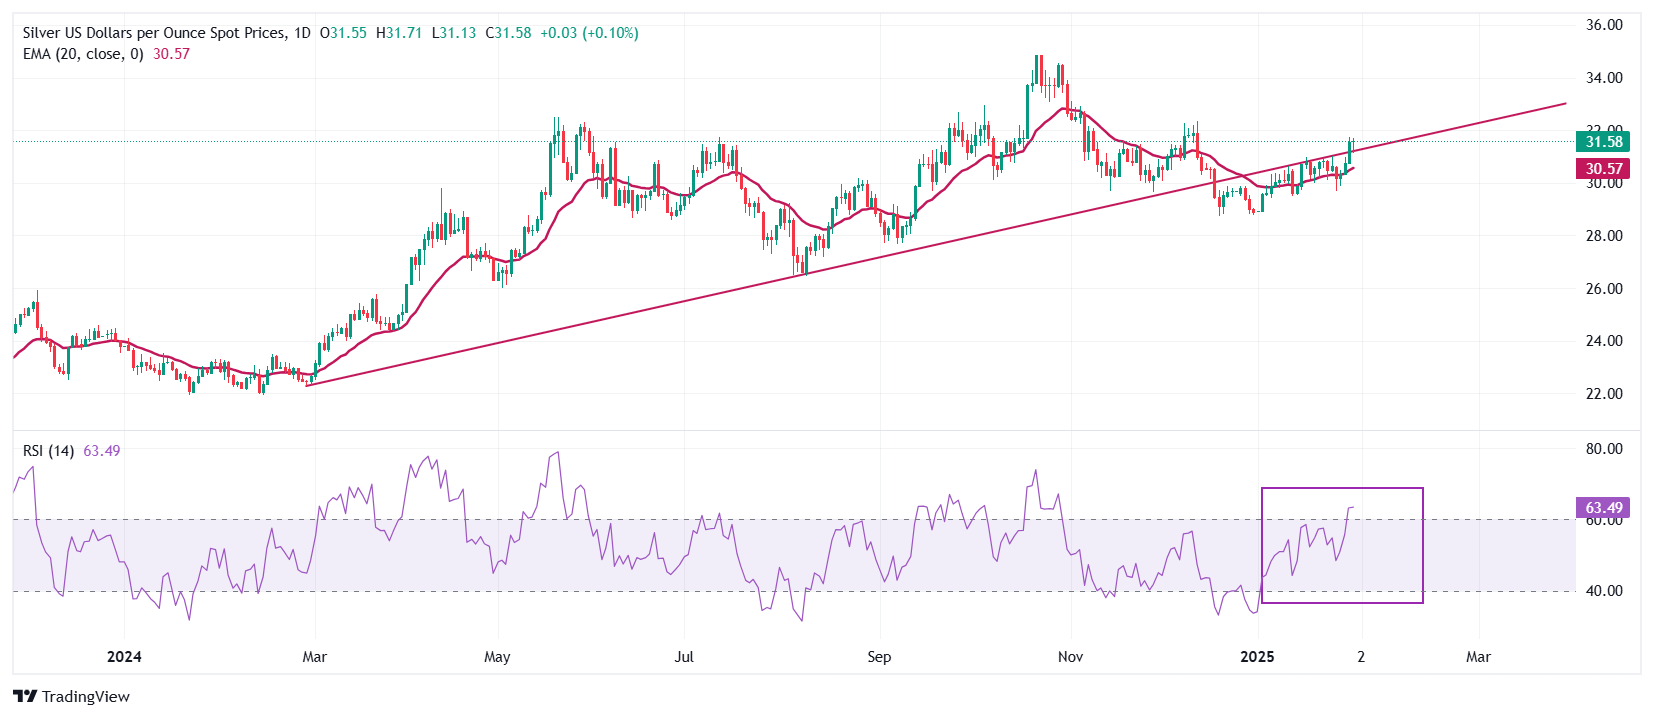
Silver FAQs
Silver is a precious metal highly traded among investors. It has been historically used as a store of value and a medium of exchange. Although less popular than Gold, traders may turn to Silver to diversify their investment portfolio, for its intrinsic value or as a potential hedge during high-inflation periods. Investors can buy physical Silver, in coins or in bars, or trade it through vehicles such as Exchange Traded Funds, which track its price on international markets.
Silver prices can move due to a wide range of factors. Geopolitical instability or fears of a deep recession can make Silver price escalate due to its safe-haven status, although to a lesser extent than Gold's. As a yieldless asset, Silver tends to rise with lower interest rates. Its moves also depend on how the US Dollar (USD) behaves as the asset is priced in dollars (XAG/USD). A strong Dollar tends to keep the price of Silver at bay, whereas a weaker Dollar is likely to propel prices up. Other factors such as investment demand, mining supply – Silver is much more abundant than Gold – and recycling rates can also affect prices.
Silver is widely used in industry, particularly in sectors such as electronics or solar energy, as it has one of the highest electric conductivity of all metals – more than Copper and Gold. A surge in demand can increase prices, while a decline tends to lower them. Dynamics in the US, Chinese and Indian economies can also contribute to price swings: for the US and particularly China, their big industrial sectors use Silver in various processes; in India, consumers’ demand for the precious metal for jewellery also plays a key role in setting prices.
Silver prices tend to follow Gold's moves. When Gold prices rise, Silver typically follows suit, as their status as safe-haven assets is similar. The Gold/Silver ratio, which shows the number of ounces of Silver needed to equal the value of one ounce of Gold, may help to determine the relative valuation between both metals. Some investors may consider a high ratio as an indicator that Silver is undervalued, or Gold is overvalued. On the contrary, a low ratio might suggest that Gold is undervalued relative to Silver.
-
09:00
Spain Retail Sales (YoY) above forecasts (0.5%) in December: Actual (4%)
-
08:46
France Consumer Price Index (EU norm) (MoM) registered at -0.2%, below expectations (0%) in January
-
08:46
France Consumer Price Index (EU norm) (YoY) below expectations (1.9%) in January: Actual (1.8%)
-
08:45
Pound Sterling consolidates against USD ahead of US core PCE inflation
- The Pound Sterling trades sideways against the US Dollar above 1.2400 as investors focus on the US PCE inflation data for December.
- President Trump’s tariff threats on BRICS and its North American peers have increased USD’s safe-haven appeal.
- Investors expect the BoE to resume the interest rate-cut cycle on Thursday.
The Pound Sterling (GBP) trades in a tight range slightly above the key support of 1.2400 against the US Dollar (USD) in Friday’s European session. The GBP/USD pair steadies despite an increase in the US Dollar’s safe-haven demand on Thursday after United States (US) President Donald Trump reiterated his intentions to impose 25% tariffs on Canada and Mexico from Saturday and 100% on BRICS if they try to replace the US Dollar with a new currency in international trade.
The US Dollar Index (DXY), which tracks the Greenback’s value against six major currencies, trades close to its weekly high of 108.20.
On his social media platform, TruthSocial, Trump said, "We are going to require a commitment from these seemingly hostile countries that they will neither create a new BRICS currency nor back any other currency to replace the mighty US Dollar, or they will face 100% tariffs." He added that there is no chance that “BRICS will replace the US Dollar in International trade” or anywhere else, and any country that tries should say, “Hello to Tariffs, and goodbye to America!"
Market participants believe that President Trump's higher tariffs would be inflationary for the US economy, which could force the Federal Reserve (Fed) to keep interest rates at their current levels for longer. On Wednesday, the Fed announced a pause in the easing policy cycle and kept borrowing rates unchanged in the range of 4.25%-4.50%.
Fed Chair Jerome Powell said that monetary policy adjustments will become appropriate when central bank officials see “real progress on inflation or at least some weakness in the labor market.”
In Friday’s session, investors will pay close attention to the US Personal Consumption Expenditures Price Index (PCE) data for December, which will be published at 13:30 GMT. The core PCE inflation, the Fed’s preferred inflation gauge, is estimated to have grown at a faster pace of 0.2% month-on-month from 0.1% in November, with annual figures growing steadily by 2.8%.
Daily digest market movers: Pound Sterling ticks lower against major peers
- The Pound Sterling is under pressure against its major peers on Friday, with investors focusing on the Bank of England’s (BoE) monetary policy decision next Thursday. Traders are confident that the BoE will resume the policy-easing cycle and reduce interest rates by 25 basis points (bps) to 4.5%.
- The BoE’s monetary policy guidance could be dovish, as recent inflation indicators have shown signs of deceleration, although wage growth remains accelerating.
- Financial market participants are pricing in three interest rate cuts from the BoE this year amid faltering labor demand and weakening business confidence. This is due to higher employer contributions to National Insurance (NI) announced by Chancellor of the Exchequer Rachel Reeves in the Autumn budget.
- However, Reeves strives to cool dissatisfaction among business owners by adopting significant measures to boost growth. In her speech at Oxfordshire on Wednesday, Reeves vowed to support the expansion of London's Heathrow Airport and to remove "stifling and unpredictable" regulations to boost productivity. She was also confident about building better trade relations with the US under Donald Trump's leadership.
Technical Analysis: Pound Sterling holds above 1.2400
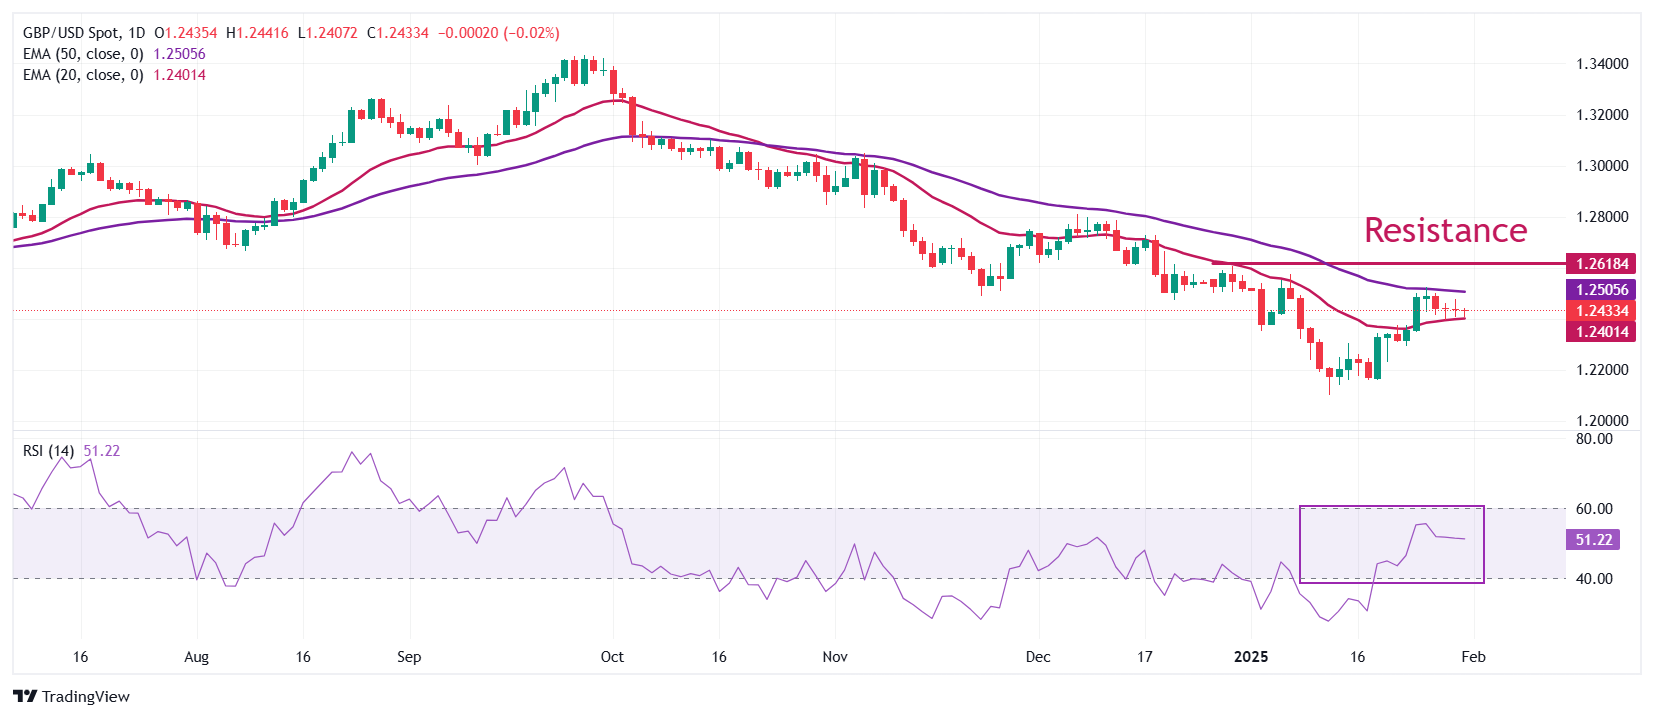
The Pound Sterling has held the key support of 1.2400 against the US Dollar since Monday. The near-term outlook for the GBP/USD pair remains firm as it holds the 20-day Exponential Moving Average (EMA), which trades around 1.2400. However, the 50-day EMA near 1.2510 remains a major barrier for the Sterling bulls.
The 14-day Relative Strength Index (RSI) oscillates in the 20.00-40.00 range, suggesting a sideways trend.
Looking down, the January 13 low of 1.2100 and the October 2023 low of 1.2050 will act as key support zones for the pair. On the upside, the December 30 high of 1.2607 will act as key resistance.
Pound Sterling FAQs
The Pound Sterling (GBP) is the oldest currency in the world (886 AD) and the official currency of the United Kingdom. It is the fourth most traded unit for foreign exchange (FX) in the world, accounting for 12% of all transactions, averaging $630 billion a day, according to 2022 data. Its key trading pairs are GBP/USD, also known as ‘Cable’, which accounts for 11% of FX, GBP/JPY, or the ‘Dragon’ as it is known by traders (3%), and EUR/GBP (2%). The Pound Sterling is issued by the Bank of England (BoE).
The single most important factor influencing the value of the Pound Sterling is monetary policy decided by the Bank of England. The BoE bases its decisions on whether it has achieved its primary goal of “price stability” – a steady inflation rate of around 2%. Its primary tool for achieving this is the adjustment of interest rates. When inflation is too high, the BoE will try to rein it in by raising interest rates, making it more expensive for people and businesses to access credit. This is generally positive for GBP, as higher interest rates make the UK a more attractive place for global investors to park their money. When inflation falls too low it is a sign economic growth is slowing. In this scenario, the BoE will consider lowering interest rates to cheapen credit so businesses will borrow more to invest in growth-generating projects.
Data releases gauge the health of the economy and can impact the value of the Pound Sterling. Indicators such as GDP, Manufacturing and Services PMIs, and employment can all influence the direction of the GBP. A strong economy is good for Sterling. Not only does it attract more foreign investment but it may encourage the BoE to put up interest rates, which will directly strengthen GBP. Otherwise, if economic data is weak, the Pound Sterling is likely to fall.
Another significant data release for the Pound Sterling is the Trade Balance. This indicator measures the difference between what a country earns from its exports and what it spends on imports over a given period. If a country produces highly sought-after exports, its currency will benefit purely from the extra demand created from foreign buyers seeking to purchase these goods. Therefore, a positive net Trade Balance strengthens a currency and vice versa for a negative balance.
-
08:45
France Producer Prices (MoM) dipped from previous 3.2% to 1% in December
-
08:43
Forex Today: Gold sets new record-high, majors stay quiet ahead of inflation data
Here is what you need to know on Friday, January 31:
Major currency pairs trade in narrow ranges early Friday, following some volatility seen on Thursday. Regional and nation-wide inflation data from Germany and December Personal Consumption Expenditures (PCE) Price Index data from the US will be watched closely by market participants on Friday. Fourth-quarter Employment Cost Index data will also be featured in the US economic calendar ahead of the weekend.
US Dollar PRICE This week
The table below shows the percentage change of US Dollar (USD) against listed major currencies this week. US Dollar was the strongest against the Australian Dollar.
USD EUR GBP JPY CAD AUD NZD CHF USD 0.83% 0.40% -0.62% 0.50% 1.32% 0.89% 0.41% EUR -0.83% -0.35% -1.30% -0.18% 0.50% 0.19% -0.31% GBP -0.40% 0.35% -1.25% 0.18% 0.85% 0.56% 0.04% JPY 0.62% 1.30% 1.25% 1.17% 2.13% 1.76% 1.18% CAD -0.50% 0.18% -0.18% -1.17% 0.62% 0.39% -0.13% AUD -1.32% -0.50% -0.85% -2.13% -0.62% -0.27% -0.76% NZD -0.89% -0.19% -0.56% -1.76% -0.39% 0.27% -0.73% CHF -0.41% 0.31% -0.04% -1.18% 0.13% 0.76% 0.73% The heat map shows percentage changes of major currencies against each other. The base currency is picked from the left column, while the quote currency is picked from the top row. For example, if you pick the US Dollar from the left column and move along the horizontal line to the Japanese Yen, the percentage change displayed in the box will represent USD (base)/JPY (quote).
The European Central Bank (ECB) announced on Thursday that it lowered key rates by 25 basis points (bps) as expected. The ECB didn't make any significant changes to its policy statement and ECB Christine Lagarde refrained from committing to the next rate move, reiterating that their next decision will be driven by data and analysis. After rising above 1.0450 in the second half of the day, EUR/USD lost its traction and retreated below to close in negative territory on Thursday. Early Friday, the data from Germany showed that Retail Sales declined by 1.6% on a monthly basis in December, missing the market expectation for an increase of 0.2%. EUR/USD showed no immediate reaction to this data and was last seen trading in a narrow channel at around 1.0400.
The US Bureau of Economic Analysis (BEA) reported on Thursday that the US' Gross Domestic Product expanded at an annual rate of 2.3% in the fourth quarter. This reading followed the 3.1% expansion recorded in the third quarter and came in below the market estimate for a growth of 2.6%. On a positive note, weekly Initial Jobless Claims in the US declined to 207,000 in the week ending January 25 from 223,000 in the previous week. The US Dollar (USD) Index held its ground after mixed data and posted modestly gains on Thursday. Early Friday, the index stays in a consolidation phase near 108.00.
Meanwhile, US President Donald Trump took to social media late Thursday to make a fresh tariff threat against Canada and Mexico. According to President Trump's social media post, the US is set to impose a flat 25% import tax "because of fentanyl" on all goods crossing the border into the US from Canada or Mexico. Trump also warned that they could impose 100% tariffs on BRICS nations if they were to try to replace the USD with a new currency in international trade.
Bank of Japan (BoJ) Governor Kazuo Ueda said on Friday that underlying inflation is still somewhat below 2%. Ueda added that the Japanese central bank would maintain an accommodative policy to support price trends. After losing more than 0.5% on Thursday, USD/JPY stages a rebound and trades in positive territory above 154.50.
GBP/USD closed modestly lower on Thursday after meeting resistance above 1.2450. The pair clings to small daily gains on Friday but remains below 1.2450.
Gold gathered bullish momentum and rose more than 1% on Thursday. Gold continued to stretch higher and trades at an all-time peak near $2,800.
Inflation FAQs
Inflation measures the rise in the price of a representative basket of goods and services. Headline inflation is usually expressed as a percentage change on a month-on-month (MoM) and year-on-year (YoY) basis. Core inflation excludes more volatile elements such as food and fuel which can fluctuate because of geopolitical and seasonal factors. Core inflation is the figure economists focus on and is the level targeted by central banks, which are mandated to keep inflation at a manageable level, usually around 2%.
The Consumer Price Index (CPI) measures the change in prices of a basket of goods and services over a period of time. It is usually expressed as a percentage change on a month-on-month (MoM) and year-on-year (YoY) basis. Core CPI is the figure targeted by central banks as it excludes volatile food and fuel inputs. When Core CPI rises above 2% it usually results in higher interest rates and vice versa when it falls below 2%. Since higher interest rates are positive for a currency, higher inflation usually results in a stronger currency. The opposite is true when inflation falls.
Although it may seem counter-intuitive, high inflation in a country pushes up the value of its currency and vice versa for lower inflation. This is because the central bank will normally raise interest rates to combat the higher inflation, which attract more global capital inflows from investors looking for a lucrative place to park their money.
Formerly, Gold was the asset investors turned to in times of high inflation because it preserved its value, and whilst investors will often still buy Gold for its safe-haven properties in times of extreme market turmoil, this is not the case most of the time. This is because when inflation is high, central banks will put up interest rates to combat it. Higher interest rates are negative for Gold because they increase the opportunity-cost of holding Gold vis-a-vis an interest-bearing asset or placing the money in a cash deposit account. On the flipside, lower inflation tends to be positive for Gold as it brings interest rates down, making the bright metal a more viable investment alternative.
-
08:41
EUR/CAD remains subdued near 1.5000 following softer German Retail Sales
- EUR/CAD receives downward pressure amid rising odds of further interest rate cuts by the European Central Bank.
- Germany’s Retail Sales grew by 1.8% YoY in December, falling short of the expected 2.5% increase.
- US President Donald Trump reiterated his plans to impose 25% tariffs on Mexico and Canada.
EUR/CAD retraces its recent gains from the previous two sessions, hovering around 1.5020 during early European trading hours. The currency cross remains under pressure following weaker-than-expected German Retail Sales data released on Friday. Market participants now turn their attention to upcoming Unemployment Rate and Consumer Price Index (CPI) figures from Germany due later today.
Germany’s Retail Sales fell by 1.6% month-over-month in December, as reported by Destatis on Friday. This decline followed an upwardly revised of no growth in November and missed market expectations of a 0.2% increase. On a yearly basis, Retail Sales grew by 1.8%, falling short of analysts' forecasts of 2.5%.
On Thursday, preliminary data from Eurostat reported that the Eurozone economy stagnated in Q4 2024 after expanding by 0.4% in Q3. This flat growth was weaker than the anticipated 0.1% increase, adding to concerns about economic momentum in the region.
The Euro remains under pressure amid growing expectations of further interest rate cuts by the European Central Bank (ECB). On Thursday, the ECB lowered its Deposit Facility Rate by 25 basis points (bps) to 2.75%, while the Main Refinancing Operations Rate dropped to 2.9%, in line with forecasts. Markets had already priced in the rate cut, expecting inflation in the Eurozone to remain on a trajectory toward the central bank’s 2% target.
However, EUR/CAD’s downside may be limited as the Canadian Dollar (CAD) faces headwinds due to a dovish shift in the Bank of Canada's (BoC) policy stance. On Wednesday, the BoC reduced its key interest rate by 25 bps to 3.0% and ended its quantitative tightening program, signaling plans to resume asset purchases in early March.
Adding to CAD’s challenges, US President Donald Trump reiterated his intention to impose 25% tariffs on Mexico and Canada—United States’ (US) top two trading partners. The BoC’s policy outlook was further dampened by concerns over potential US trade restrictions, with Governor Tiff Macklem emphasizing that tariff threats remain a significant risk to the Canadian economy.
Tariffs FAQs
Tariffs are customs duties levied on certain merchandise imports or a category of products. Tariffs are designed to help local producers and manufacturers be more competitive in the market by providing a price advantage over similar goods that can be imported. Tariffs are widely used as tools of protectionism, along with trade barriers and import quotas.
Although tariffs and taxes both generate government revenue to fund public goods and services, they have several distinctions. Tariffs are prepaid at the port of entry, while taxes are paid at the time of purchase. Taxes are imposed on individual taxpayers and businesses, while tariffs are paid by importers.
There are two schools of thought among economists regarding the usage of tariffs. While some argue that tariffs are necessary to protect domestic industries and address trade imbalances, others see them as a harmful tool that could potentially drive prices higher over the long term and lead to a damaging trade war by encouraging tit-for-tat tariffs.
During the run-up to the presidential election in November 2024, Donald Trump made it clear that he intends to use tariffs to support the US economy and American producers. In 2024, Mexico, China and Canada accounted for 42% of total US imports. In this period, Mexico stood out as the top exporter with $466.6 billion, according to the US Census Bureau. Hence, Trump wants to focus on these three nations when imposing tariffs. He also plans to use the revenue generated through tariffs to lower personal income taxes.
-
08:30
Switzerland Real Retail Sales (YoY) above forecasts (0.6%) in December: Actual (2.6%)
-
08:11
FX option expiries for Jan 31 NY cut
FX option expiries for Jan 31 NY cut at 10:00 Eastern Time via DTCC can be found below.
EUR/USD: EUR amounts
- 1.0200 1.7b
- 1.0250 837m
- 1.0300 3.1b
- 1.0350 1b
- 1.0375 973m
- 1.0400 2.8b
- 1.0450 3.1b
- 1.0500 1.9b
GBP/USD: GBP amounts
- 1.2475 597m
USD/JPY: USD amounts
- 154.00 795m
- 154.75 850m
- 155.00 1.4b
- 155.35 665m
USD/CHF: USD amounts
- 0.9010 660m
AUD/USD: AUD amounts
- 0.6200 693m
- 0.6300 586m
USD/CAD: USD amounts
- 1.4300 664m
- 1.4350 817m
- 1.4400 889m
- 1.4500 1.5b
- 1.4550 1.1b
- 1.4600 935m
EUR/GBP: EUR amounts
- 0.8420 713m
-
08:03
German Retail Sales decline 1.6% in December vs. +0.2% expected
- Retail Sales in Germany unexpectedly contracted on a monthly basis in December.
- EUR/USD continues to fluctuate in a tight range near 1.0400.
Retail Sales in Germany declined by 1.6% on a monthly basis in December, Destatis reported on Friday. This reading followed the 0.6% decrease recorded in November and came in worse than the market expectation for an increase of 0.2%.
On a yearly basis, Retail Sales rose by 1.8%, falling short of analysts' estimate of 2.5%.
Market reaction
These data don't seem to be having a noticeable impact on the Euro's valuation. At the time of press, EUR/USD was trading virtually unchanged on the day at 1.0395.
-
08:01
Turkey Trade Balance fell from previous -7.46B to -8.78B in December
-
08:00
Germany Retail Sales (MoM) came in at -1.6% below forecasts (0.2%) in December
-
08:00
United Kingdom Nationwide Housing Prices n.s.a (YoY) came in at 4.1%, below expectations (4.3%) in January
-
08:00
United Kingdom Nationwide Housing Prices s.a (MoM) below forecasts (0.3%) in January: Actual (0.1%)
-
08:00
Germany Retail Sales (YoY) below forecasts (2.5%) in December: Actual (1.8%)
-
07:53
EUR/JPY Price Forecast: Key downside target emerges near 160.00
- EUR/JPY trades in positive territory to around 160.75 in Friday’s early European session.
- The cross keeps the negative view below the 100-period EMA with the bearish RSI indicator.
- The key downside target to watch is 160.00; the immediate resistance level emerges near 161.90.
The EUR/JPY cross gains momentum to around 160.75, snapping the two-day losing streak during the early European session on Friday. The positive risk tone undermines a safe-haven currency like the Japanese Yen (JPY) against the Euro (EUR). However, the downside for the JPY might be limited as the hotter consumer prices in Tokyo keep hopes alive for further Bank of Japan (BoJ) policy tightening.
According to the 4-hour chart, the bearish outlook of EUR/JPY prevails as the cross is below the key 100-period Exponential Moving Average (EMA). The downward momentum is reinforced by the Relative Strength Index (RSI), which stands below the midline near 40.70, supporting the sellers in the near term.
The crucial support level for the cross is seen at 160.00, representing the psychological level and the lower limit of the Bollinger Band. Any follow-through selling below the mentioned level could see a drop to 159.11, the low of December 19, 2024. Further south, the next contention level to watch is 158.65, the low of December 11.
The first upside barrier for EUR/JPY emerges near 161.90, the 100-period EMA. A decisive break above this level could pave the way to 163.00, the upper boundary of the Bollinger Band. Extended gains could see a rally to the next hurdle at 164.08, the high of January 24.EUR/JPY 4-hour chart
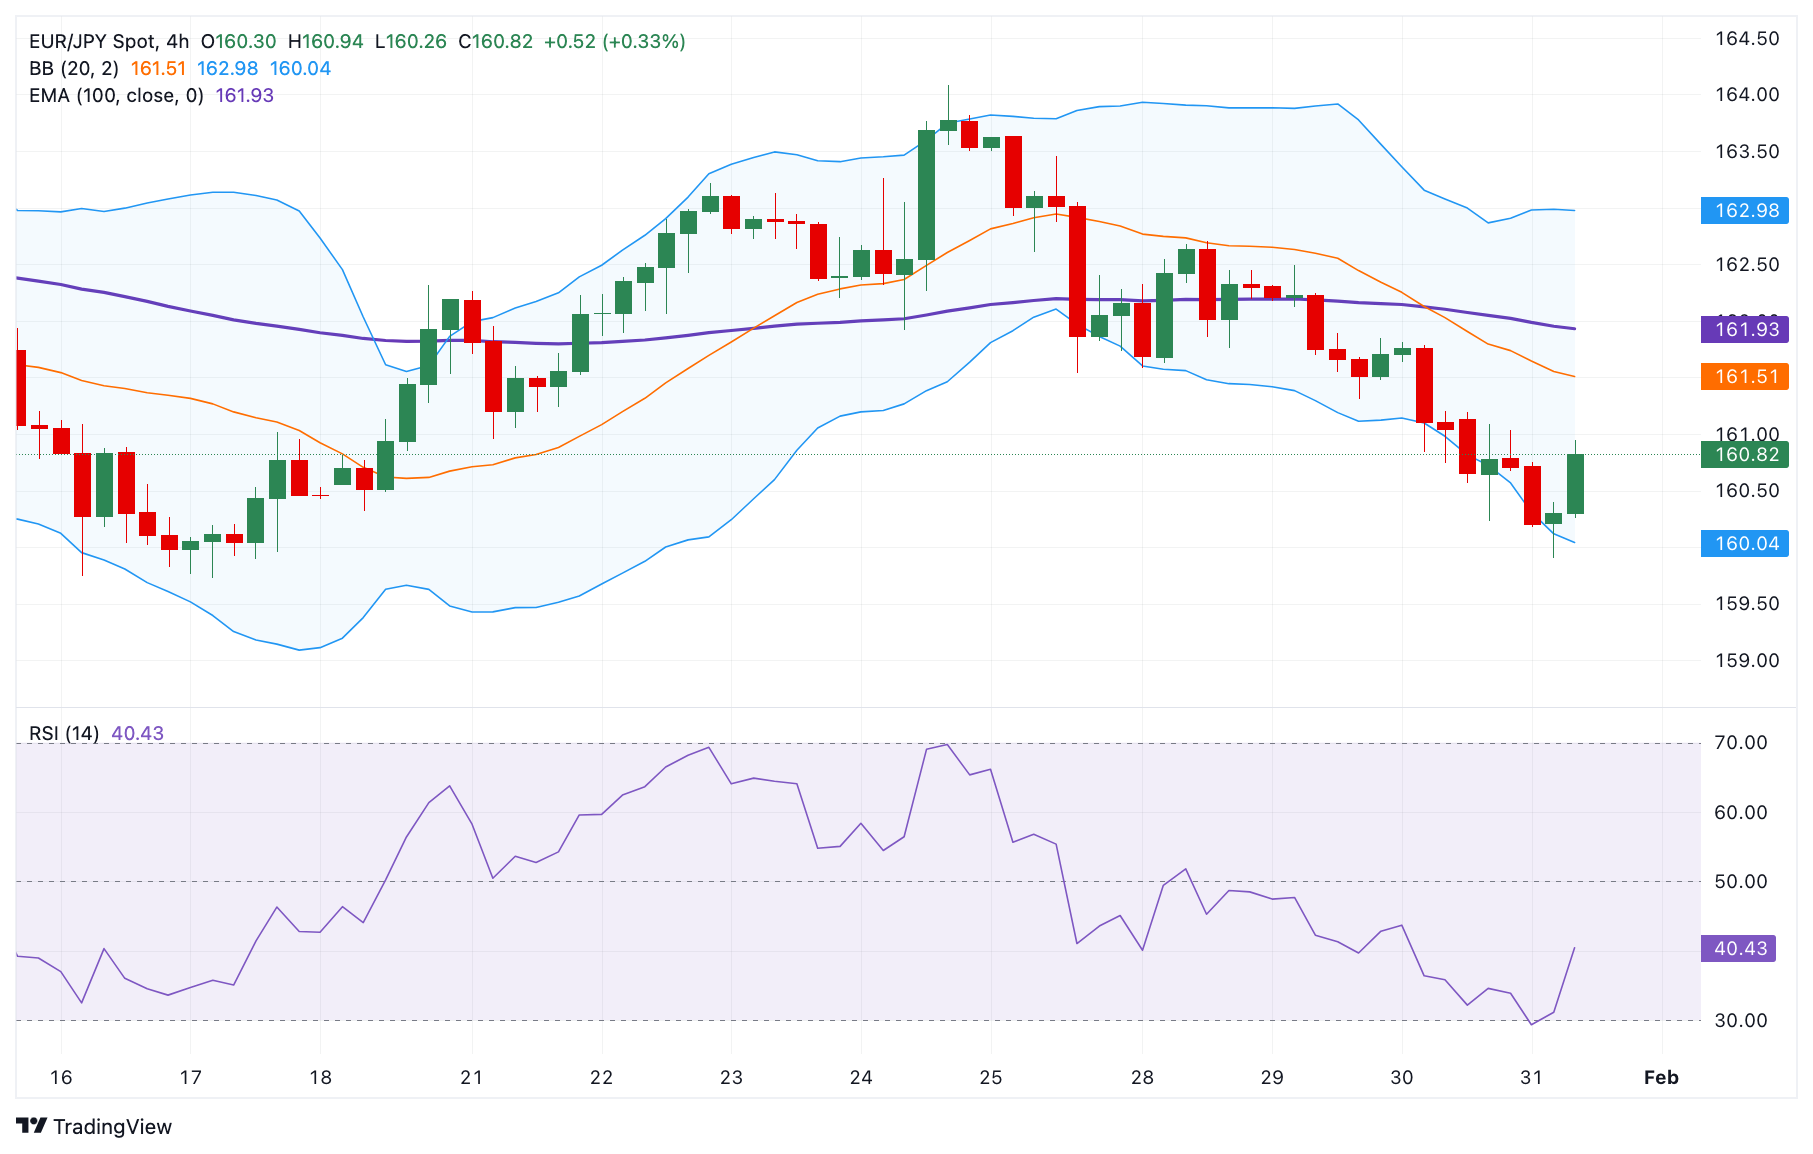
Japanese Yen FAQs
The Japanese Yen (JPY) is one of the world’s most traded currencies. Its value is broadly determined by the performance of the Japanese economy, but more specifically by the Bank of Japan’s policy, the differential between Japanese and US bond yields, or risk sentiment among traders, among other factors.
One of the Bank of Japan’s mandates is currency control, so its moves are key for the Yen. The BoJ has directly intervened in currency markets sometimes, generally to lower the value of the Yen, although it refrains from doing it often due to political concerns of its main trading partners. The BoJ ultra-loose monetary policy between 2013 and 2024 caused the Yen to depreciate against its main currency peers due to an increasing policy divergence between the Bank of Japan and other main central banks. More recently, the gradually unwinding of this ultra-loose policy has given some support to the Yen.
Over the last decade, the BoJ’s stance of sticking to ultra-loose monetary policy has led to a widening policy divergence with other central banks, particularly with the US Federal Reserve. This supported a widening of the differential between the 10-year US and Japanese bonds, which favored the US Dollar against the Japanese Yen. The BoJ decision in 2024 to gradually abandon the ultra-loose policy, coupled with interest-rate cuts in other major central banks, is narrowing this differential.
The Japanese Yen is often seen as a safe-haven investment. This means that in times of market stress, investors are more likely to put their money in the Japanese currency due to its supposed reliability and stability. Turbulent times are likely to strengthen the Yen’s value against other currencies seen as more risky to invest in.
-
07:50
WTI rises to near $73.00 due to rising supply concerns following Trump’s tariff threats
- WTI price gains ground due to potential supply disruptions following Trump’s tariff threats.
- Trump stated to plan on Thursday evening on the 25% tariff on Canadian Oil, but no updates have emerged.
- Traders await the OPEC+ meeting on February 3, as Trump pressures the group, particularly Saudi Arabia, to reduce oil prices.
West Texas Intermediate (WTI) crude Oil price appreciates after two days of losses, trading around $73.00 during Asian market hours on Friday. The rise in crude Oil prices comes amid concerns over potential supply disruptions as markets assess the risk of a 25% tariff imposed by US President Donald Trump on Mexico and Canada—the two largest crude exporters to the United States (US). These tariffs, which could take effect on February 1, are intended to pressure both countries to halt fentanyl shipments across US borders.
However, it remains uncertain whether crude Oil will be included in the tariffs. On Thursday afternoon, Trump stated that he would likely make a decision that evening on whether to apply the 25% tariff to Canadian Oil, but no further updates have emerged. In 2023, Canada supplied 3.9 million barrels per day (bpd) of crude to the US, accounting for a significant portion of the 6.5 million bpd total imports, while Mexico contributed 733,000 bpd, according to data from the US Energy Information Administration. Trump also indicated that China, the world’s largest oil importer, would face tariffs, with his administration actively working on their implementation.
"Sanctions on Russia, stopping purchases of Venezuelan Oil, and applying maximum pressure on Iran will elevate the geopolitical risk premium on Oil," said ANZ Bank analyst Daniel Hynes. "This could be further impacted by efforts to refill the strategic petroleum reserve, adding to Oil demand."
Meanwhile, investors are looking ahead to the OPEC+ meeting on February 3, as Trump urges the group—particularly Saudi Arabia—to lower Oil prices. Market participants expect OPEC+ to maintain its current supply policy, with any additional production increases likely to begin in April. Kazakhstan’s energy minister stated on Wednesday that the group will discuss Trump's plans to boost US oil production and take a unified stance on the matter during next week’s meeting.
WTI Oil FAQs
WTI Oil is a type of Crude Oil sold on international markets. The WTI stands for West Texas Intermediate, one of three major types including Brent and Dubai Crude. WTI is also referred to as “light” and “sweet” because of its relatively low gravity and sulfur content respectively. It is considered a high quality Oil that is easily refined. It is sourced in the United States and distributed via the Cushing hub, which is considered “The Pipeline Crossroads of the World”. It is a benchmark for the Oil market and WTI price is frequently quoted in the media.
Like all assets, supply and demand are the key drivers of WTI Oil price. As such, global growth can be a driver of increased demand and vice versa for weak global growth. Political instability, wars, and sanctions can disrupt supply and impact prices. The decisions of OPEC, a group of major Oil-producing countries, is another key driver of price. The value of the US Dollar influences the price of WTI Crude Oil, since Oil is predominantly traded in US Dollars, thus a weaker US Dollar can make Oil more affordable and vice versa.
The weekly Oil inventory reports published by the American Petroleum Institute (API) and the Energy Information Agency (EIA) impact the price of WTI Oil. Changes in inventories reflect fluctuating supply and demand. If the data shows a drop in inventories it can indicate increased demand, pushing up Oil price. Higher inventories can reflect increased supply, pushing down prices. API’s report is published every Tuesday and EIA’s the day after. Their results are usually similar, falling within 1% of each other 75% of the time. The EIA data is considered more reliable, since it is a government agency.
OPEC (Organization of the Petroleum Exporting Countries) is a group of 12 Oil-producing nations who collectively decide production quotas for member countries at twice-yearly meetings. Their decisions often impact WTI Oil prices. When OPEC decides to lower quotas, it can tighten supply, pushing up Oil prices. When OPEC increases production, it has the opposite effect. OPEC+ refers to an expanded group that includes ten extra non-OPEC members, the most notable of which is Russia.
-
07:01
NZD/USD sticks to modest recovery gains below mid-0.5600s, upside seems limited
- NZD/USD stages a modest recovery from over a one-week low amid subdued USD demand.
- The Fed’s hawkish pause and rebounding US bond yields act as a tailwind for the Greenback.
- Trade war fears might contribute to capping the pair ahead of the US PCE Price Index data.
The NZD/USD pair attracts some buyers during the Asian session on Friday and for now, seems to have snapped a three-day losing streak to over a one-week low, around the 0.5620 area touched the previous day. Spot prices currently trade around the 0.5640-0.5645 region, though the upside seems limited.
A generally positive tone around the equity markets caps the US Dollar (USD) recovery from over a one-month low touched earlier this week and turns out to be a key factor lending support to the risk-sensitive Kiwi. Apart from this, the uptick lacks any obvious fundamental catalyst and runs the risk of fizzling out rather quickly amid a bearish fundamental backdrop.
The Federal Reserve's (Fed) hawkish pause on Wednesday marks a big divergence in comparison to bets for a more aggressive policy easing by the Reserve Bank of New Zealand (RBNZ). This, in turn, warrants some caution before placing fresh bullish bets around the NZD/USD pair amid persistent worries about US President Donald Trump's protectionist trade tariffs.
Furthermore, expectations that Trump's policies would reignite inflation trigger a modest bounce in the US Treasury bond yields. This assists the USD to preserve its weekly recovery gains from over a one-month low touched earlier this week, which should contribute to capping the NZD/USD pair ahead of the US Personal Consumption Expenditure (PCE) Price Index.
New Zealand Dollar FAQs
The New Zealand Dollar (NZD), also known as the Kiwi, is a well-known traded currency among investors. Its value is broadly determined by the health of the New Zealand economy and the country’s central bank policy. Still, there are some unique particularities that also can make NZD move. The performance of the Chinese economy tends to move the Kiwi because China is New Zealand’s biggest trading partner. Bad news for the Chinese economy likely means less New Zealand exports to the country, hitting the economy and thus its currency. Another factor moving NZD is dairy prices as the dairy industry is New Zealand’s main export. High dairy prices boost export income, contributing positively to the economy and thus to the NZD.
The Reserve Bank of New Zealand (RBNZ) aims to achieve and maintain an inflation rate between 1% and 3% over the medium term, with a focus to keep it near the 2% mid-point. To this end, the bank sets an appropriate level of interest rates. When inflation is too high, the RBNZ will increase interest rates to cool the economy, but the move will also make bond yields higher, increasing investors’ appeal to invest in the country and thus boosting NZD. On the contrary, lower interest rates tend to weaken NZD. The so-called rate differential, or how rates in New Zealand are or are expected to be compared to the ones set by the US Federal Reserve, can also play a key role in moving the NZD/USD pair.
Macroeconomic data releases in New Zealand are key to assess the state of the economy and can impact the New Zealand Dollar’s (NZD) valuation. A strong economy, based on high economic growth, low unemployment and high confidence is good for NZD. High economic growth attracts foreign investment and may encourage the Reserve Bank of New Zealand to increase interest rates, if this economic strength comes together with elevated inflation. Conversely, if economic data is weak, NZD is likely to depreciate.
The New Zealand Dollar (NZD) tends to strengthen during risk-on periods, or when investors perceive that broader market risks are low and are optimistic about growth. This tends to lead to a more favorable outlook for commodities and so-called ‘commodity currencies’ such as the Kiwi. Conversely, NZD tends to weaken at times of market turbulence or economic uncertainty as investors tend to sell higher-risk assets and flee to the more-stable safe havens.
US-China Trade War FAQs
Generally speaking, a trade war is an economic conflict between two or more countries due to extreme protectionism on one end. It implies the creation of trade barriers, such as tariffs, which result in counter-barriers, escalating import costs, and hence the cost of living.
An economic conflict between the United States (US) and China began early in 2018, when President Donald Trump set trade barriers on China, claiming unfair commercial practices and intellectual property theft from the Asian giant. China took retaliatory action, imposing tariffs on multiple US goods, such as automobiles and soybeans. Tensions escalated until the two countries signed the US-China Phase One trade deal in January 2020. The agreement required structural reforms and other changes to China’s economic and trade regime and pretended to restore stability and trust between the two nations. However, the Coronavirus pandemic took the focus out of the conflict. Yet, it is worth mentioning that President Joe Biden, who took office after Trump, kept tariffs in place and even added some additional levies.
The return of Donald Trump to the White House as the 47th US President has sparked a fresh wave of tensions between the two countries. During the 2024 election campaign, Trump pledged to impose 60% tariffs on China once he returned to office, which he did on January 20, 2025. With Trump back, the US-China trade war is meant to resume where it was left, with tit-for-tat policies affecting the global economic landscape amid disruptions in global supply chains, resulting in a reduction in spending, particularly investment, and directly feeding into the Consumer Price Index inflation.
-
07:00
USD/CHF holds positive ground near 0.9100, eyes on US PCE release
- USD/CHF posts modest gains to around 0.9100 in Friday’s early European session.
- The US economy grew at a slower-than-expected pace in Q4.
- The safe-haven flows could support the Swiss Franc.
The USD/CHF pair trades with mild gains to near 0.9100 during the early European session on Friday. The hawkish hold from the US Federal Reserve (Fed) provides some support to the US Dollar (USD). Investors will take more cues from the US December Personal Consumption Expenditures (PCE) inflation data, which is due later on Friday. Also, Fed Governor Michelle Bowman is set to speak.
The US central bank left interest rates unchanged Wednesday. Fed Chair Jerome Powell said in a press conference that the US economy remains strong, while inflation remains somewhat elevated. Therefore, the central bank doesn’t need to be in a hurry to adjust its policy stance. Following the January Fed meeting, the markets see less than a 50% odds that the Fed will cut rates before its June meeting, per the CME FedWatch Tool. This, in turn, lift the Greenback against the Swiss Franc (CHF).
Nonetheless, the downbeat US Gross Domestic Product (GDP) data undermines the USD. The Bureau of Economic Analysis's advance estimate of fourth quarter US GDP revealed the US economy expanded at an annualized pace of 2.3% in Q4, below the 2.6% growth estimated. The reading came in weaker than the 3.1% growth seen in Q3.
A ceasefire between Israel and Hamas in Gaza went into effect a week ago. Meanwhile, Lebanon the November ceasefire in Lebanon is holding despite ongoing Israeli airstrikes on Hezbollah targets. Investors will closely monitor the development surrounding geopolitical risks in the Middle East. Any signs of escalating geopolitical tensions in the region could boost the safe-haven flows, benefitting the Swiss Franc.Swiss Franc FAQs
The Swiss Franc (CHF) is Switzerland’s official currency. It is among the top ten most traded currencies globally, reaching volumes that well exceed the size of the Swiss economy. Its value is determined by the broad market sentiment, the country’s economic health or action taken by the Swiss National Bank (SNB), among other factors. Between 2011 and 2015, the Swiss Franc was pegged to the Euro (EUR). The peg was abruptly removed, resulting in a more than 20% increase in the Franc’s value, causing a turmoil in markets. Even though the peg isn’t in force anymore, CHF fortunes tend to be highly correlated with the Euro ones due to the high dependency of the Swiss economy on the neighboring Eurozone.
The Swiss Franc (CHF) is considered a safe-haven asset, or a currency that investors tend to buy in times of market stress. This is due to the perceived status of Switzerland in the world: a stable economy, a strong export sector, big central bank reserves or a longstanding political stance towards neutrality in global conflicts make the country’s currency a good choice for investors fleeing from risks. Turbulent times are likely to strengthen CHF value against other currencies that are seen as more risky to invest in.
The Swiss National Bank (SNB) meets four times a year – once every quarter, less than other major central banks – to decide on monetary policy. The bank aims for an annual inflation rate of less than 2%. When inflation is above target or forecasted to be above target in the foreseeable future, the bank will attempt to tame price growth by raising its policy rate. Higher interest rates are generally positive for the Swiss Franc (CHF) as they lead to higher yields, making the country a more attractive place for investors. On the contrary, lower interest rates tend to weaken CHF.
Macroeconomic data releases in Switzerland are key to assessing the state of the economy and can impact the Swiss Franc’s (CHF) valuation. The Swiss economy is broadly stable, but any sudden change in economic growth, inflation, current account or the central bank’s currency reserves have the potential to trigger moves in CHF. Generally, high economic growth, low unemployment and high confidence are good for CHF. Conversely, if economic data points to weakening momentum, CHF is likely to depreciate.
As a small and open economy, Switzerland is heavily dependent on the health of the neighboring Eurozone economies. The broader European Union is Switzerland’s main economic partner and a key political ally, so macroeconomic and monetary policy stability in the Eurozone is essential for Switzerland and, thus, for the Swiss Franc (CHF). With such dependency, some models suggest that the correlation between the fortunes of the Euro (EUR) and the CHF is more than 90%, or close to perfect.
-
06:53
BOJ’s Ueda: Underlying inflation is still somewhat below 2%
Bank of Japan (BoJ) Governor Kazuo Ueda said on Friday that underlying inflation is still somewhat below 2%. Ueda added that the Japanese central bank would maintain an accommodative policy to support price trends.
Key quotes
Recent inflation is driven mostly by cost-push factors.
Cost-push factors are likely to dissipate in the middle to late this year.
BOJ to maintain an accommodative policy to support price trends.
Mindful that FX moves have various effects on the economy.
We do not conduct monetary policy targeting foreign exchange.
Thinks that markets understand this monetary policy stance.
Our thinking has been communicated through markets.
Market reaction
At the time of writing, USD/JPY is trading 0.36% higher on the day to trade at 154.82.
Japanese Yen FAQs
The Japanese Yen (JPY) is one of the world’s most traded currencies. Its value is broadly determined by the performance of the Japanese economy, but more specifically by the Bank of Japan’s policy, the differential between Japanese and US bond yields, or risk sentiment among traders, among other factors.
One of the Bank of Japan’s mandates is currency control, so its moves are key for the Yen. The BoJ has directly intervened in currency markets sometimes, generally to lower the value of the Yen, although it refrains from doing it often due to political concerns of its main trading partners. The BoJ ultra-loose monetary policy between 2013 and 2024 caused the Yen to depreciate against its main currency peers due to an increasing policy divergence between the Bank of Japan and other main central banks. More recently, the gradually unwinding of this ultra-loose policy has given some support to the Yen.
Over the last decade, the BoJ’s stance of sticking to ultra-loose monetary policy has led to a widening policy divergence with other central banks, particularly with the US Federal Reserve. This supported a widening of the differential between the 10-year US and Japanese bonds, which favored the US Dollar against the Japanese Yen. The BoJ decision in 2024 to gradually abandon the ultra-loose policy, coupled with interest-rate cuts in other major central banks, is narrowing this differential.
The Japanese Yen is often seen as a safe-haven investment. This means that in times of market stress, investors are more likely to put their money in the Japanese currency due to its supposed reliability and stability. Turbulent times are likely to strengthen the Yen’s value against other currencies seen as more risky to invest in.
-
06:42
EUR/GBP breaks below 0.8350 as traders expect more ECB rate cuts
- EUR/GBP loses ground as the Euro struggles amid more interest rate cuts by the ECB in the future.
- ECB reduced its Deposit Facility Rate by 25 basis points to 2.75%, with the Main Refinancing Operations Rate sliding to 2.9%.
- The BoE is expected to deliver a 25 basis point interest rate cut in February.
EUR/GBP offers its recent gains from the previous session, trading around 0.8360 during the Asian hours on Friday. The EUR/GBP cross depreciates as the Euro struggles amid increased expectations of further interest rate cuts by the European Central Bank (ECB).
On Thursday, the European Central Bank (ECB) decided to cut its Deposit Facility Rate by 25 basis points (bps) to 2.75%, with the Main Refinancing Operations Rate sliding to 2.9%, as expected. Traders had already priced in a 25-bps interest rate reduction on the assumption that inflationary pressures in the Eurozone are sustainably on track to return to the central bank’s target of 2%.
Moreover, the downbeat Eurozone GDP report contributes to the EUR’s downside. Preliminary data released by Eurostat on Thursday showed that the Eurozone economy flatlined in the fourth quarter (Q4) of 2024, following a 0.4% expansion in Q3. This reading came in weaker than the expectation of 0.1% growth. Market players will take more cues from a slew of Germany’s data including Retail Sales, Unemployment Rate, and Consumer Price Index (CPI) data, which will be released later on Friday.
The downside of the EUR/GBP cross may be limited as the Pound Sterling (GBP) remains under pressure amid expectations that the Bank of England (BoE) will resume its rate-cut cycle at next week’s policy meeting. The BoE is anticipated to lower interest rates by 25 basis points (bps) to 4.5% in February, marking its third cut since August, when borrowing costs peaked at 5.25%.
Interest rates FAQs
Interest rates are charged by financial institutions on loans to borrowers and are paid as interest to savers and depositors. They are influenced by base lending rates, which are set by central banks in response to changes in the economy. Central banks normally have a mandate to ensure price stability, which in most cases means targeting a core inflation rate of around 2%. If inflation falls below target the central bank may cut base lending rates, with a view to stimulating lending and boosting the economy. If inflation rises substantially above 2% it normally results in the central bank raising base lending rates in an attempt to lower inflation.
Higher interest rates generally help strengthen a country’s currency as they make it a more attractive place for global investors to park their money.
Higher interest rates overall weigh on the price of Gold because they increase the opportunity cost of holding Gold instead of investing in an interest-bearing asset or placing cash in the bank. If interest rates are high that usually pushes up the price of the US Dollar (USD), and since Gold is priced in Dollars, this has the effect of lowering the price of Gold.
The Fed funds rate is the overnight rate at which US banks lend to each other. It is the oft-quoted headline rate set by the Federal Reserve at its FOMC meetings. It is set as a range, for example 4.75%-5.00%, though the upper limit (in that case 5.00%) is the quoted figure. Market expectations for future Fed funds rate are tracked by the CME FedWatch tool, which shapes how many financial markets behave in anticipation of future Federal Reserve monetary policy decisions.
-
06:08
AUD/JPY holds gains above 96.00, upside seems limited due to Trump's tariff threats
- AUD/JPY may lose ground as risk aversion rises, driven by renewed tariff threats from US President Donald Trump.
- Trump stated that China would face tariffs, with his administration actively working on their implementation.
- Tokyo's Consumer Price Index climbed to 3.4% YoY in January, reaching its highest level since April 2023.
AUD/JPY halts its two days of losses, trading around 96.00 during the Asian hours on Friday. However, the upside of the AUD/JPY cross could be restrained as the Australian Dollar (AUD) may struggle amid the increased likelihood of the Reserve Bank of Australia (RBA) rate cut in February.
The ASX 30-Day Interbank Cash Rate Futures February 2025 contract indicates a 95% expectation of a 25 basis point reduction in the cash rate to 4.35% at the central bank’s meeting on February 18. Additionally, ANZ, CBA, Westpac, and now National Australia Bank (NAB) all anticipate a 25 basis point (bps) rate cut from the RBA in February.
Additionally, the AUD could face challenges amid increased risk aversion US President Donald Trump reiterated his plan on Thursday to impose 25% tariffs on Canada and Mexico but did not specify a timeline for China. However, Trump stated that China would also face tariffs, with his administration actively working on their implementation.
Given China's significant trade relationship with Australia, any indication of a renewed US-China trade war could put downward pressure on the AUD. Trump also announced his threat on X (formerly Twitter) to levy 100% tariffs on BRICS nations if they attempt to introduce an alternative currency to challenge the US dollar in international trade.
The Japanese Yen (JPY) may strengthen as expectations for further interest rate hikes by the Bank of Japan (BoJ) grow, capping the upside of the AUD/JPY cross. On Friday, the Statistics Bureau of Japan reported that Tokyo's headline Consumer Price Index (CPI) rose to 3.4% year-over-year in January, from the previous 3.0% increase, marking its highest level since April 2023.
Additionally, core CPI, which excludes volatile fresh food prices, increased to 2.5% YoY, from 2.4% in December, reaching an 11-month high. Meanwhile, a core CPI measure that strips out both fresh food and energy prices edged up to 1.9% YoY in January from the previous 1.8%, staying close to the BoJ's 2% annual target.
Tariffs FAQs
Tariffs are customs duties levied on certain merchandise imports or a category of products. Tariffs are designed to help local producers and manufacturers be more competitive in the market by providing a price advantage over similar goods that can be imported. Tariffs are widely used as tools of protectionism, along with trade barriers and import quotas.
Although tariffs and taxes both generate government revenue to fund public goods and services, they have several distinctions. Tariffs are prepaid at the port of entry, while taxes are paid at the time of purchase. Taxes are imposed on individual taxpayers and businesses, while tariffs are paid by importers.
There are two schools of thought among economists regarding the usage of tariffs. While some argue that tariffs are necessary to protect domestic industries and address trade imbalances, others see them as a harmful tool that could potentially drive prices higher over the long term and lead to a damaging trade war by encouraging tit-for-tat tariffs.
During the run-up to the presidential election in November 2024, Donald Trump made it clear that he intends to use tariffs to support the US economy and American producers. In 2024, Mexico, China and Canada accounted for 42% of total US imports. In this period, Mexico stood out as the top exporter with $466.6 billion, according to the US Census Bureau. Hence, Trump wants to focus on these three nations when imposing tariffs. He also plans to use the revenue generated through tariffs to lower personal income taxes.
-
06:07
Japan Housing Starts (YoY) above expectations (-3.9%) in December: Actual (-2.5%)
-
06:06
Japan Annualized Housing Starts up to 0.787M in December from previous 0.775M
-
06:06
Japan Annualized Housing Starts: 787M (December) vs 0.775M
-
06:00
Japan Construction Orders (YoY) increased to 8.1% in December from previous -10.2%
-
05:55
USD/CAD flat lines below 1.4500, looks to US PCE Price Index for fresh impetus
- USD/CAD stalls the overnight pullback from a multi-year peak.
- The divergent BoC-Fed outlook acts as a tailwind for the pair.
- Rebounding Oil prices underpin the Loonie and cap the major.
- Traders now look to the US PCE Price Index for a fresh impetus.
The USD/CAD pair finds some support near the 1.4470 region during the Asian session on Friday and for now, seems to have stalled the previous day's pullback from its highest level since March 2020. Spot prices currently trade just below the 1.4500 psychological mark and remain on track to register strong weekly gains.
The Canadian Dollar (CAD) continues to be weighed down by the Bank of Canada's (BoC) relative dovish stance and concerns about US President Donald Trump's threatened trade tariffs. In fact, the BoC decided to cut interest rates for the sixth time in a row since June and announced an end to its quantitative tightening program. Moreover, Trump reiterated his threat to impose 25% tariffs on Mexico and Canada – the top two US trade partners. This is seen as a key factor acting as a tailwind for the USD/CAD pair.
The US Dollar (USD), on the other hand, manages to preserve weekly recovery gains in the wake of the Federal Reserve's (Fed) hawkish pause on Wednesday and a modest bounce in the US Treasury bond yields. This turns out to be another factor lending some support to the USD/CAD pair. That said, the uncertainty over the Trump administration's economic policies caps the USD. Apart from this, a further recovery in Oil prices underpins the commodity-linked Loonie and caps the upside for the currency pair.
Traders also seem reluctant to place aggressive bets ahead of Friday's release of the monthly Canadian GDP and the US Personal Consumption Expenditure (PCE) Price Index – the Fed's preferred inflation gauge. The latter will play a key role in influencing demand for the USD, which, along with Oil price dynamics, should provide some impetus to the USD/CAD pair later during the US session. Nevertheless, the fundamental backdrop suggests that the path of least resistance for spot prices remains to the upside.
Economic Indicator
Personal Consumption Expenditures - Price Index (YoY)
The Personal Consumption Expenditures (PCE), released by the US Bureau of Economic Analysis on a monthly basis, measures the changes in the prices of goods and services purchased by consumers in the United States (US). The YoY reading compares prices in the reference month to a year earlier. Price changes may cause consumers to switch from buying one good to another and the PCE Deflator can account for such substitutions. This makes it the preferred measure of inflation for the Federal Reserve. Generally, a high reading is bullish for the US Dollar (USD), while a low reading is bearish.
Read more.Next release: Fri Jan 31, 2025 13:30
Frequency: Monthly
Consensus: 2.6%
Previous: 2.4%
Source: US Bureau of Economic Analysis
Tariffs FAQs
Tariffs are customs duties levied on certain merchandise imports or a category of products. Tariffs are designed to help local producers and manufacturers be more competitive in the market by providing a price advantage over similar goods that can be imported. Tariffs are widely used as tools of protectionism, along with trade barriers and import quotas.
Although tariffs and taxes both generate government revenue to fund public goods and services, they have several distinctions. Tariffs are prepaid at the port of entry, while taxes are paid at the time of purchase. Taxes are imposed on individual taxpayers and businesses, while tariffs are paid by importers.
There are two schools of thought among economists regarding the usage of tariffs. While some argue that tariffs are necessary to protect domestic industries and address trade imbalances, others see them as a harmful tool that could potentially drive prices higher over the long term and lead to a damaging trade war by encouraging tit-for-tat tariffs.
During the run-up to the presidential election in November 2024, Donald Trump made it clear that he intends to use tariffs to support the US economy and American producers. In 2024, Mexico, China and Canada accounted for 42% of total US imports. In this period, Mexico stood out as the top exporter with $466.6 billion, according to the US Census Bureau. Hence, Trump wants to focus on these three nations when imposing tariffs. He also plans to use the revenue generated through tariffs to lower personal income taxes.
-
05:38
EUR/USD attracts some sellers below 1.0400 ahead of German Retail Sales data
- EUR/USD trades in negative territory near 1.0385 in Friday’s Asian session.
- The ECB cut borrowing costs by 25 bps on Thursday, as widely expected.
- US GDP came in weaker-than-expected in Q4.
The EUR/USD pair attracts some sellers to around 1.0385 during the Asian trading hours on Friday. The expectation of further interest rate cuts by the European Central Bank (ECB) weighs on the Euro (EUR) against the Greenback. Investors await more clarity about fresh tariff threats by US President Donald Trump for fresh catalysts.
As widely expected, the ECB decided to cut the deposit facility at its January meeting on Thursday, bringing its key rate to 2.75%. The ECB left the door open to additional reductions amid an uncertain economic outlook and worries about persistent inflation, which might drag the shared currency lower.
Preliminary data released by Eurostat on Thursday showed that the euro zone economy flatlined in the fourth quarter (Q4) of 2024, following a 0.4% expansion in Q3. This reading came in weaker than the expectation of 0.1% growth. The downbeat Eurozone GDP report contributes to the EUR’s downside. Market players will take more cues from Germany’s Retail Sales and Unemployment Rate data for December, which will be released later on Friday. If the reports show a stronger outcome, this could help limit the pair’s losses.
Across the pond, the US Federal Reserve (Fed) on Wednesday left its benchmark overnight interest rate unchanged in the 4.25%-4.50% range. Fed Chair Jerome Powell signaled that there be no rush to cut them again until inflation and jobs data made it appropriate, supporting the US Dollar (USD). However, the weaker-than-expected US GDP data undermine the Greenback. Data released by the Commerce Department on Thursday revealed that the US economy grew by an annualized 2.3% in Q4, slightly below expectations.Euro FAQs
The Euro is the currency for the 19 European Union countries that belong to the Eurozone. It is the second most heavily traded currency in the world behind the US Dollar. In 2022, it accounted for 31% of all foreign exchange transactions, with an average daily turnover of over $2.2 trillion a day. EUR/USD is the most heavily traded currency pair in the world, accounting for an estimated 30% off all transactions, followed by EUR/JPY (4%), EUR/GBP (3%) and EUR/AUD (2%).
The European Central Bank (ECB) in Frankfurt, Germany, is the reserve bank for the Eurozone. The ECB sets interest rates and manages monetary policy. The ECB’s primary mandate is to maintain price stability, which means either controlling inflation or stimulating growth. Its primary tool is the raising or lowering of interest rates. Relatively high interest rates – or the expectation of higher rates – will usually benefit the Euro and vice versa. The ECB Governing Council makes monetary policy decisions at meetings held eight times a year. Decisions are made by heads of the Eurozone national banks and six permanent members, including the President of the ECB, Christine Lagarde.
Eurozone inflation data, measured by the Harmonized Index of Consumer Prices (HICP), is an important econometric for the Euro. If inflation rises more than expected, especially if above the ECB’s 2% target, it obliges the ECB to raise interest rates to bring it back under control. Relatively high interest rates compared to its counterparts will usually benefit the Euro, as it makes the region more attractive as a place for global investors to park their money.
Data releases gauge the health of the economy and can impact on the Euro. Indicators such as GDP, Manufacturing and Services PMIs, employment, and consumer sentiment surveys can all influence the direction of the single currency. A strong economy is good for the Euro. Not only does it attract more foreign investment but it may encourage the ECB to put up interest rates, which will directly strengthen the Euro. Otherwise, if economic data is weak, the Euro is likely to fall. Economic data for the four largest economies in the euro area (Germany, France, Italy and Spain) are especially significant, as they account for 75% of the Eurozone’s economy.
Another significant data release for the Euro is the Trade Balance. This indicator measures the difference between what a country earns from its exports and what it spends on imports over a given period. If a country produces highly sought after exports then its currency will gain in value purely from the extra demand created from foreign buyers seeking to purchase these goods. Therefore, a positive net Trade Balance strengthens a currency and vice versa for a negative balance.
-
05:36
India Gold price today: Gold steadies, according to FXStreet data
Gold prices remained broadly unchanged in India on Friday, according to data compiled by FXStreet.
The price for Gold stood at 7,787.15 Indian Rupees (INR) per gram, broadly stable compared with the INR 7,788.09 it cost on Thursday.
The price for Gold was broadly steady at INR 90,827.74 per tola from INR 90,838.78 per tola a day earlier.
Unit measure Gold Price in INR 1 Gram 7,787.15 10 Grams 77,872.02 Tola 90,827.74 Troy Ounce 242,207.50 FXStreet calculates Gold prices in India by adapting international prices (USD/INR) to the local currency and measurement units. Prices are updated daily based on the market rates taken at the time of publication. Prices are just for reference and local rates could diverge slightly.
Gold FAQs
Gold has played a key role in human’s history as it has been widely used as a store of value and medium of exchange. Currently, apart from its shine and usage for jewelry, the precious metal is widely seen as a safe-haven asset, meaning that it is considered a good investment during turbulent times. Gold is also widely seen as a hedge against inflation and against depreciating currencies as it doesn’t rely on any specific issuer or government.
Central banks are the biggest Gold holders. In their aim to support their currencies in turbulent times, central banks tend to diversify their reserves and buy Gold to improve the perceived strength of the economy and the currency. High Gold reserves can be a source of trust for a country’s solvency. Central banks added 1,136 tonnes of Gold worth around $70 billion to their reserves in 2022, according to data from the World Gold Council. This is the highest yearly purchase since records began. Central banks from emerging economies such as China, India and Turkey are quickly increasing their Gold reserves.
Gold has an inverse correlation with the US Dollar and US Treasuries, which are both major reserve and safe-haven assets. When the Dollar depreciates, Gold tends to rise, enabling investors and central banks to diversify their assets in turbulent times. Gold is also inversely correlated with risk assets. A rally in the stock market tends to weaken Gold price, while sell-offs in riskier markets tend to favor the precious metal.
The price can move due to a wide range of factors. Geopolitical instability or fears of a deep recession can quickly make Gold price escalate due to its safe-haven status. As a yield-less asset, Gold tends to rise with lower interest rates, while higher cost of money usually weighs down on the yellow metal. Still, most moves depend on how the US Dollar (USD) behaves as the asset is priced in dollars (XAU/USD). A strong Dollar tends to keep the price of Gold controlled, whereas a weaker Dollar is likely to push Gold prices up.
(An automation tool was used in creating this post.)
-
05:19
GBP/USD falls to near 1.2400 due to risk-off sentiment following Trump tariff threats
- GBP/USD extends its decline as risk aversion rises, driven by renewed tariff threats from US President Donald Trump.
- Trump reiterated plans to impose a flat 25% import tax on all goods entering the US from Canada and Mexico.
- The Pound Sterling struggles as traders expect the BoE to continue its rate-cut cycle in February.
GBP/USD continues its losing streak for the fourth successive session, trading around 1.2420 during the Asian hours on Friday. This downside is attributed to the improved US Dollar (USD) amid increased risk aversion following renewed tariff threats from US President Donald Trump.
President Trump reiterated plans late Thursday to impose a flat 25% import tax on all goods entering the US from Canada and Mexico, citing concerns over fentanyl. The first wave of tariffs on both countries is set to take effect on February 1, according to Reuters. Additionally, Trump hinted at the possibility of imposing tariffs on Canadian and Mexican Oil exports. He also reaffirmed his threat on X (formerly Twitter) to levy 100% tariffs on BRICS nations if they attempt to introduce an alternative currency to challenge the US dollar in international trade.
The US Dollar Index (DXY), which measures the US Dollar’s value against six major currencies, trades above 108.00 at the time of writing. The Greenback strengthened after the US Federal Reserve (Fed) adopted a cautious tone regarding its policy decision in January.
The US Federal Reserve held its overnight borrowing rate steady in the 4.25%-4.50% range at its January meeting on Wednesday, as widely expected. This decision followed three consecutive rate cuts since September 2024, totaling a full percentage point.
During the press conference, Fed Chair Jerome Powell emphasized that the central bank would need to see “real progress on inflation or some weakness in the labor market” before considering any further adjustments to monetary policy.
The Department of Commerce reported that Gross Domestic Product Annualized (Q4) fell to 2.3% from 3.1%, missing expectations of 2.6%. Additionally, Initial Jobless Claims for the week ending January 24 came in at 207K, below forecasts of 220K but an improvement from the previous week’s 223K.
Investors now turn their attention to key US data releases later on Friday, including Personal Consumption Expenditures (PCE), Personal Income and Spending figures, and the Chicago Purchasing Managers' Index (PMI).
The Pound Sterling (GBP) faces pressure as traders anticipate the Bank of England (BoE) will resume its rate-cut cycle at next week’s policy meeting. The BoE is expected to lower interest rates by 25 basis points (bps) to 4.5% in February, marking its third cut since August, when borrowing costs peaked at 5.25%.
Pound Sterling FAQs
The Pound Sterling (GBP) is the oldest currency in the world (886 AD) and the official currency of the United Kingdom. It is the fourth most traded unit for foreign exchange (FX) in the world, accounting for 12% of all transactions, averaging $630 billion a day, according to 2022 data. Its key trading pairs are GBP/USD, also known as ‘Cable’, which accounts for 11% of FX, GBP/JPY, or the ‘Dragon’ as it is known by traders (3%), and EUR/GBP (2%). The Pound Sterling is issued by the Bank of England (BoE).
The single most important factor influencing the value of the Pound Sterling is monetary policy decided by the Bank of England. The BoE bases its decisions on whether it has achieved its primary goal of “price stability” – a steady inflation rate of around 2%. Its primary tool for achieving this is the adjustment of interest rates. When inflation is too high, the BoE will try to rein it in by raising interest rates, making it more expensive for people and businesses to access credit. This is generally positive for GBP, as higher interest rates make the UK a more attractive place for global investors to park their money. When inflation falls too low it is a sign economic growth is slowing. In this scenario, the BoE will consider lowering interest rates to cheapen credit so businesses will borrow more to invest in growth-generating projects.
Data releases gauge the health of the economy and can impact the value of the Pound Sterling. Indicators such as GDP, Manufacturing and Services PMIs, and employment can all influence the direction of the GBP. A strong economy is good for Sterling. Not only does it attract more foreign investment but it may encourage the BoE to put up interest rates, which will directly strengthen GBP. Otherwise, if economic data is weak, the Pound Sterling is likely to fall.
Another significant data release for the Pound Sterling is the Trade Balance. This indicator measures the difference between what a country earns from its exports and what it spends on imports over a given period. If a country produces highly sought-after exports, its currency will benefit purely from the extra demand created from foreign buyers seeking to purchase these goods. Therefore, a positive net Trade Balance strengthens a currency and vice versa for a negative balance.
-
05:05
Gold price stands firm near all-time peak, just below $2,800 mark
- Gold price continues to attract haven flows amid trade war fears and geopolitical risks.
- Rebounding US bond yields underpin the USD and cap the upside for the precious metal.
- Traders now look forward to the release of the US PCE Price Index for a fresh impetus.
Gold price enters a bullish consolidation phase after hitting a fresh record high during the Asian session on Friday and currently trades just below the $2,800 mark. Concerns over the potential economic fallout from US President Donald Trump's tariff plans, along with geopolitical tensions, continue to boost demand for the safe-haven bullion. Adding to this, expectations that Trump's protectionist policies would boost inflation further benefit the precious metal's hedge against rising price pressures.
That said, the Federal Reserve's (Fed) first pause since the start of its easing cycle in September and a relatively hawkish outlook triggers a modest bounce in the US Treasury bond yields. This assists the US Dollar (USD) in preserving its weekly recovery gains and keeps a lid on any further gains for the non-yielding Gold price. Traders also seem reluctant to place fresh bullish bets and now seem to wait for the release of the US Personal Consumption Expenditure (PCE) Price Index later this Friday.
Gold price remains well supported by Trump’s tariff threats-inspired haven flows
- US President Donald Trump reiterated his threat to impose 25% tariffs on Mexico and Canada – the top two US trade partners – and warned of potential 100% tariffs if BRICS attempts to replace the US Dollar.
- Japan’s Joint Staff Office (JSO) stated that a pair of Russian Tu-95 bombers escorted by two Russian fighter aircraft carried out an eight-hour flight over the Sea of Okhotsk and Sea of Japan on Thursday.
- The US Bureau of Economic Analysis' (BEA) first estimate published on Thursday showed that Gross Domestic Product (GDP) grew at an annualized rate of 2.3% during the October-December period.
- The reading marked a notable slowdown from the 3.1% expansion recorded in the previous quarter and was below the market expectation of 2.6% and boosted demand for the safe-haven Gold price.
- Investors remain concerned that Trump's protectionist policies will reignite inflationary pressures. Adding to this, the Federal Reserve's hawkish stance provides a modest lift to the US Treasury bond yields.
- The US central bank decided to stand pat at the end of a two-day meeting on Wednesday and signaled that there would be no rush to lower borrowing costs until inflation and jobs data made it appropriate.
- The US Dollar preserves its weekly recovery gains from over a one-month low, which, along with a generally positive tone around the equity markets, keeps a lid on gains for the precious metal.
- Traders now look to the release of the US Personal Consumption Expenditure (PCE) Price Index – the Fed's preferred inflation gauge – for some impetus later during the North American session.
Gold price needs to consolidate before the next leg up; bullish potential seems intact
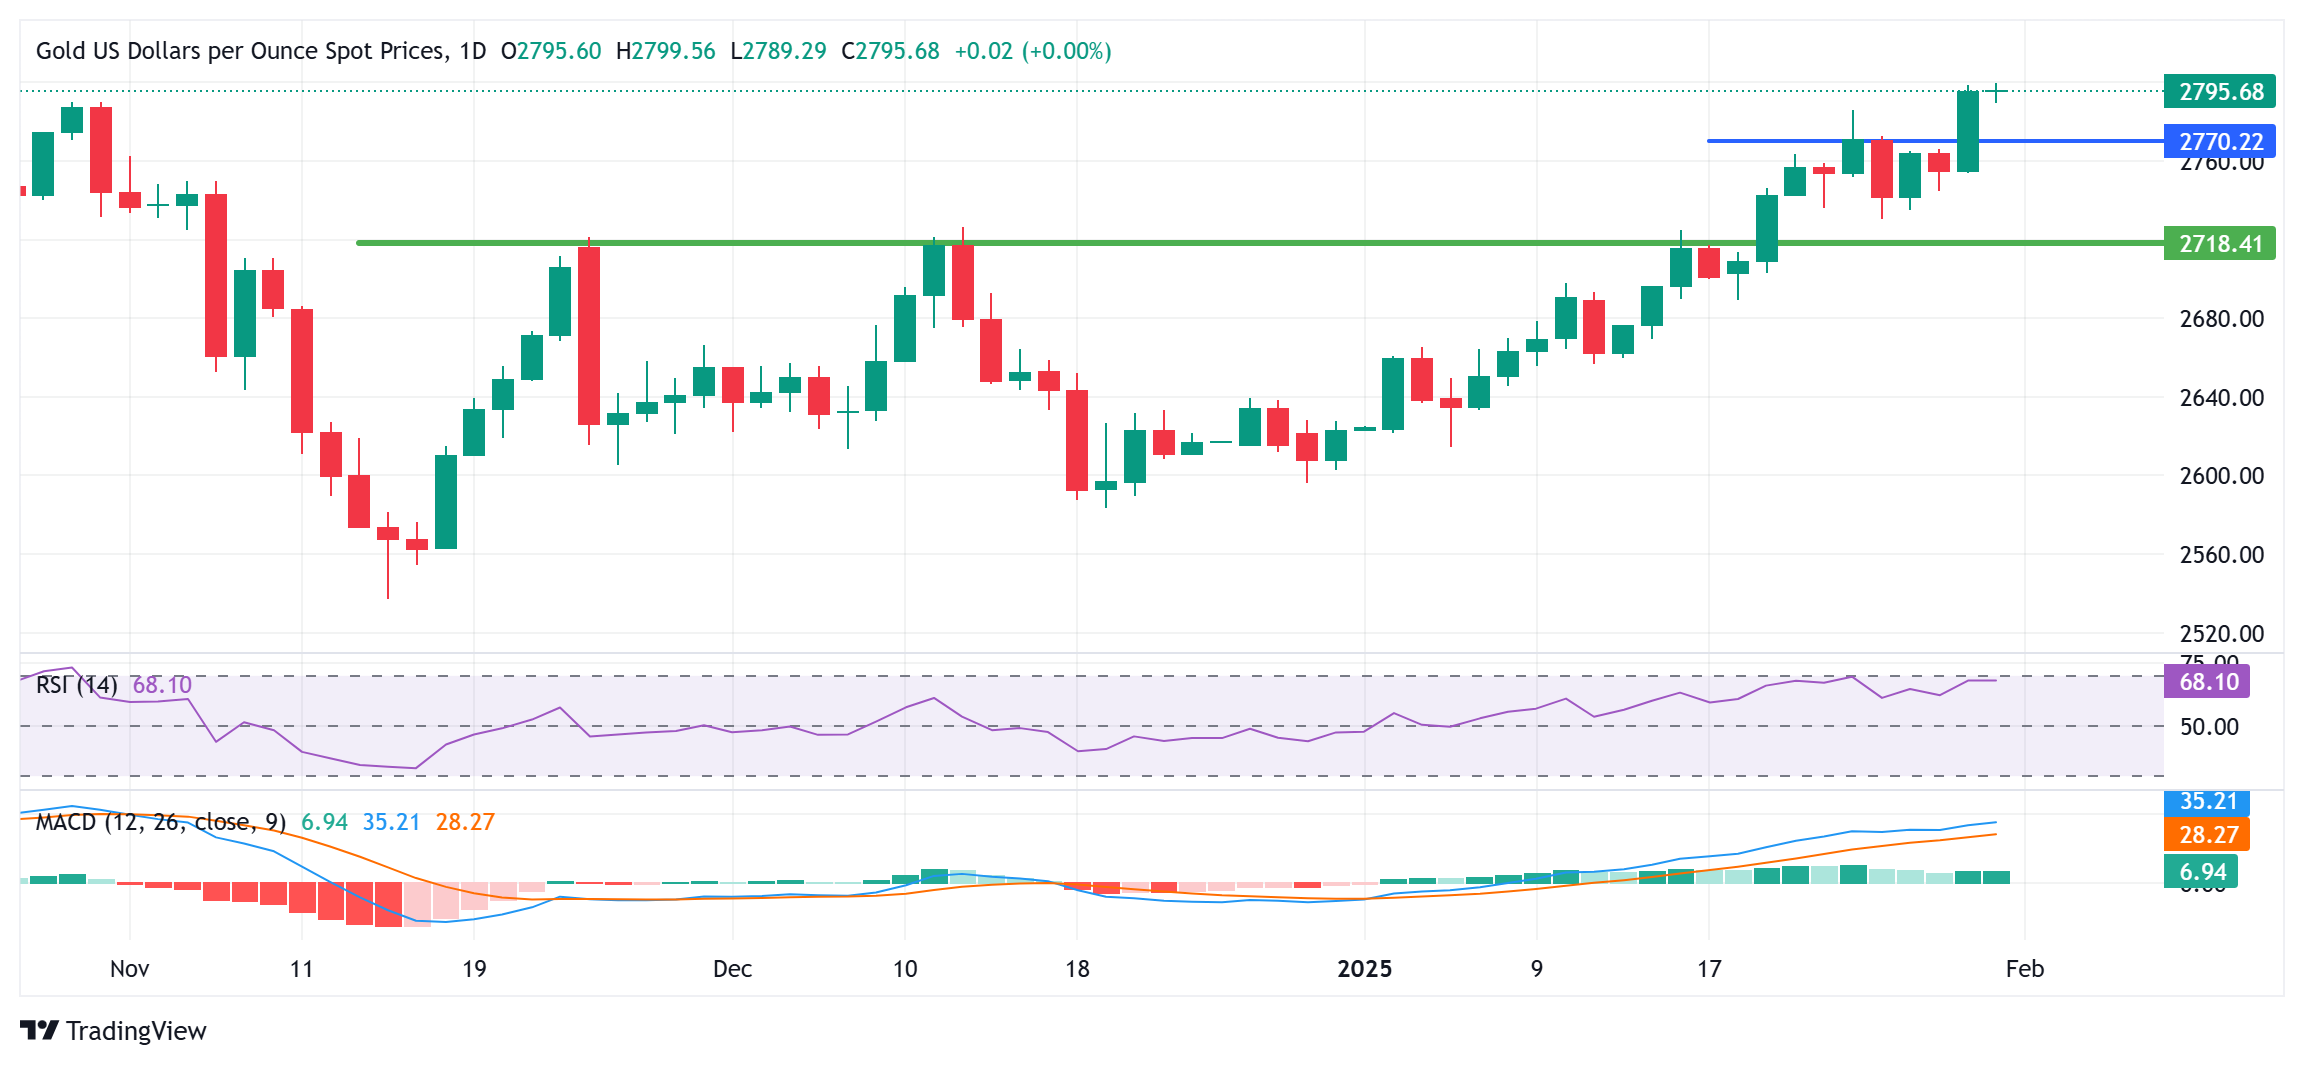
From a technical perspective, sustained strength and acceptance above the $2,800 mark will be seen as a fresh trigger for bulls. That said, the daily Relative Strength Index (RSI) is on the verge of breaking into the overbought zone. This makes it prudent to wait for some near-term consolidation or a modest pullback before placing fresh bullish bets around the Gold price and positioning for an extension of the strong move-up witnessed over the past month or so.
Meanwhile, any corrective slide is more likely to find decent support and remain limited near the $2,773-2,772 horizontal zone. This is followed by the $2,758-2,756 region, which if broken might prompt some long-unwinding and drag the Gold price further towards the $2,740 area en route to the $2,725-2,720 pivotal support. A convincing break below the latter could set the stage for some meaningful downside in the near term.
Gold FAQs
Gold has played a key role in human’s history as it has been widely used as a store of value and medium of exchange. Currently, apart from its shine and usage for jewelry, the precious metal is widely seen as a safe-haven asset, meaning that it is considered a good investment during turbulent times. Gold is also widely seen as a hedge against inflation and against depreciating currencies as it doesn’t rely on any specific issuer or government.
Central banks are the biggest Gold holders. In their aim to support their currencies in turbulent times, central banks tend to diversify their reserves and buy Gold to improve the perceived strength of the economy and the currency. High Gold reserves can be a source of trust for a country’s solvency. Central banks added 1,136 tonnes of Gold worth around $70 billion to their reserves in 2022, according to data from the World Gold Council. This is the highest yearly purchase since records began. Central banks from emerging economies such as China, India and Turkey are quickly increasing their Gold reserves.
Gold has an inverse correlation with the US Dollar and US Treasuries, which are both major reserve and safe-haven assets. When the Dollar depreciates, Gold tends to rise, enabling investors and central banks to diversify their assets in turbulent times. Gold is also inversely correlated with risk assets. A rally in the stock market tends to weaken Gold price, while sell-offs in riskier markets tend to favor the precious metal.
The price can move due to a wide range of factors. Geopolitical instability or fears of a deep recession can quickly make Gold price escalate due to its safe-haven status. As a yield-less asset, Gold tends to rise with lower interest rates, while higher cost of money usually weighs down on the yellow metal. Still, most moves depend on how the US Dollar (USD) behaves as the asset is priced in dollars (XAU/USD). A strong Dollar tends to keep the price of Gold controlled, whereas a weaker Dollar is likely to push Gold prices up.
-
04:23
Silver Price Forecast: XAG/USD moves below $31.50 despite a persistent bullish bias
- Silver price could regain its ground as the daily chart analysis suggests a persistent bullish bias.
- The pair may appreciate toward its primary resistance around its two-month high of $32.28.
- The immediate support appears at a nine-day EMA of $30.82, followed by the ascending channel’s lower boundary.
Silver price (XAG/USD) halts its three-day winning streak, trading around $31.30 per troy ounce during Asian hours on Friday. A daily chart analysis suggests a persistent bullish bias for the precious metal, as its price continues to rise within an ascending channel pattern.
The XAG/USD pair trades above both the nine-day and 14-day Exponential Moving Averages (EMAs), suggesting that short-term momentum is strong. Additionally, the 14-day Relative Strength Index (RSI) is positioned above the 50 level, reinforcing the active bullish sentiment.
On the upside, the Silver price could find its initial resistance around its two-month high of $32.28, last achieved on December 9. A break above this level would support the XAG/USD pair to test the upper boundary of the ascending channel at $32.60.
Immediate support is located at a nine-day EMA of $30.82, followed closely by a 14-day EMA of $30.66 which is aligned with the ascending channel’s lower boundary. A break below this crucial support zone would cause the emergence of the bearish bias and put pressure on the XAG/USD pair to navigate the region around its four-month low of $28.74, recorded on December 19.
XAG/USD: Daily Chart
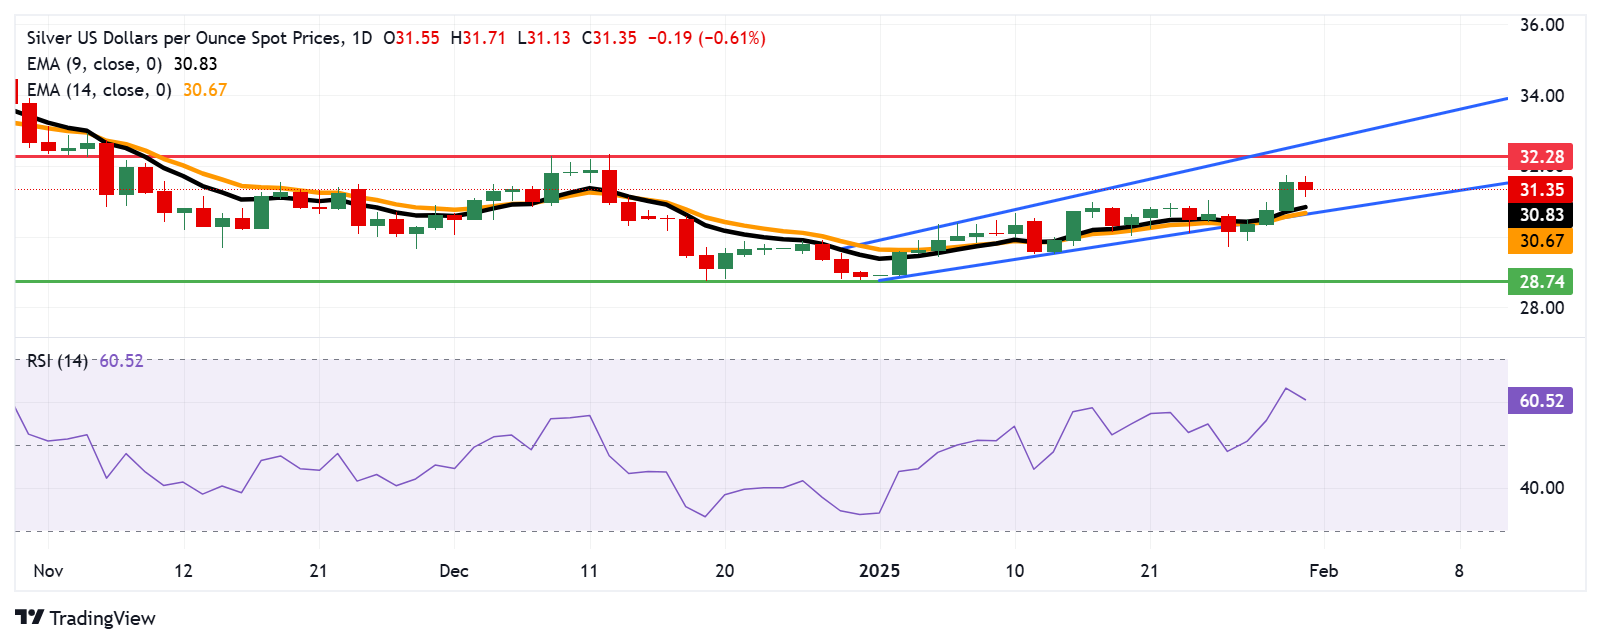
Silver FAQs
Silver is a precious metal highly traded among investors. It has been historically used as a store of value and a medium of exchange. Although less popular than Gold, traders may turn to Silver to diversify their investment portfolio, for its intrinsic value or as a potential hedge during high-inflation periods. Investors can buy physical Silver, in coins or in bars, or trade it through vehicles such as Exchange Traded Funds, which track its price on international markets.
Silver prices can move due to a wide range of factors. Geopolitical instability or fears of a deep recession can make Silver price escalate due to its safe-haven status, although to a lesser extent than Gold's. As a yieldless asset, Silver tends to rise with lower interest rates. Its moves also depend on how the US Dollar (USD) behaves as the asset is priced in dollars (XAG/USD). A strong Dollar tends to keep the price of Silver at bay, whereas a weaker Dollar is likely to propel prices up. Other factors such as investment demand, mining supply – Silver is much more abundant than Gold – and recycling rates can also affect prices.
Silver is widely used in industry, particularly in sectors such as electronics or solar energy, as it has one of the highest electric conductivity of all metals – more than Copper and Gold. A surge in demand can increase prices, while a decline tends to lower them. Dynamics in the US, Chinese and Indian economies can also contribute to price swings: for the US and particularly China, their big industrial sectors use Silver in various processes; in India, consumers’ demand for the precious metal for jewellery also plays a key role in setting prices.
Silver prices tend to follow Gold's moves. When Gold prices rise, Silver typically follows suit, as their status as safe-haven assets is similar. The Gold/Silver ratio, which shows the number of ounces of Silver needed to equal the value of one ounce of Gold, may help to determine the relative valuation between both metals. Some investors may consider a high ratio as an indicator that Silver is undervalued, or Gold is overvalued. On the contrary, a low ratio might suggest that Gold is undervalued relative to Silver.
-
03:37
USD/MXN rises above 20.50 due to renewed tariff threats from Trump
- USD/MXN appreciates as Trump reiterated plans to impose a flat 25% import tax on all goods from Canada and Mexico.
- The economic slowdown in Mexico reinforces the likelihood of Banxico’s larger rate cuts.
- US Gross Domestic Product Annualized fell to 2.3% in Q4 from the previous 3.1%, missing expectations of 2.6%.
The USD/MXN pair continues its upward momentum for the second consecutive session, trading around 20.70 during Asian hours on Friday. The Mexican Peso (MXN) remains under pressure following renewed tariff threats from US President Donald Trump.
On Thursday night, Trump reiterated plans to impose a flat 25% import tax on all goods entering the US from Canada and Mexico, citing concerns over fentanyl. The first wave of tariffs on both countries is set to take effect on February 1, according to Reuters. Additionally, Trump hinted at the possibility of imposing tariffs on Canadian and Mexican Oil exports.
In a separate statement on X (formerly Twitter), Trump also reaffirmed his threat to levy 100% tariffs on BRICS nations if they attempt to introduce an alternative currency to challenge the US dollar in international trade.
Economic data from Mexico further weighed on the Mexican Peso. INEGI reported that Mexico’s GDP shrank by 0.6% in Q4 2024, a sharp contrast to the 1.1% expansion in the previous quarter and well below market expectations of a 0.2% decline. This marks the first contraction since Q3 2021. On an annual basis, GDP grew by just 0.6%, missing forecasts of 1.2% and reaching its lowest rate since Q1 2021.
The economic slowdown aligns with signals from Banco de México (Banxico) that larger rate cuts could be on the horizon, particularly if US tariff threats materialize. The central bank is expected to lower rates by at least 25 basis points (bps), bringing them down from 10% to 9.75%, though analysts at Capital Economics suggest a 50 bps cut remains a possibility.
Meanwhile, US economic data showed signs of slowing growth. The Department of Commerce reported that Gross Domestic Product Annualized (Q4) fell to 2.3% from 3.1%, missing expectations of 2.6%. Additionally, Initial Jobless Claims for the week ending January 24 came in at 207K, below forecasts of 220K but an improvement from the previous week’s 223K.
Investors now turn their attention to key US data releases later on Friday, including Personal Consumption Expenditures (PCE), Personal Income and Spending figures, and the Chicago Purchasing Managers' Index (PMI).
Tariffs FAQs
Tariffs are customs duties levied on certain merchandise imports or a category of products. Tariffs are designed to help local producers and manufacturers be more competitive in the market by providing a price advantage over similar goods that can be imported. Tariffs are widely used as tools of protectionism, along with trade barriers and import quotas.
Although tariffs and taxes both generate government revenue to fund public goods and services, they have several distinctions. Tariffs are prepaid at the port of entry, while taxes are paid at the time of purchase. Taxes are imposed on individual taxpayers and businesses, while tariffs are paid by importers.
There are two schools of thought among economists regarding the usage of tariffs. While some argue that tariffs are necessary to protect domestic industries and address trade imbalances, others see them as a harmful tool that could potentially drive prices higher over the long term and lead to a damaging trade war by encouraging tit-for-tat tariffs.
During the run-up to the presidential election in November 2024, Donald Trump made it clear that he intends to use tariffs to support the US economy and American producers. In 2024, Mexico, China and Canada accounted for 42% of total US imports. In this period, Mexico stood out as the top exporter with $466.6 billion, according to the US Census Bureau. Hence, Trump wants to focus on these three nations when imposing tariffs. He also plans to use the revenue generated through tariffs to lower personal income taxes.
-
03:30
USD/INR gains momentum as Trump threatens BRICS with tariffs
- The Indian Rupee weakens in Friday’s Asian session.
- Ongoing foreign outflows, month-end USD demand and a hawkish Fed weigh on the INR.
- Traders brace for India’s Fiscal Deficit and US December PCE data, which will be published later on Friday.
The Indian Rupee (INR) remains weak on Friday, pressured by the persistent portfolio outflows and month-end US Dollar (USD) demand. Furthermore, a hawkish hold from the U.S. Federal Reserve (Fed) is likely to boost the Greenback and exert some selling pressure on the local currency. Fed Chair Jerome Powell said there would be no rush to cut the interest rate again.
On the other hand, the routine foreign exchange intervention from the Reserve Bank of India (RBI) by selling the USD might prevent the INR from significantly depreciating. Later on Friday, India’s Federal Fiscal Deficit will take center stage. On the US docket, traders will keep an eye on the December Personal Consumption Expenditures (PCE), Personal Income/Spending, the Chicago Purchasing Managers' Index (PMI) and the speech from Fed Governor Michelle Bowman.
Traders will also closely monitor the development surrounding Trump's policies, including import tariffs, an immigration crackdown, tax cuts and looser regulation. Analysts expect Trump's policies might fuel inflationary pressures in the US economy and prompt the Fed to keep rates higher for longer.Indian Rupee remains on the defensive amid global cues
- India's economy is likely to slowdown in 2025, primarily driven by persistent inflationary pressures and a moderation in domestic demand, said Moody’s in its latest report.
- The Indian Rupee has weakened over 1% in January so far and is the worst performer among major Asian currencies.
- US President Donald Trump threatens BRICS countries with 100% tariffs if they create a new currency.
- The US Gross Domestic Product (GDP) grew at an annual rate of 2.3% in the fourth quarter (Q4), compared to the 3.1% expansion seen in Q3, the US Bureau of Economic Analysis (BEA) first estimate showed on Thursday. This reading came in weaker than the market expectation of 2.6%.
- The US Initial Jobless Claims for the week ending January 24 rose to 207K, according to the US Department of Labor. This reading came in lower than the previous week's 223K and the consensus of 220K.
- The US Pending Home Sale declined by 5.5% MoM in December from a 1.6% increase (revised from 2.2%) in November, missing the estimation.
USD/INR consolidates amid a strong uptrend
The Indian Rupee trades in negative territory on the day. The USD/INR pair has traded within the upper boundary of the trading range on the daily chart. The constructive outlook of the pair remains intact as the price is above the key 100-day Exponential Moving Average (EMA). Additionally, the 14-day Relative Strength Index (RSI) is located above the midline near 65.45, suggesting that further upside looks favorable.
The first upside barrier emerges at an all-time high of 86.69. If the pair extends its gains, we could see a run for a fresh peak at the 87.00 psychological mark.
On the flip side, the initial support level is seen at 86.31, the low of January 28. A breach of this level could draw in sellers and drag the pair back down to 86.14, the low of January 24, followed by 85.85, the low of January 10.Indian Rupee FAQs
The Indian Rupee (INR) is one of the most sensitive currencies to external factors. The price of Crude Oil (the country is highly dependent on imported Oil), the value of the US Dollar – most trade is conducted in USD – and the level of foreign investment, are all influential. Direct intervention by the Reserve Bank of India (RBI) in FX markets to keep the exchange rate stable, as well as the level of interest rates set by the RBI, are further major influencing factors on the Rupee.
The Reserve Bank of India (RBI) actively intervenes in forex markets to maintain a stable exchange rate, to help facilitate trade. In addition, the RBI tries to maintain the inflation rate at its 4% target by adjusting interest rates. Higher interest rates usually strengthen the Rupee. This is due to the role of the ‘carry trade’ in which investors borrow in countries with lower interest rates so as to place their money in countries’ offering relatively higher interest rates and profit from the difference.
Macroeconomic factors that influence the value of the Rupee include inflation, interest rates, the economic growth rate (GDP), the balance of trade, and inflows from foreign investment. A higher growth rate can lead to more overseas investment, pushing up demand for the Rupee. A less negative balance of trade will eventually lead to a stronger Rupee. Higher interest rates, especially real rates (interest rates less inflation) are also positive for the Rupee. A risk-on environment can lead to greater inflows of Foreign Direct and Indirect Investment (FDI and FII), which also benefit the Rupee.
Higher inflation, particularly, if it is comparatively higher than India’s peers, is generally negative for the currency as it reflects devaluation through oversupply. Inflation also increases the cost of exports, leading to more Rupees being sold to purchase foreign imports, which is Rupee-negative. At the same time, higher inflation usually leads to the Reserve Bank of India (RBI) raising interest rates and this can be positive for the Rupee, due to increased demand from international investors. The opposite effect is true of lower inflation.
-
03:30
Commodities. Daily history for Thursday, January 30, 2025
Raw materials Closed Change, % Silver 31.618 2.54 Gold 2794 1.29 Palladium 984.23 1.81 -
03:24
Japanese Yen remains on the front foot against USD after Tokyo CPI
- The Japanese Yen continues to be underpinned by bets for additional BoJ rate hikes.
- Geopolitical risk and trade war fears also benefit the JPY’s relative safe-haven status.
- Trump’s tariff threats cap gains for the JPY and lend some support to the USD/JPY pair.
The Japanese Yen (JPY) attracts buyers for the third straight day on Friday and remains close to over a one-month high touched against its American counterpart earlier this week. Data released earlier today showed that consumer prices in Tokyo – Japan's capital – rose in January. Moreover, Japanese Industrial Production registered unexpected growth in December and Retail Sales surged past consensus estimates. This keeps alive expectations for further interest rate hikes by the Bank of Japan (BoJ), which, in turn, continues to underpin the JPY.
Apart from this, geopolitical risks turn out to be another factor that benefits the safe-haven JPY, which, along with subdued US Dollar (USD) price action, keeps the USD/JPY pair depressed near the 154.00 mark during the Asian session. That said, a positive tone around the equity markets might hold back traders from placing aggressive bullish bets around the JPY. Moreover, the Federal Reserve's (Fed) hawkish pause on Wednesday and a modest bounce in the US Treasury bond yields act as a tailwind for the USD, lending support to the currency pair.
Japanese Yen draws support from a combination of factors; bulls remain cautious amid Trump’s tariff threats
- The Statistics Bureau of Japan reported this Friday that the headline Tokyo Consumer Price Index (CPI) accelerated from 3.0% to 3.4% YoY in January – the highest level since April 2023.
- Adding to this, core CPI, which excludes volatile fresh food prices, picked up from the 2.4% seen in December and rose 2.5% YoY during the reported month – representing an 11-month high.
- Meanwhile, a core CPI gauge that excludes both fresh food and energy prices remained close to the Bank of Japan's 2% annual target and climbed 1.9% YoY in January from the 1.8% previous.
- BoJ Deputy Governor Ryozo Himino reiterated that real rates remain negative and that the central bank would consider more rate increases if economic and price developments align with expectations.
- State-run TASS news agency reported, citing the Russian Defense Ministry, that two Russian Tu-95 strategic bombers conducted a routine flight over the Sea of Okhotsk and the Sea of Japan on Thursday.
- According to the first estimate published by the US Bureau of Economic Analysis (BEA) on Thursday, the US Gross Domestic Product (GDP) grew at an annual rate of 2.3% in the fourth quarter.
- The reading marked a notable slowdown from the 3.1% expansion recorded in the previous quarter and was below the market expectation of 2.6%, though it did little to influence the US Dollar.
- US President Donald Trump reiterated his threat to impose 25% tariffs on Mexico and Canada – the top two US trade partners – and warned of potential 100% tariffs if BRICS attempts to replace the USD.
- Concerns that Trump's protectionist policies will boost inflation, along with the Federal Reserve's hawkish outlook, provide a modest lift to the US Treasury bond yields, which underpin the buck.
- Investors now look forward to the release of the US Personal Consumption Expenditure (PCE) Price Index – the Fed's preferred inflation gauge – for fresh impetus on the last day of the week.
USD/JPY seems vulnerable to slide below monthly low around 153.70; ascending channel breakdown in play
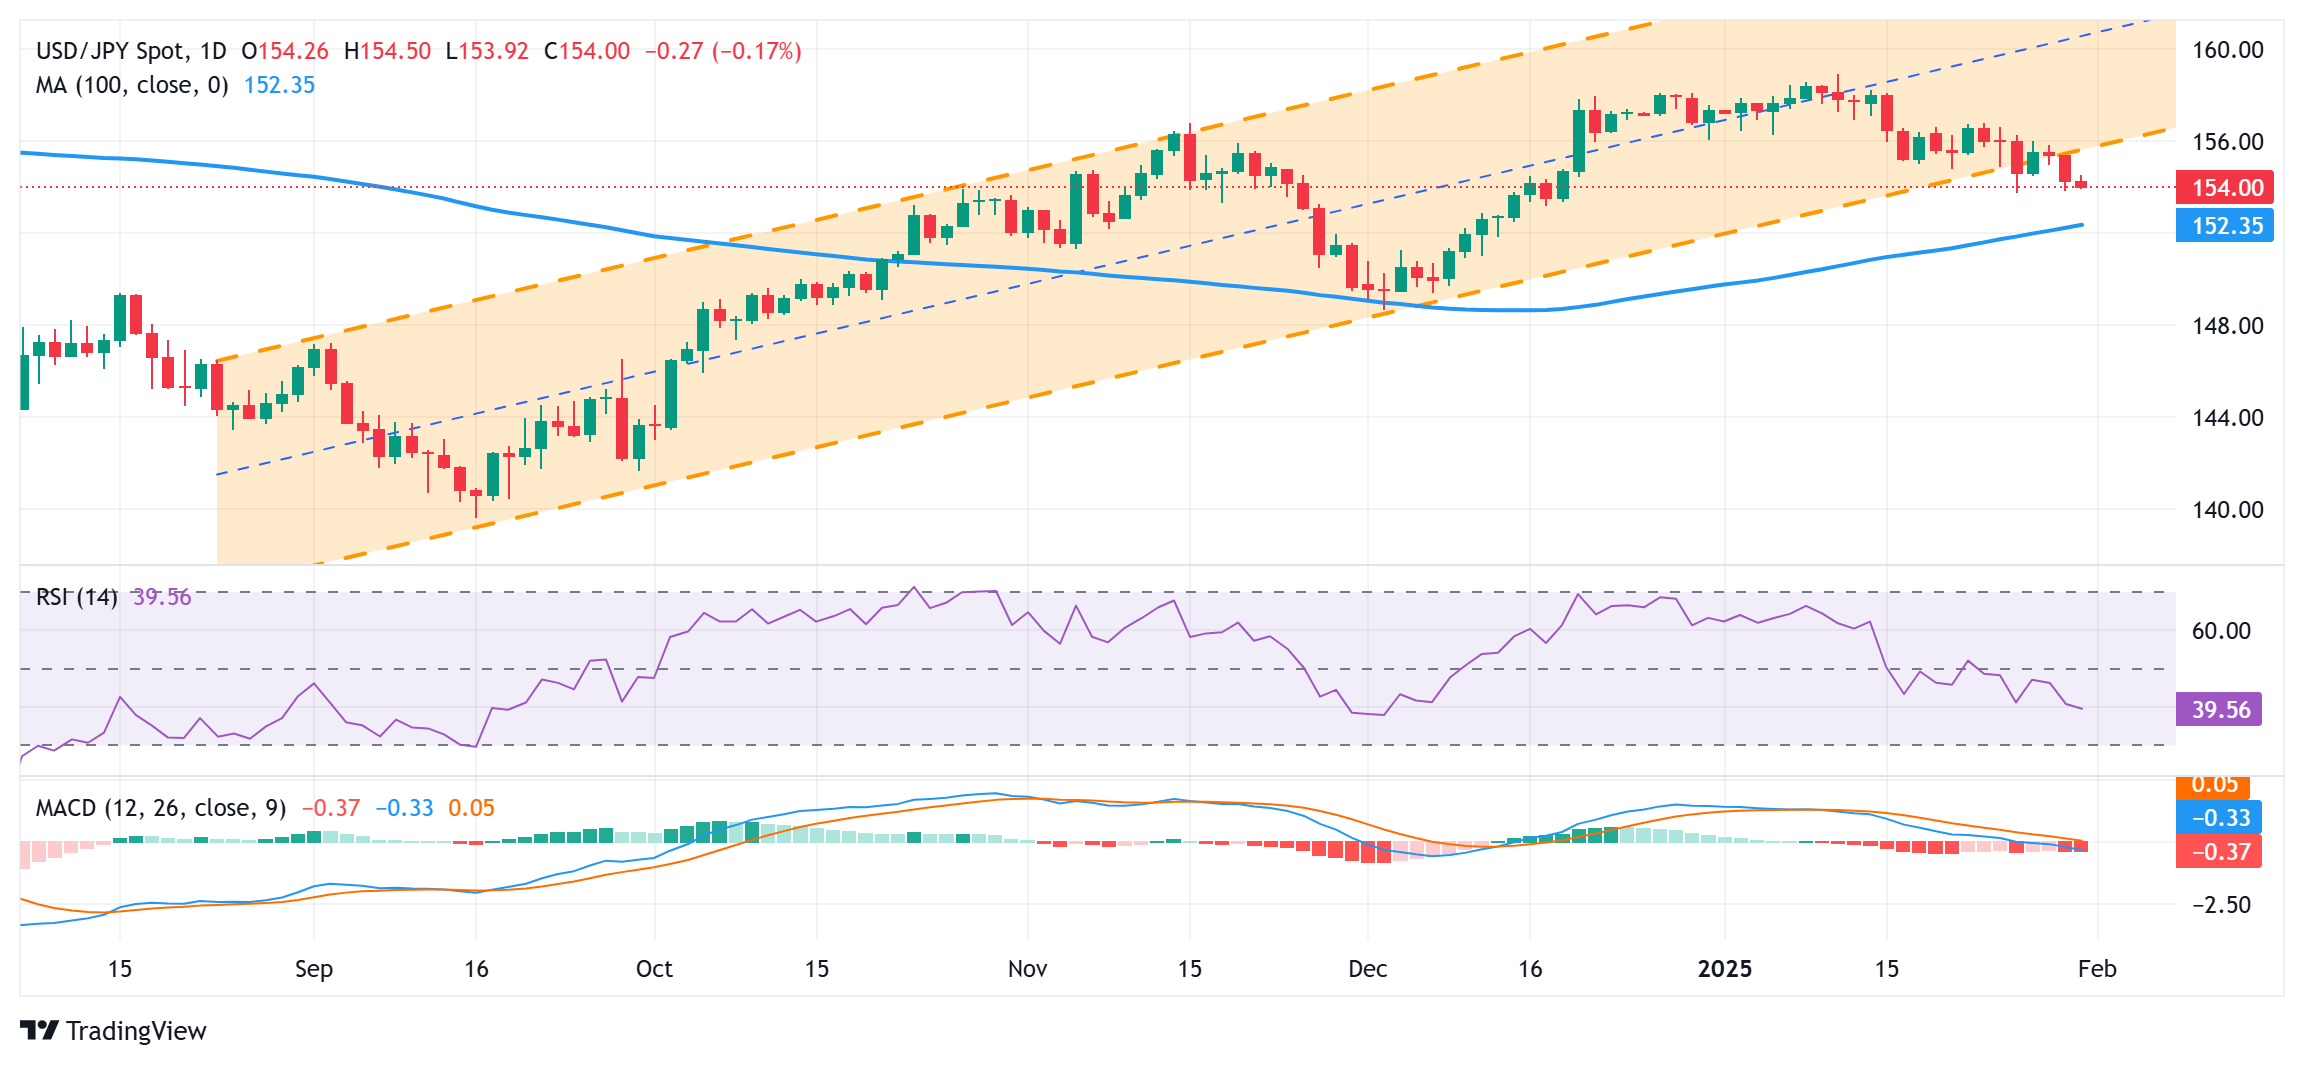
Against the backdrop of the recent breakdown below a short-term ascending trend channel, some follow-through selling below the monthly swing low, around the 153.70 area touched on Monday, will be seen as a key trigger for bearish traders. Moreover, oscillators on the daily chart have been gaining negative traction and are still away from being in the oversold zone. Hence, the subsequent downfall could drag the USD/JPY pair towards the 153.00 round figure en route to the 152.40 area and the 152.00 mark. The latter coincides with the 100-day Simple Moving Average (SMA) and could offer decent support to spot prices.
On the flip side, any attempted recovery above mid-154.00s now seems to confront a stiff barrier near the 155.00 psychological mark. A sustained strength, however, might trigger an intraday short-covering move towards the 155.40-155.45 region en route to the 156.00 round figure and the weekly top, around the 156.25 area. The next relevant hurdle is pegged near the 156.75 region, which if cleared decisively might shift the near-term bias in favor of bullish traders and pave the way for additional gains.
Economic Indicator
Tokyo Consumer Price Index (YoY)
The Tokyo Consumer Price Index (CPI), released by the Statistics Bureau of Japan on a monthly basis, measures the price fluctuation of goods and services purchased by households in the Tokyo region. The index is widely considered as a leading indicator of Japan’s overall CPI as it is published weeks before the nationwide reading. The YoY reading compares prices in the reference month to the same month a year earlier. Generally, a high reading is seen as bullish for the Japanese Yen (JPY), while a low reading is seen as bearish.
Read more.Last release: Thu Jan 30, 2025 23:30
Frequency: Monthly
Actual: 3.4%
Consensus: -
Previous: 3%
Source: Statistics Bureau of Japan
-
02:53
US President Trump warns of potential 100% tariffs if BRICS attempt to replace US Dollar
US President Trump warns of potential 100% tariffs if BRICS attempt to replace US Dollar
developing story ....
-
02:37
Australian Dollar continues to lose ground amid Trump tariff threats on China
- The Australian Dollar depreciates as traders await more clarity from Trump’s tariff policies.
- The Australian Dollar faces challenges amid the increased likelihood of the RBA rate cut in February.
- Traders await US Personal Consumption Expenditures (PCE) data later on Friday.
The Australian Dollar (AUD) extends its losing streak against the US Dollar (USD) for the fifth consecutive day on Friday. The AUD/USD pair depreciates due to tariff threats from US President Donald Trump against China. Investors await more clarity from Trump’s tariff policies.
President Trump reiterated his plan on Thursday to impose 25% tariffs on Canada and Mexico but did not specify a timeline for China. However, Trump stated that China would also face tariffs, with his administration actively working on their implementation. Given China's significant trade relationship with Australia, any indication of a renewed US-China trade war could put downward pressure on the AUD.
The Aussie Dollar struggles as ANZ, CBA, Westpac, and now National Australia Bank (NAB) all anticipate a 25 basis point (bps) rate cut from the Reserve Bank of Australia (RBA) in February. Previously, the NAB had forecasted a rate cut in May but has now moved its projection forward to the February RBA meeting.
Easing inflationary pressures toward the end of 2024 have fueled speculation that the Reserve Bank of Australia could consider a rate cut in February. The RBA has maintained the Official Cash Rate (OCR) at 4.35% since November 2023, emphasizing that inflation must “sustainably” return to its 2%-3% target range before any policy easing.
Australian Dollar depreciates due to increased hawkish tone surrounding Fed
- The US Dollar Index (DXY), which measures the US Dollar’s value against six major currencies, trades above 108.00 at the time of writing. The US Personal Consumption Expenditures (PCE), Personal Income/Spending, and the Chicago Purchasing Managers' Index (PMI) will be in focus, which is due later on Friday.
- The US Federal Reserve held its overnight borrowing rate steady in the 4.25%-4.50% range at its January meeting on Wednesday, as widely expected. This decision followed three consecutive rate cuts since September 2024, totaling a full percentage point.
- The US Dollar strengthened after the Fed adopted a cautious tone. During the press conference, Fed Chair Jerome Powell emphasized that the central bank would need to see “real progress on inflation or some weakness in the labor market” before considering any further adjustments to monetary policy.
- Scott Bessent, the Treasury Secretary under Trump, stated that he aims to introduce new universal tariffs on US imports, starting at 2.5%. These tariffs could rise to as much as 20%, reflecting Trump’s aggressive stance on trade policies, consistent with his campaign rhetoric last year.
- Speaking with reporters aboard Air Force One early Tuesday, US President Donald Trump stated that he “wants tariffs ‘much bigger’ than 2.5%,” as Treasury Secretary Scott Bessent proposed. However, Trump has not yet decided on the specific tariff levels.
- The Reserve Bank of Australia released its January 2025 Bulletin, featuring a detailed analysis of how monetary policy changes influence interest rates in the economy and how fluctuations in interest rates impact economic activity and inflation.
- Australia’s CPI rose by 0.2% quarter-on-quarter in the fourth quarter of 2024, matching the growth seen in the previous quarter but falling short of the market expectation of 0.3%. On an annual basis, CPI inflation eased to 2.4% in Q4 from 2.8% in Q3, also below the consensus forecast of 2.5%.
- Australia’s Monthly CPI for December 2024 increased by 2.5% year-over-year, in line with forecasts and up from November’s 2.3%. This marked the highest reading since August but remained within the Reserve Bank of Australia’s (RBA) target range of 2% to 3% for the fourth consecutive month. The RBA’s Trimmed Mean CPI rose by 3.2% YoY, the slowest pace in three years, slightly under the expected 3.3% but still above the central bank’s target range.
- Australian Treasurer Jim Chalmers stated on Wednesday that "the worst of the inflation challenge is well and truly behind us." Chalmers further emphasized that "the soft landing we have been planning and preparing for is looking more and more likely," according to Reuters.
- The AUD also faced challenges amid increased risk aversion due to tariff threats made by US President Donald Trump. President Trump announced plans on Monday evening to impose tariffs on imports of computer chips, pharmaceuticals, steel, aluminum, and copper. The goal is to shift production to the United States (US) and bolster domestic manufacturing.
Technical Analysis: Australian Dollar falls toward 0.6200 within descending channel
The AUD/USD pair hovers around 0.6210 on Friday, trading within the descending channel pattern on the daily chart, indicating a bearish bias. The 14-day Relative Strength Index (RSI) remains below the 50 mark, further confirming the downside momentum.
The AUD/USD pair could target the descending channel’s lower boundary at 0.6170 level, followed by 0.6131—the lowest level since April 2020—recorded on January 13.
On the upside, immediate resistance is seen at the nine-day Exponential Moving Average (EMA) at 0.6240, aligned with the descending channel’s upper boundary.
AUD/USD: Daily Chart
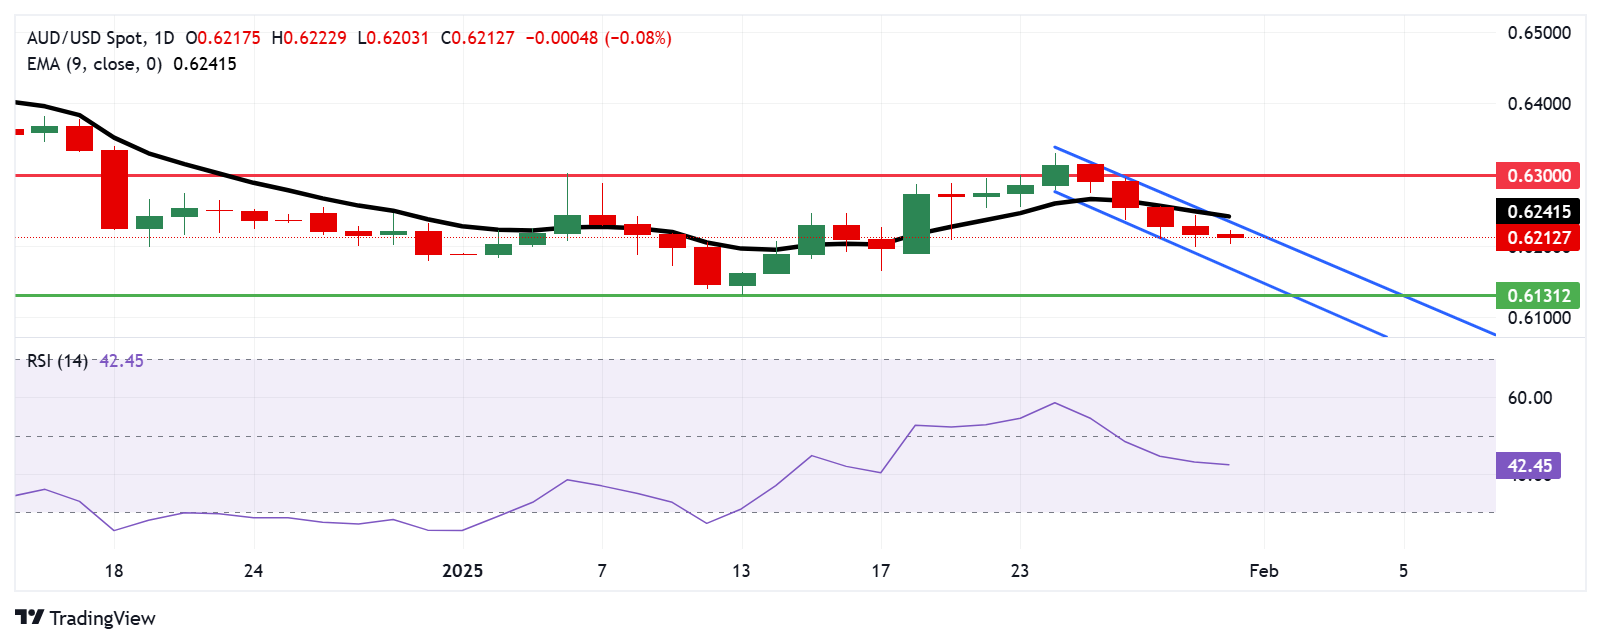
Australian Dollar PRICE Today
The table below shows the percentage change of Australian Dollar (AUD) against listed major currencies today. Australian Dollar was the weakest against the Japanese Yen.
USD EUR GBP JPY CAD AUD NZD CHF USD 0.18% 0.11% -0.15% -0.00% 0.06% 0.10% 0.06% EUR -0.18% -0.07% -0.34% -0.18% -0.11% -0.07% -0.12% GBP -0.11% 0.07% -0.27% -0.10% -0.05% 0.00% -0.05% JPY 0.15% 0.34% 0.27% 0.15% 0.23% 0.26% 0.22% CAD 0.00% 0.18% 0.10% -0.15% 0.06% 0.11% 0.06% AUD -0.06% 0.11% 0.05% -0.23% -0.06% 0.04% -0.00% NZD -0.10% 0.07% -0.00% -0.26% -0.11% -0.04% -0.04% CHF -0.06% 0.12% 0.05% -0.22% -0.06% 0.00% 0.04% The heat map shows percentage changes of major currencies against each other. The base currency is picked from the left column, while the quote currency is picked from the top row. For example, if you pick the Australian Dollar from the left column and move along the horizontal line to the US Dollar, the percentage change displayed in the box will represent AUD (base)/USD (quote).
Australian Dollar FAQs
One of the most significant factors for the Australian Dollar (AUD) is the level of interest rates set by the Reserve Bank of Australia (RBA). Because Australia is a resource-rich country another key driver is the price of its biggest export, Iron Ore. The health of the Chinese economy, its largest trading partner, is a factor, as well as inflation in Australia, its growth rate and Trade Balance. Market sentiment – whether investors are taking on more risky assets (risk-on) or seeking safe-havens (risk-off) – is also a factor, with risk-on positive for AUD.
The Reserve Bank of Australia (RBA) influences the Australian Dollar (AUD) by setting the level of interest rates that Australian banks can lend to each other. This influences the level of interest rates in the economy as a whole. The main goal of the RBA is to maintain a stable inflation rate of 2-3% by adjusting interest rates up or down. Relatively high interest rates compared to other major central banks support the AUD, and the opposite for relatively low. The RBA can also use quantitative easing and tightening to influence credit conditions, with the former AUD-negative and the latter AUD-positive.
China is Australia’s largest trading partner so the health of the Chinese economy is a major influence on the value of the Australian Dollar (AUD). When the Chinese economy is doing well it purchases more raw materials, goods and services from Australia, lifting demand for the AUD, and pushing up its value. The opposite is the case when the Chinese economy is not growing as fast as expected. Positive or negative surprises in Chinese growth data, therefore, often have a direct impact on the Australian Dollar and its pairs.
Iron Ore is Australia’s largest export, accounting for $118 billion a year according to data from 2021, with China as its primary destination. The price of Iron Ore, therefore, can be a driver of the Australian Dollar. Generally, if the price of Iron Ore rises, AUD also goes up, as aggregate demand for the currency increases. The opposite is the case if the price of Iron Ore falls. Higher Iron Ore prices also tend to result in a greater likelihood of a positive Trade Balance for Australia, which is also positive of the AUD.
The Trade Balance, which is the difference between what a country earns from its exports versus what it pays for its imports, is another factor that can influence the value of the Australian Dollar. If Australia produces highly sought after exports, then its currency will gain in value purely from the surplus demand created from foreign buyers seeking to purchase its exports versus what it spends to purchase imports. Therefore, a positive net Trade Balance strengthens the AUD, with the opposite effect if the Trade Balance is negative.
-
02:07
Japan PM Ishiba: Japan to maintain investment in US for job creation
Japan’s Prime Minister Shigeru Ishiba said on Friday that the government will continue to invest and create jobs in the United States (US). Ishiba further stated that he will urge the US to provide a stable energy supply.
Market reaction
At the time of writing, USD/JPY is trading 0.11% lower on the day to trade at 154.08.
Japanese Yen FAQs
The Japanese Yen (JPY) is one of the world’s most traded currencies. Its value is broadly determined by the performance of the Japanese economy, but more specifically by the Bank of Japan’s policy, the differential between Japanese and US bond yields, or risk sentiment among traders, among other factors.
One of the Bank of Japan’s mandates is currency control, so its moves are key for the Yen. The BoJ has directly intervened in currency markets sometimes, generally to lower the value of the Yen, although it refrains from doing it often due to political concerns of its main trading partners. The BoJ ultra-loose monetary policy between 2013 and 2024 caused the Yen to depreciate against its main currency peers due to an increasing policy divergence between the Bank of Japan and other main central banks. More recently, the gradually unwinding of this ultra-loose policy has given some support to the Yen.
Over the last decade, the BoJ’s stance of sticking to ultra-loose monetary policy has led to a widening policy divergence with other central banks, particularly with the US Federal Reserve. This supported a widening of the differential between the 10-year US and Japanese bonds, which favored the US Dollar against the Japanese Yen. The BoJ decision in 2024 to gradually abandon the ultra-loose policy, coupled with interest-rate cuts in other major central banks, is narrowing this differential.
The Japanese Yen is often seen as a safe-haven investment. This means that in times of market stress, investors are more likely to put their money in the Japanese currency due to its supposed reliability and stability. Turbulent times are likely to strengthen the Yen’s value against other currencies seen as more risky to invest in.
-
01:59
NZD/USD weakens below 0.5650 as traders await clarity on Trump tariffs on China
- NZD/USD softens to around 0.5630 in Friday’s early Asian session.
- Trump said China is going to end up paying a tariff as well, weighing on the China-proxy NZD.
- Discouraging New Zealand’s economic outlook and RBNZ dovish bets could undermine the Kiwi.
The NZD/USD pair edges lower to near 0.5630 during the early Asian session on Friday, pressured by threats of tariffs from US President Donald Trump against China. Investors await more clarity from Trump’s tariff policies. Also, the US Personal Consumption Expenditures (PCE), Personal Income/Spending, and the Chicago Purchasing Managers' Index (PMI) will be in focus, which is due later on Friday.
Late Thursday, Trump emphasized his plans to impose 25% tariffs on Canada and Mexico on February 1 but has not set a firm date for China. However, Trump noted that China is going to end up paying a tariff as well, and the administration is in the process of doing a China tariff. The markets might turn cautious later in the day while awaiting more clarity about tariff policies. Any signs of a renewed trade war between the United States and China could weigh on the China-proxy Kiwi, as China is a major trading partner to New Zealand.
The US Federal Reserve (Fed) decided to hold interest rates steady on Wednesday, and Fed Chair Jerome Powell said there would be no rush to cut them again until inflation and job data made it appropriate. Fed officials will keep an eye on Trump's policies on immigration, tariffs, taxes and other areas that could prove disruptive. The hawkish hold from the Fed is likely to lift the US Dollar (USD) and create a headwind for NZD/USD in the near term.
The Reserve Bank of New Zealand (RBNZ) chief economist Paul Conway painted a dim picture of the country's economic outlook, cutting weak productivity, investment and trade. Additionally, the dovish expectation from the RBNZ could contribute to the New Zealand Dollar’s (NZD) downside. "In line with RBNZ guidance, markets continue to imply another 50bps rate cut to 3.75% in February and the policy rate to bottom around 3.00% over the next 12 months. RBNZ/Fed policy trend remains drag for NZD/USD,” noted BBH FX analysts.New Zealand Dollar FAQs
The New Zealand Dollar (NZD), also known as the Kiwi, is a well-known traded currency among investors. Its value is broadly determined by the health of the New Zealand economy and the country’s central bank policy. Still, there are some unique particularities that also can make NZD move. The performance of the Chinese economy tends to move the Kiwi because China is New Zealand’s biggest trading partner. Bad news for the Chinese economy likely means less New Zealand exports to the country, hitting the economy and thus its currency. Another factor moving NZD is dairy prices as the dairy industry is New Zealand’s main export. High dairy prices boost export income, contributing positively to the economy and thus to the NZD.
The Reserve Bank of New Zealand (RBNZ) aims to achieve and maintain an inflation rate between 1% and 3% over the medium term, with a focus to keep it near the 2% mid-point. To this end, the bank sets an appropriate level of interest rates. When inflation is too high, the RBNZ will increase interest rates to cool the economy, but the move will also make bond yields higher, increasing investors’ appeal to invest in the country and thus boosting NZD. On the contrary, lower interest rates tend to weaken NZD. The so-called rate differential, or how rates in New Zealand are or are expected to be compared to the ones set by the US Federal Reserve, can also play a key role in moving the NZD/USD pair.
Macroeconomic data releases in New Zealand are key to assess the state of the economy and can impact the New Zealand Dollar’s (NZD) valuation. A strong economy, based on high economic growth, low unemployment and high confidence is good for NZD. High economic growth attracts foreign investment and may encourage the Reserve Bank of New Zealand to increase interest rates, if this economic strength comes together with elevated inflation. Conversely, if economic data is weak, NZD is likely to depreciate.
The New Zealand Dollar (NZD) tends to strengthen during risk-on periods, or when investors perceive that broader market risks are low and are optimistic about growth. This tends to lead to a more favorable outlook for commodities and so-called ‘commodity currencies’ such as the Kiwi. Conversely, NZD tends to weaken at times of market turbulence or economic uncertainty as investors tend to sell higher-risk assets and flee to the more-stable safe havens.
-
01:31
Australia Private Sector Credit (YoY): 6.5% (December) vs 6.2%
-
01:30
Australia Private Sector Credit (MoM) came in at 0.6%, above expectations (0.5%) in December
-
01:30
Australia Producer Price Index (QoQ) registered at 0.8%, below expectations (1%) in 4Q
-
01:30
Stocks. Daily history for Thursday, January 30, 2025
Index Change, points Closed Change, % NIKKEI 225 99.19 39513.97 0.25 ASX 200 46.7 8493.7 0.55 DAX 89.67 21727.2 0.41 CAC 40 69.16 7941.64 0.88 Dow Jones 168.61 44882.13 0.38 S&P 500 31.86 6071.17 0.53 NASDAQ Composite 49.43 19681.75 0.25 -
01:30
Australia Producer Price Index (YoY) declined to 3.7% in 4Q from previous 3.9%
-
01:15
Currencies. Daily history for Thursday, January 30, 2025
Pare Closed Change, % AUDUSD 0.62087 -0.31 EURJPY 160.342 -0.77 EURUSD 1.03916 -0.27 GBPJPY 191.593 -0.76 GBPUSD 1.24173 -0.17 NZDUSD 0.5634 -0.33 USDCAD 1.44892 0.53 USDCHF 0.90972 0.4 USDJPY 154.29 -0.55 -
01:07
WTI holds above $72.50 amid tariff concerns
- WTI price posts modest gains to around $72.85 in Friday’s early Asian session.
- Trump plans to impose tariffs of 25% on Canadian and Mexican goods on Saturday.
- Investors will closely monitor the OPEC+ ministerial meeting on Monday.
West Texas Intermediate (WTI), the US crude oil benchmark, is trading around $72.85 during the early Asian session on Friday. The WTI price edges higher as traders assess the impact of threatened US tariffs on Canadian and Mexican crude imports that could take effect on Saturday.
US President Donald Trump has threatened to impose a 25% tariff as early as Saturday on imports from Canada and Mexico, but he has not yet decided whether to include oil imports in the measure. The White House said late Wednesday that both countries can avoid this if they act swiftly to close their borders to fentanyl.
Oil traders will closely monitor the outcome of the meeting by the Organization of the Petroleum Exporting Countries and its allies, including Russia (OPEC+), scheduled for next Monday. Trump reiterated his call for OPEC and Saudi Arabia to lower oil prices, saying that a decline in crude prices would end the conflict in Ukraine.
On the other hand, crude oil prices might be bolstered by tougher US sanctions on Russia's oil industry. The measures targeted Gazprom Neft and Surgutneftgas, which exported around 970,000 bpd of Russian crude during the first 10 months of 2024. A decline in Russian crude oil exports is supportive of crude oil prices.WTI Oil FAQs
WTI Oil is a type of Crude Oil sold on international markets. The WTI stands for West Texas Intermediate, one of three major types including Brent and Dubai Crude. WTI is also referred to as “light” and “sweet” because of its relatively low gravity and sulfur content respectively. It is considered a high quality Oil that is easily refined. It is sourced in the United States and distributed via the Cushing hub, which is considered “The Pipeline Crossroads of the World”. It is a benchmark for the Oil market and WTI price is frequently quoted in the media.
Like all assets, supply and demand are the key drivers of WTI Oil price. As such, global growth can be a driver of increased demand and vice versa for weak global growth. Political instability, wars, and sanctions can disrupt supply and impact prices. The decisions of OPEC, a group of major Oil-producing countries, is another key driver of price. The value of the US Dollar influences the price of WTI Crude Oil, since Oil is predominantly traded in US Dollars, thus a weaker US Dollar can make Oil more affordable and vice versa.
The weekly Oil inventory reports published by the American Petroleum Institute (API) and the Energy Information Agency (EIA) impact the price of WTI Oil. Changes in inventories reflect fluctuating supply and demand. If the data shows a drop in inventories it can indicate increased demand, pushing up Oil price. Higher inventories can reflect increased supply, pushing down prices. API’s report is published every Tuesday and EIA’s the day after. Their results are usually similar, falling within 1% of each other 75% of the time. The EIA data is considered more reliable, since it is a government agency.
OPEC (Organization of the Petroleum Exporting Countries) is a group of 12 Oil-producing nations who collectively decide production quotas for member countries at twice-yearly meetings. Their decisions often impact WTI Oil prices. When OPEC decides to lower quotas, it can tighten supply, pushing up Oil prices. When OPEC increases production, it has the opposite effect. OPEC+ refers to an expanded group that includes ten extra non-OPEC members, the most notable of which is Russia.
-
00:55
Japan Large Retailer Sales remains unchanged at 3% in December
-
00:51
Japan Industrial Production (YoY) rose from previous -2.7% to -1.1% in December
-
00:50
Japan Retail Trade s.a (MoM) down to -0.7% in December from previous 1.8%
-
00:50
Japan Retail Trade (YoY) came in at 3.7%, above forecasts (3.2%) in December
-
00:50
Japan Industrial Production (MoM) meets forecasts (0.3%) in December
-
00:42
EUR/USD struggles under the weight of the Greenback
- EUR/USD slumped back into the 1.0400 handle on Thursday.
- German data looms ahead on Friday, followed by key US inflation figures.
- Fiber traders wait to see if the Fed’s rate call this week was the right one.
EUR/USD shifted lower for a fourth consecutive trading day on Thursday, peaking near 1.0450 before softening to shed one-fifth of one percent on the day and ending just below the 1.0400 handle as the Euro’s near-term bull run draws to an end. A slate of German economic figures are due early Friday, followed by a key US inflation reading.
European Central Bank (ECB) President Christine Lagarde hit newswires during Thursday’s early US market session to soothe markets over the recent soft patch of European data, noting that a single month or quarter of souring data doesn’t necessarily mean a trend is being established. The ECB head may come to regret those remarks with German Retail Sales figures and Consumer Price Index (CPI) figures in the barrel for early Friday.
German Retail Sales are expected to hold steady at 2.5% YoY for the annualized period ending in December, while the MoM figure is expected to barely recover ground to 0.2% after November’s downside print of -0.6%. Headline German CPI inflation is likewise expected to hold steady at 2.6% for the year ended in December, holding frustratingly above the typical central bank targets of 2%.
US economic data was mixed on Thursday, leaving markets further confused. US Gross Domestic Product (GDP) growth for the fourth quarter of 2024 came in lower than expected, while weekly Initial Jobless Claims figures exceeded expectations and remained well within recent norms.
On Friday, US Personal Consumption Expenditure Price Index (PCEPI) inflation metrics will be released during the US market session. As the Federal Reserve’s (Fed) preferred method for measuring and tracking consumer-level inflation, this PCEPI report is likely to attract more attention than usual after the Fed boldly maintained interest rates earlier this week, despite President Trump’s strong objections.
EUR/USD price forecast
EUR/USD’s soft stance on Thursday marked another bearish rejection of the 50-day Exponential Moving Average (EMA) near 1.0450. The Fiber has soured for four consecutive sessions, leaving the pair on the low end of key technical levels as the latest bullish recover sputters.
The pair is still holding on the high side of the last major swing low into two-year bottoms south of 1.0200 reached earlier in the month. However, bulls are poised to fully run out of gas and drag the pair back into the 1.0300 region.
EUR/USD daily chart
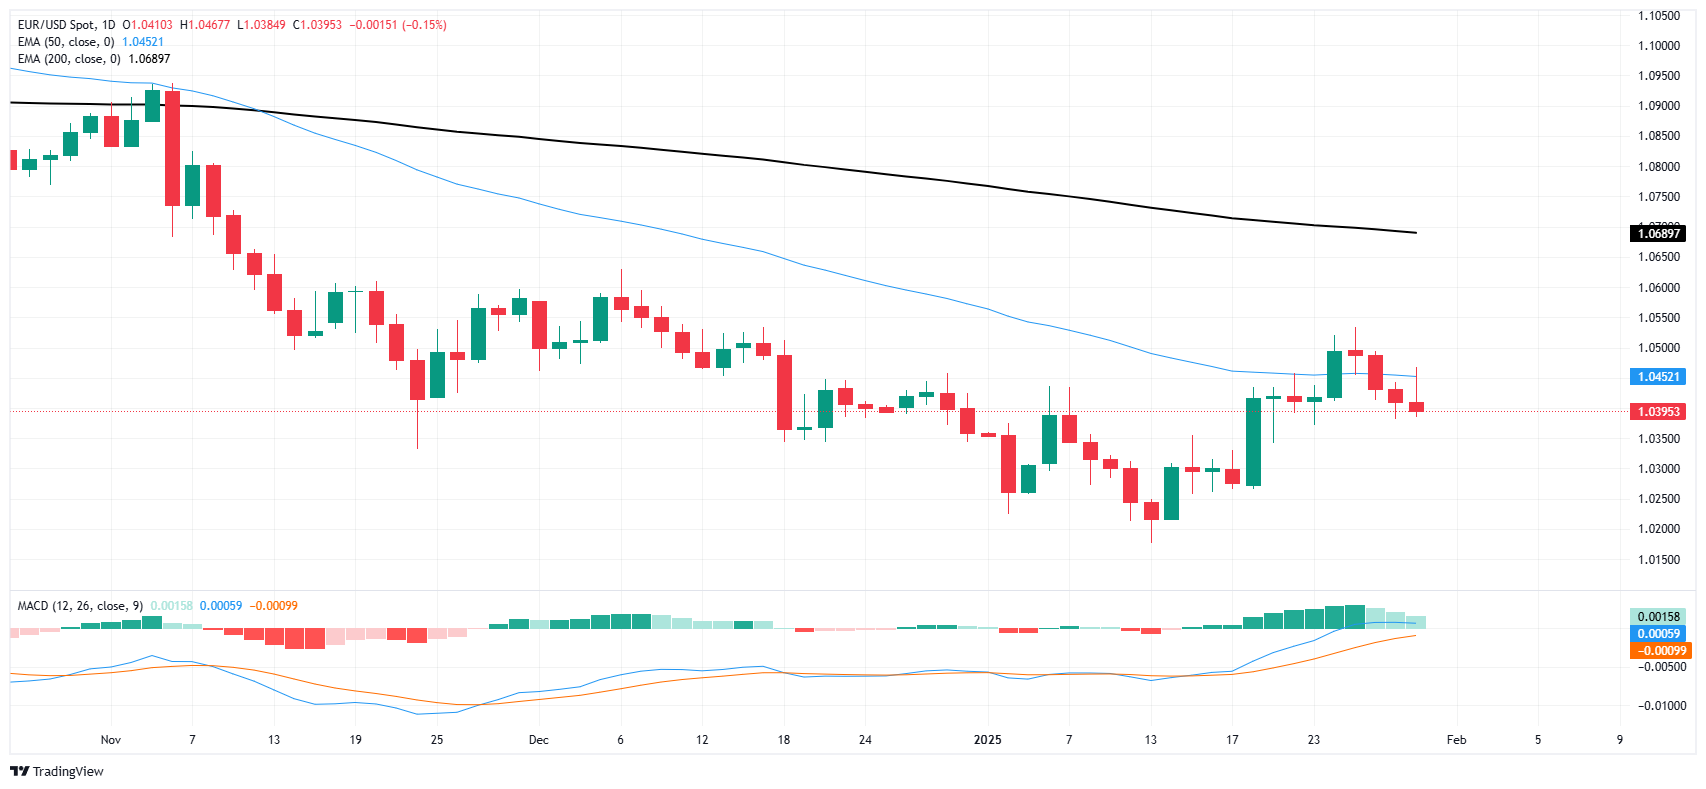
Euro FAQs
The Euro is the currency for the 19 European Union countries that belong to the Eurozone. It is the second most heavily traded currency in the world behind the US Dollar. In 2022, it accounted for 31% of all foreign exchange transactions, with an average daily turnover of over $2.2 trillion a day. EUR/USD is the most heavily traded currency pair in the world, accounting for an estimated 30% off all transactions, followed by EUR/JPY (4%), EUR/GBP (3%) and EUR/AUD (2%).
The European Central Bank (ECB) in Frankfurt, Germany, is the reserve bank for the Eurozone. The ECB sets interest rates and manages monetary policy. The ECB’s primary mandate is to maintain price stability, which means either controlling inflation or stimulating growth. Its primary tool is the raising or lowering of interest rates. Relatively high interest rates – or the expectation of higher rates – will usually benefit the Euro and vice versa. The ECB Governing Council makes monetary policy decisions at meetings held eight times a year. Decisions are made by heads of the Eurozone national banks and six permanent members, including the President of the ECB, Christine Lagarde.
Eurozone inflation data, measured by the Harmonized Index of Consumer Prices (HICP), is an important econometric for the Euro. If inflation rises more than expected, especially if above the ECB’s 2% target, it obliges the ECB to raise interest rates to bring it back under control. Relatively high interest rates compared to its counterparts will usually benefit the Euro, as it makes the region more attractive as a place for global investors to park their money.
Data releases gauge the health of the economy and can impact on the Euro. Indicators such as GDP, Manufacturing and Services PMIs, employment, and consumer sentiment surveys can all influence the direction of the single currency. A strong economy is good for the Euro. Not only does it attract more foreign investment but it may encourage the ECB to put up interest rates, which will directly strengthen the Euro. Otherwise, if economic data is weak, the Euro is likely to fall. Economic data for the four largest economies in the euro area (Germany, France, Italy and Spain) are especially significant, as they account for 75% of the Eurozone’s economy.
Another significant data release for the Euro is the Trade Balance. This indicator measures the difference between what a country earns from its exports and what it spends on imports over a given period. If a country produces highly sought after exports then its currency will gain in value purely from the extra demand created from foreign buyers seeking to purchase these goods. Therefore, a positive net Trade Balance strengthens a currency and vice versa for a negative balance.
-
00:33
Japan's Tokyo CPI inflation climbs to 3.4% YoY in January vs. 3.0% prior
The headline Tokyo Consumer Price Index (CPI) for January climbed 3.4% YoY as compared to 3.0% in the previous month, the Statistics Bureau of Japan showed on Friday. Meanwhile, the Tokyo CPI ex Fresh Food, Energy came in at 2.5% in January vs. 2.4% in December.
Additionally, Tokyo CPI ex Fresh Food rose 2.5% YoY in January against 2.5% expected and up from 2.4% in the prior month.Market reaction to the Tokyo Consumer Price Index
As of writing, the USD/JPY pair was up 0.06% on the day at 154.36.
Japanese Yen FAQs
The Japanese Yen (JPY) is one of the world’s most traded currencies. Its value is broadly determined by the performance of the Japanese economy, but more specifically by the Bank of Japan’s policy, the differential between Japanese and US bond yields, or risk sentiment among traders, among other factors.
One of the Bank of Japan’s mandates is currency control, so its moves are key for the Yen. The BoJ has directly intervened in currency markets sometimes, generally to lower the value of the Yen, although it refrains from doing it often due to political concerns of its main trading partners. The BoJ ultra-loose monetary policy between 2013 and 2024 caused the Yen to depreciate against its main currency peers due to an increasing policy divergence between the Bank of Japan and other main central banks. More recently, the gradually unwinding of this ultra-loose policy has given some support to the Yen.
Over the last decade, the BoJ’s stance of sticking to ultra-loose monetary policy has led to a widening policy divergence with other central banks, particularly with the US Federal Reserve. This supported a widening of the differential between the 10-year US and Japanese bonds, which favored the US Dollar against the Japanese Yen. The BoJ decision in 2024 to gradually abandon the ultra-loose policy, coupled with interest-rate cuts in other major central banks, is narrowing this differential.
The Japanese Yen is often seen as a safe-haven investment. This means that in times of market stress, investors are more likely to put their money in the Japanese currency due to its supposed reliability and stability. Turbulent times are likely to strengthen the Yen’s value against other currencies seen as more risky to invest in.
-
00:30
Japan Tokyo Consumer Price Index (YoY) increased to 3.4% in January from previous 3%
-
00:30
Japan Tokyo CPI ex Food, Energy (YoY) rose from previous 2.4% to 2.5% in January
-
00:30
Japan Jobs / Applicants Ratio meets forecasts (1.25) in December
-
00:30
Japan Unemployment Rate came in at 2.4%, below expectations (2.5%) in December
-
00:30
Japan Tokyo CPI ex Fresh Food (YoY) in line with forecasts (2.5%) in January
-
00:09
USD/CAD gathers strength to near 1.4500 as tariff decision looms
- USD/CAD rises to around 1.4500 in Thursday’s late American session.
- Trump reiterates the threat of imposing tariffs on Canada and Mexico on Saturday.
- Fed left rates unchanged and sees no hurry to cut again.
The USD/CAD pair gains momentum to around 1.4500 during the late American session on Thursday. The Canadian Dollar (CAD) remains under selling pressure as US President Donald Trump repeated his threat of tariffs on goods from Canada and Mexico. Later on Friday, the US Personal Consumption Expenditures (PCE), Personal Income/Spending, and the Chicago Purchasing Managers' Index (PMI) will be released.
Trump said late Thursday that the US plans to impose a flat 25% import tax "because of fentanyl" on all goods crossing the border into the US from Canada or Mexico. The announcement of the first Canada and Mexico tariff policies is coming on Saturday.
The potential for a trade conflict triggered by new U.S. tariffs on Canadian exports could weigh on the Loonie and act as a tailwind for USD/CAD. The US and Canada are major trading partners, exchanging $2.7 billion in goods and services across their shared border each day in 2023, according to Canadian government figures.
Additionally, the US Federal Reserve (Fed) left its overnight borrowing rate unchanged in a range between 4.25%-4.50% at its January meeting on Wednesday. Fed Chair Jerome Powell noted that officials are not in a rush to lower interest rates, adding the central bank is pausing to see further progress on inflation following a string of rate cuts in 2024.
Wednesday’s hawkish hold by the Fed could underpin the US Dollar (USD) broadly in the near term. Markets are pricing in a funds rate of about 3.9% by the end of 2025, implying a 61% chance of two-quarter percentage point reductions this year, according to CME Group data.Canadian Dollar FAQs
The key factors driving the Canadian Dollar (CAD) are the level of interest rates set by the Bank of Canada (BoC), the price of Oil, Canada’s largest export, the health of its economy, inflation and the Trade Balance, which is the difference between the value of Canada’s exports versus its imports. Other factors include market sentiment – whether investors are taking on more risky assets (risk-on) or seeking safe-havens (risk-off) – with risk-on being CAD-positive. As its largest trading partner, the health of the US economy is also a key factor influencing the Canadian Dollar.
The Bank of Canada (BoC) has a significant influence on the Canadian Dollar by setting the level of interest rates that banks can lend to one another. This influences the level of interest rates for everyone. The main goal of the BoC is to maintain inflation at 1-3% by adjusting interest rates up or down. Relatively higher interest rates tend to be positive for the CAD. The Bank of Canada can also use quantitative easing and tightening to influence credit conditions, with the former CAD-negative and the latter CAD-positive.
The price of Oil is a key factor impacting the value of the Canadian Dollar. Petroleum is Canada’s biggest export, so Oil price tends to have an immediate impact on the CAD value. Generally, if Oil price rises CAD also goes up, as aggregate demand for the currency increases. The opposite is the case if the price of Oil falls. Higher Oil prices also tend to result in a greater likelihood of a positive Trade Balance, which is also supportive of the CAD.
While inflation had always traditionally been thought of as a negative factor for a currency since it lowers the value of money, the opposite has actually been the case in modern times with the relaxation of cross-border capital controls. Higher inflation tends to lead central banks to put up interest rates which attracts more capital inflows from global investors seeking a lucrative place to keep their money. This increases demand for the local currency, which in Canada’s case is the Canadian Dollar.
Macroeconomic data releases gauge the health of the economy and can have an impact on the Canadian Dollar. Indicators such as GDP, Manufacturing and Services PMIs, employment, and consumer sentiment surveys can all influence the direction of the CAD. A strong economy is good for the Canadian Dollar. Not only does it attract more foreign investment but it may encourage the Bank of Canada to put up interest rates, leading to a stronger currency. If economic data is weak, however, the CAD is likely to fall.
-