Noticias del mercado
-
22:07
Major US stock indexes finished trading below the zero mark
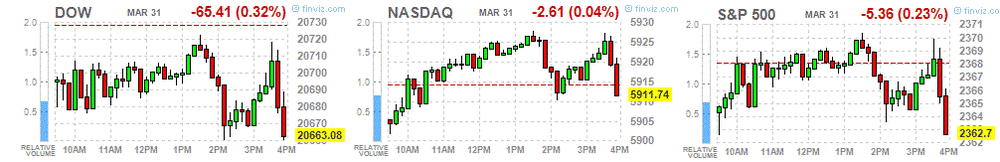
Major US stock indexes finished the session below zero amid mixed data on the US. Meanwhile, in the 1st quarter the indices of the S & P 500 and Dow Jones showed the strongest dynamics in four years. Wall Street has achieved a series of record highs since the election of President Trump against the backdrop of the fact that he promised to reduce taxes and increase spending on infrastructure.
As it became known today, consumer spending in the US rose slightly in February amid delays in the payment of income tax, but the largest annual inflation rate for almost five years confirmed expectations for further rate hikes this year. The Ministry of Commerce reported that consumer spending rose 0.1%. This was the smallest increase since August and followed the 0.2% growth in January. In addition, the Chicago Purchasing Managers Index stabilized at 57.7 in March after a significant increase of 7.1 points in February to 57.4. On average, the index for the first quarter was 55.1, which is the highest since the fourth quarter of 2014. However, the final results of the studies submitted by Thomson-Reuters and the Michigan Institute showed that in March the consumer sentiment index rose to 96.9 points compared with the final reading for February 96.3 points and the preliminary value for March 97.6 points . It was predicted that the index will be 97.6 points.
The components of the DOW index mostly decreased (19 out of 30). Exxon Mobil Corporation shares dropped the most (XOM, -1.90%). The leader of growth was shares of Intel Corporation (INTC, + 0.98%).
Most sectors of the S & P index closed in positive territory. The financial sector fell most of all (-0.3%). The growth leader was the conglomerate sector (+ 0.6%).
At closing:
Dow -0.32% 20.662.60 -65.89
Nasdaq -0.04% 5,911.74 -2.60
S & P -0.23% 2,362.69 -5.37
-
21:00
DJIA -0.27% 20,673.33 -55.16 Nasdaq +0.03% 5,915.98 +1.64 S&P -0.14% 2,364.75 -3.31
-
19:15
Wall Street. Major U.S. stock-indexes little changed
Major U.S. stock-indexes little changed on Friday, with the S&P 500 and the Dow Jones Industrial Average firmly on course to book their biggest first-quarter gains in four years. Wall Street has hit a series of record highs following the election of President Donald Trump on bets that he would introduce tax cuts and boost infrastructure spending. The rally has also benefited from a raft of robust economic data.
Most of Dow stocks in negative area (17 of 30). Top loser - Exxon Mobil Corporation (XOM, -2.00%). Top gainer - Intel Corporation (INTC, +1.08%).
Most of S&P sectors in positive area. Top loser - Financials (-0.2%). Top gainer - Utilities (+0.7%).
At the moment:
Dow 20632.00 -28.00 -0.14%
S&P 500 2363.25 -1.25 -0.05%
Nasdaq 100 5447.25 +9.75 +0.18%
Oil 50.37 +0.02 +0.04%
Gold 1248.10 -5.60 -0.45%
U.S. 10yr 2.40 -0.01
-
18:00
European stocks closed: FTSE 100 -46.60 7322.92 -0.63% DAX +56.44 12312.87 +0.46% CAC 40 +32.87 5122.51 +0.65%
-
16:00
U.S.: Reuters/Michigan Consumer Sentiment Index, February 96.9 (forecast 97.6)
-
15:45
Polish deputy finance minister says observing increased inflows from foreign investors to Polish debt market in march
-
15:45
U.S.: Chicago Purchasing Managers' Index , March 57.7 (forecast 56.9)
-
15:34
U.S. Stocks open: Dow -0.22%, Nasdaq -0.21%, S&P -0.22%
-
15:26
Before the bell: S&P futures -0.10%, NASDAQ futures -0.02%
U.S. stock-index futures were flat on last day of the best first quarter for Wall Street in four years.
Global Stocks:
Nikkei 18,909.26 -153.96 -0.81%
Hang Seng 24,111.59 -189.50 -0.78%
Shanghai 3,222.60 +12.37 +0.39%
FTSE 7,341.15 -28.37 -0.38%
CAC 5,089.27 -0.37 -0.01%
DAX 12,264.16 +7.73 +0.06%
Crude $50.19 (-0.32%)
Gold $1,240.20 (-0.39%)
-
15:22
Fed's Dudley: neutral Fed funds rate in 2-3 pct range
-
Not huge rush to tighten; economy clearly not overheating
-
Increase in sentiment not yet translated into 'hard' data, Q1 U.S Gdp may be a bit weaker
-
Could gradually trim portfolio perhaps later this year or in 2018
-
Trimming balance sheet a 'substitute' for rate hikes; could 'pause' raising rates at that time
-
Likely not at stage where there is great urgency to tighten policy
-
-
15:07
Fed's Dudley: a couple more hikes this year seems reasonable - Bloomberg tv
-
14:54
Wall Street. Stocks before the bell
(company / ticker / price / change ($/%) / volume)
ALCOA INC.
AA
34.2
0.71(2.12%)
45296
ALTRIA GROUP INC.
MO
71.92
-0.13(-0.18%)
1501
Amazon.com Inc., NASDAQ
AMZN
877.9
1.56(0.18%)
8189
Apple Inc.
AAPL
143.89
-0.04(-0.03%)
27003
AT&T Inc
T
41.87
0.11(0.26%)
3408
Barrick Gold Corporation, NYSE
ABX
18.76
-0.08(-0.42%)
22963
Boeing Co
BA
178.02
0.04(0.02%)
930
Chevron Corp
CVX
107.64
-0.14(-0.13%)
130
Cisco Systems Inc
CSCO
33.72
-0.02(-0.06%)
1713
Citigroup Inc., NYSE
C
60.45
-0.06(-0.10%)
2887
Exxon Mobil Corp
XOM
83.49
-0.21(-0.25%)
17987
Facebook, Inc.
FB
142.49
0.08(0.06%)
9275
Ford Motor Co.
F
11.65
-0.03(-0.26%)
44437
Freeport-McMoRan Copper & Gold Inc., NYSE
FCX
13.28
-0.03(-0.23%)
73958
General Electric Co
GE
29.84
-0.03(-0.10%)
6980
General Motors Company, NYSE
GM
35.42
0.01(0.03%)
1333
Goldman Sachs
GS
231.15
-0.07(-0.03%)
4404
Hewlett-Packard Co.
HPQ
17.6
-0.05(-0.28%)
125
Intel Corp
INTC
35.85
0.10(0.28%)
1819
Microsoft Corp
MSFT
65.7
-0.01(-0.02%)
2384
Nike
NKE
55.83
-0.21(-0.37%)
4556
Procter & Gamble Co
PG
90.08
-0.12(-0.13%)
203
Tesla Motors, Inc., NASDAQ
TSLA
279
1.08(0.39%)
12348
The Coca-Cola Co
KO
42.55
-0.05(-0.12%)
427
Twitter, Inc., NYSE
TWTR
14.95
0.03(0.20%)
17335
Verizon Communications Inc
VZ
49.15
0.09(0.18%)
797
Wal-Mart Stores Inc
WMT
71.47
-0.12(-0.17%)
522
-
14:48
Upgrades and downgrades before the market open
Upgrades:
Downgrades:
Other:
Intel (INTC) initiated with an Outperform at Macquarie
Amazon (AMZN) initiated with a Buy at Loop Capital
Alphabet (GOOG) initiated with a Hold at Loop Capital
Arconic (ARNC) initiated with a Neutral at Longbow
-
14:44
US personal income increased $57.7 billion (0.4 percent) in February
Personal income increased $57.7 billion (0.4 percent) in February according to estimates released today by the Bureau of Economic Analysis. Disposable personal income (DPI) increased $44.6 billion (0.3 percent) and personal consumption expenditures (PCE) increased $7.4 billion (0.1 percent).
Real DPI increased 0.2 percent in February and Real PCE decreased 0.1 percent. The PCE price index increased 0.1 percent. Excluding food and energy, the PCE price index increased 0.2 percent.
Personal income increased 3.6 percent in 2016 (that is, from the 2015 annual level to the 2016 annual level), compared with an increase of 4.4 percent in 2015. DPI increased 3.9 percent in 2016, compared with an increase of 3.8 percent in 2015. In 2016, PCE increased 3.9 percent compared with an increase of 3.5 percent in 2015.
-
14:35
Canada's GDP grew 0.6% in January on the strength of widespread growth across both goods and service producing industries
Gross domestic product grew 0.6% in January on the strength of widespread growth across both goods- and service-producing industries. With the exception of October, gross domestic product has risen every month since June 2016.
Goods-producing industries grew for the seventh time in eight months, increasing by 1.1% in January. Service-producing industries rose 0.4%, their highest monthly growth rate since June 2015.
The manufacturing sector was the largest contributor to the increase in gross domestic product, expanding 1.9% in January. With the exception of October, the manufacturing sector has grown every month since June 2016.
Durable manufacturing rose 2.0% in January, led by growth in fabricated metal, non-metallic mineral and wood product manufacturing. With the exception of miscellaneous manufacturing, all durable manufacturing subsectors rose.
Transportation equipment was up 0.6%, as growth in motor vehicle, motor vehicle body and trailer, aerospace product and parts and railroad rolling stock manufacturing was partly offset by declines in manufacturing of motor vehicle parts and other transportation equipment.
-
14:32
The Canadian dollar rallies after better than expected Canadian GDP. USD/CAD down 55 pips so far
-
14:30
U.S.: Personal spending , February 0.1% (forecast 0.2%)
-
14:30
U.S.: Personal Income, m/m, February 0.4% (forecast 0.4%)
-
14:30
U.S.: PCE price index ex food, energy, Y/Y, February 1.8% (forecast 1.7%)
-
14:30
Canada: GDP (m/m) , January 0.6% (forecast 0.3%)
-
14:30
U.S.: PCE price index ex food, energy, m/m, February 0.2% (forecast 0.2%)
-
14:04
Market gauge of long-term Euro Zone inflation expectations drops below 1.6 percent to lowest since late november in wake of softer than expected inflation data from bloc
-
12:32
ECB's Coeure: we want to be prudent in way we normalise
-
Inflation numbers consisitent with what we say
-
See very little pipeline price pressure
-
Yet to be convinced that price adjustment is sustainable
-
Sensitivity to downside of dfr increases over time
-
How long is "well past" depends on data
-
-
11:37
EU's Tusk says probably in autumn will be EU assessment on whether Brexit talks made sufficent progress
-
Is sure that no one will use security cooperation as bargaining chip
-
Intends to visit PM May in London before april 29 summit
-
Eu will not pursue punitive approach to Brexit
-
Talks will be difficult, sometimes confrontational
-
-
11:04
Euro area annual inflation is expected to be 1.5%
Euro area annual inflation is expected to be 1.5% in March 2017, down from 2.0% in February 2017, according to a flash estimate from Eurostat, the statistical office of the European Union.
Looking at the main components of euro area inflation, energy is expected to have the highest annual rate in March (7.3%, compared with 9.3% in February), followed by food, alcohol & tobacco (1.8%, compared with 2.5% in February), services (1.0%, compared with 1.3% in February) and non-energy industrial goods (0.2%, stable compared with February).
-
11:00
Eurozone: Harmonized CPI, Y/Y, March 1.5% (forecast 1.8%)
-
11:00
Eurozone: Harmonized CPI ex EFAT, Y/Y, March 0.7%
-
10:37
The UK’s current account deficit was £12.1 billion in Quarter 4
The UK's current account deficit was £12.1 billion in Quarter 4 (Oct to Dec) 2016, a narrowing of £13.6 billion from a revised deficit of £25.7 billion in Quarter 3 2016, due predominantly to a sharp narrowing in the deficit on Trade; the deficit in Quarter 4 equated to 2.4% of gross domestic product (GDP) at current market prices, down from 5.3% in Quarter 3.
The total trade deficit narrowed to £4.8 billion in Quarter 4 2016, following a sharp widening of the deficit in Quarter 3 2016 (£14.8 billion); this narrowing was predominantly due to an increase in the exports of goods of £7.6 billion.
-
10:36
UK GDP rose 0.7% in Q4, as expected
UK gross domestic product (GDP) in volume terms was estimated to have increased by 0.7% between Quarter 3 (July to Sept) 2016 and Quarter 4 (Oct to Dec) 2016, unrevised from the second estimate of GDP published on 22 February 2017; more generally, the latest GDP data for 2016 are little changed from the second estimate of GDP.
UK GDP growth in Quarter 4 2016 saw a continuation of strong consumer spending and strong output in consumer-focused industries; there has been a slowdown within business investment which fell by 0.9% driven by falls within the other buildings and structures and transport equipment assets, although this is a slightly improved picture from the second estimate of GDP, being revised up by 0.1 percentage points.
-
10:30
United Kingdom: GDP, q/q, Quarter IV 0.7% (forecast 0.7%)
-
10:30
United Kingdom: Business Investment, q/q, Quarter IV -0.9% (forecast -1%)
-
10:30
United Kingdom: Current account, bln , Quarter IV -12.1 (forecast -16)
-
10:30
United Kingdom: GDP, y/y, Quarter IV 1.9% (forecast 2%)
-
10:30
United Kingdom: Business Investment, y/y, Quarter IV -0.9% (forecast -0.9%)
-
09:55
Germany: Unemployment Change, March -30 (forecast -10)
-
09:55
Germany: Unemployment Rate s.a. , March 5.8% (forecast 5.9%)
-
09:28
Turkish deputy PM Simsek says economy grew much more than expected in 2016
-
Data points to moderate growth in q1
-
Economic recovery to accelerate from mid-q2 onwards
-
-
09:06
French CPI rose less than expected in March
According to the provisional estimate made at the end of March, the Consumer Price Index (CPI) should slacken again slightly (+1.1% year on year in March 2017 after +1.3% in January and +1.2% in February). This slight slowdown should be the result of these in services and energy prices, and of a sharp deceleration in food prices. These changes should be offset largely by a lesser downturn in the prices of manufactured products and an acceleration in those of tobacco.
Over one month, consumer prices should accelerate sharply: +0.6% after +0.1% in the previous month. This marked increase should come from a rebound in the prices of manufactured products after the end of winter sales and from a further rise in tobacco prices. Contrariwise, food prices are expected to drop due to fresh products prices. Energy prices should fall too, because of a downturn in petroleum products prices. Besides, services prices should slow down.
-
08:47
France: CPI, m/m, March -0.2% (forecast 0.7%)
-
08:40
Negative start of trading expected on the main European stock markets: DAX -0.4%, CAC40 -0.2%, FTSE -0.1%
-
08:39
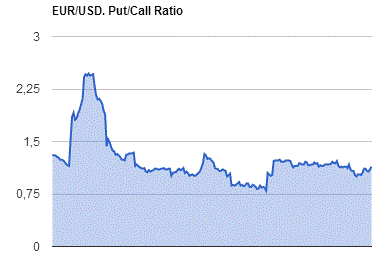
Options levels on friday, March 31, 2017
EUR/USD
Resistance levels (open interest**, contracts)
$1.0859 (754)
$1.0829 (1051)
$1.0786 (450)
Price at time of writing this review: $1.0683
Support levels (open interest**, contracts):
$1.0628 (506)
$1.0585 (755)
$1.0531 (1423)
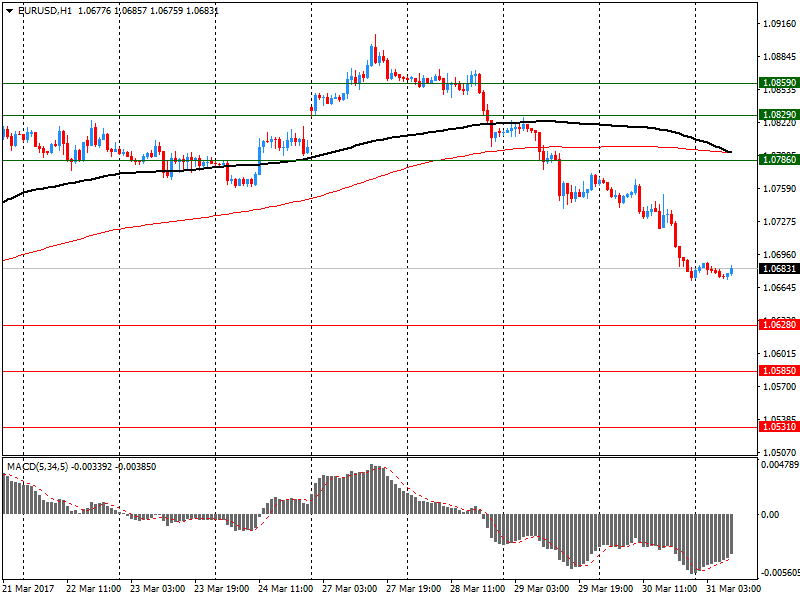
Comments:
- Overall open interest on the CALL options with the expiration date June, 9 is 44933 contracts, with the maximum number of contracts with strike price $1,1450 (3940);
- Overall open interest on the PUT options with the expiration date June, 9 is 48701 contracts, with the maximum number of contracts with strike price $1,0350 (3832);
- The ratio of PUT/CALL was 1.08 versus 1.08 from the previous trading day according to data from March, 30
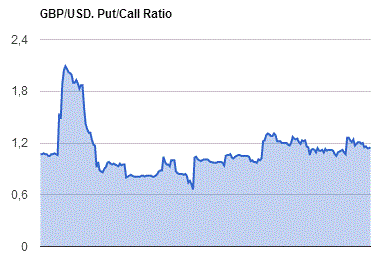
GBP/USD
Resistance levels (open interest**, contracts)
$1.2711 (868)
$1.2615 (345)
$1.2519 (834)
Price at time of writing this review: $1.2466
Support levels (open interest**, contracts):
$1.2385 (585)
$1.2289 (263)
$1.2191 (540)
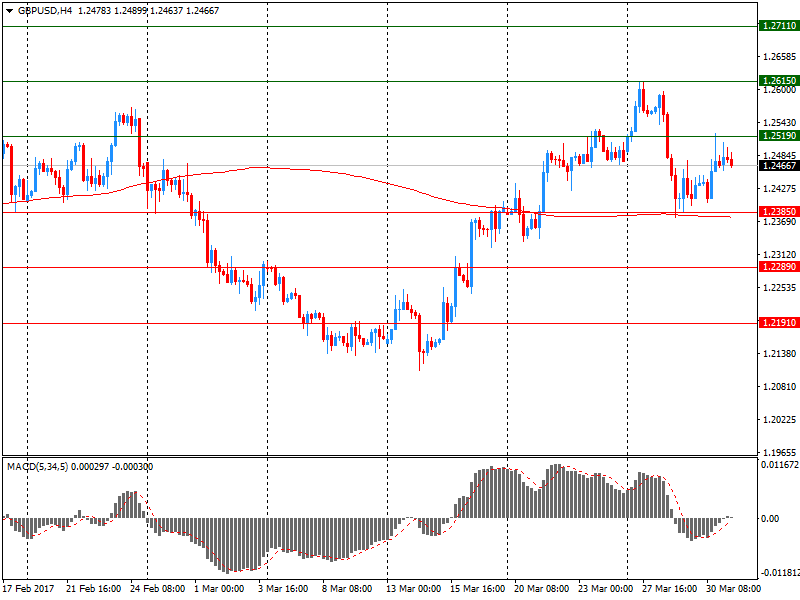
Comments:
- Overall open interest on the CALL options with the expiration date June, 9 is 15622 contracts, with the maximum number of contracts with strike price $1,3000 (1240);
- Overall open interest on the PUT options with the expiration date June, 9 is 17581 contracts, with the maximum number of contracts with strike price $1,1500 (3056);
- The ratio of PUT/CALL was 1.13 versus 1.14 from the previous trading day according to data from March, 30
* - The Chicago Mercantile Exchange bulletin (CME) is used for the calculation.
** - Open interest takes into account the total number of option contracts that are open at the moment.
-
08:39
UK consumer confidence remains stable in March
GfK's long-running Consumer Confidence Index remains stable at -6 in March. Three of the five measures stayed at the same level and two measures saw increases.
Joe Staton, Head of Market Dynamics at GfK, says:
"No real upsets this month as the Barometer continues to bump along in negative territory. Consumers remain cagey about the state of their personal finances and the general economic picture for the UK, especially as wage growth fails to keep pace with the rising costs of living. Since the Brexit referendum, household spending has been a big driver of growth, so any slump will dent future economic prospects. However, if we carry on shopping, as seen by the uptick in the Major Purchase Index, then forecasts for a post-Trigger/pre-Brexit slowdown could be proved wrong."
-
08:37
If @RepMarkMeadows, @Jim_Jordan and @Raul_Labrador would get on board we would have both great healthcare and massive tax cuts & reform @realDonaldTrump
-
08:36
New Zeeland home building consents rebounded in February
Home building consents rebounded in February 2017, but were up only slightly from February 2016, Stats NZ said today.
A total of 2,418 new homes were consented in February 2017 - up 1.6 percent from February 2016.
In seasonally adjusted terms, this was a 14 percent increase from January 2017. However, this only partly reversed large falls in November and December 2016.
"While we saw a strong seasonally adjusted increase this February, the actual number of homes consented was up only slightly from last year," business indicators senior manager Neil Kelly said.
-
08:34
The meeting next week with China will be a very difficult one in that we can no longer have massive trade deficits... @realDonaldTrump
-
08:33
UK annual rate of house price growth slowed in March to 3.5% - Nationwide
-
Annual house price growth softens to 3.5%
-
Prices fall 0.3% month-on-month in March
-
Some convergence in regional price growth, with gap between weakest and strongest performing regions narrowest since 1978
Commenting on the figures, Robert Gardner, Nationwide's Chief Economist, said: "The annual rate of house price growth slowed in March to 3.5%, from 4.5% in February. House prices fell by 0.3% in the month, after taking account of seasonal effects.
"There was a mixed picture across the UK in Q1. Six regions saw the pace of house price growth accelerate, six saw a deceleration and one (East Midlands) recorded the same rate as the previous quarter. Interestingly, the spread in the annual rate of change between the weakest and strongest performing regions was at its narrowest since 1978 at 6.8 percentage points - the second smallest gap on record".
-
-
08:31
German retail sales up 1.8% in February
According to provisional data turnover in retail trade in February 2017 was in real terms 2.1% smaller and in nominal terms 0.3% larger than that in February 2016. The number of days open for sale was 24 in February 2017 and 25 in February 2016.
Compared with the previous year, turnover in retail trade was in the first two months of 2017 in real terms 0.3% and in nominal terms 2.4% larger than in in the corresponding period of the previous year.
When adjusted for calendar and seasonal variations (Census-X-12-ARIMA), the February turnover was in real terms 1.8% and in nominal terms 2.3% larger than that in January 2017.
-
08:02
United Kingdom: Nationwide house price index, y/y, March 3.5% (forecast 4.1%)
-
08:02
United Kingdom: Nationwide house price index , March -0.3% (forecast 0.4%)
-
08:01
Germany: Retail sales, real unadjusted, y/y, February -2.1% (forecast 0.3%)
-
08:01
Germany: Retail sales, real adjusted , February 1.8% (forecast 0.7%)
-
07:40
Global Stocks
European stocks rose for a third straight day on Thursday, with the German benchmark logging its highest close since April 2015 on the back of a sliding euro. The advance in Frankfurt came as the euro EURUSD, +0.0187% slumped to an almost two-week low after disappointing German inflation data and a Reuters report that the European Central Bank is trying to rein in expectations that a rate hike could come as soon as December.
U.S. stocks closed higher Thursday as financial shares rallied following a positive reading of economic growth and the tech-heavy Nasdaq returned to finish in record territory after a month-long wait. Earlier, the government said the U.S. economy, as measured by gross domestic product, expanded at a 2.1% annualized pace in the fourth quarter, slightly faster than the previously reported 1.9% rate. Separately, jobless claims fell by 3,000 to 258,000 in the latest week, near their lowest level in decades.
Asian stocks began the last day of the quarter Friday little changed, after what has broadly been a strong start to 2017 for equities in the region amid worries over the global effect of issues such as potential U.S. protectionism.
-
07:02
Japan: Construction Orders, y/y, February 5.7%
-
07:02
Japan: Housing Starts, y/y, February -2.6% (forecast -1.1%)
-
03:16
China: Manufacturing PMI , March 51.8 (forecast 51.6)
-
02:59
China: Non-Manufacturing PMI, March 55.1
-
02:31
Australia: Private Sector Credit, y/y, February 5.0%
-
02:30
Australia: Private Sector Credit, m/m, February 0.3% (forecast 0.5%)
-
02:00
New Zealand: ANZ Business Confidence, February 11.3
-
01:51
Japan: Industrial Production (MoM) , February 2.0% (forecast 1.2%)
-
01:51
Japan: Industrial Production (YoY), February 3.7%
-
01:46
Japan: Household spending Y/Y, February -3.8% (forecast -1.7%)
-
01:46
Japan: Unemployment Rate, February 2.8% (forecast 3%)
-
01:32
Japan: Tokyo CPI ex Fresh Food, y/y, March -0.4% (forecast -0.2%)
-
01:31
Japan: National CPI Ex-Fresh Food, y/y, February 0.2% (forecast 0.2%)
-
01:31
Japan: National Consumer Price Index, y/y, February 0.3% (forecast 0.3%)
-
01:30
Japan: Tokyo Consumer Price Index, y/y, March -0.4% (forecast -0.2%)
-
00:29
Commodities. Daily history for Mar 30’02’2017:
(raw materials / closing price /% change)
Oil 50.33 -0.04%
Gold 1,241.50 -0.28%
-
00:28
Stocks. Daily history for Mar 30’2017:
(index / closing price / change items /% change)
Nikkei -154.26 19063.22 -0.80%
TOPIX -14.48 1527.59 -0.94%
Hang Seng -90.96 24301.09 -0.37%
CSI 300 -28.43 3436.76 -0.82%
Euro Stoxx 50 +6.31 3481.58 +0.18%
FTSE 100 -4.20 7369.52 -0.06%
DAX +53.43 12256.43 +0.44%
CAC 40 +20.60 5089.64 +0.41%
DJIA +69.17 20728.49 +0.33%
S&P 500 +6.93 2368.06 +0.29%
NASDAQ +16.80 5914.34 +0.28%
S&P/TSX -78.87 15578.76 -0.50%
-
00:28
Currencies. Daily history for Mar 30’2017:
(pare/closed(GMT +2)/change, %)
EUR/USD $1,0681 -0,81%
GBP/USD $1,2468 +0,25%
USD/CHF Chf1,0006 +0,46%
USD/JPY Y111,84 +0,75%
EUR/JPY Y119,45 -0,05%
GBP/JPY Y139,43 +0,99%
AUD/USD $0,7645 -0,29%
NZD/USD $0,6998 -0,57%
USD/CAD C$1,3334 +0,05%
-
00:04
Schedule for today,Friday, Mar 31’2017 (GMT0)
00:00 New Zealand ANZ Business Confidence February 16.6
00:30 Australia Private Sector Credit, m/m February 0.2% 0.5%
00:30 Australia Private Sector Credit, y/y February 5.4%
01:00 China Manufacturing PMI March 51.6 51.6
01:00 China Non-Manufacturing PMI March 54.2
05:00 Japan Construction Orders, y/y February 1.1%
05:00 Japan Housing Starts, y/y February 12.8% -1.1%
06:00 United Kingdom Nationwide house price index, y/y March 4.5% 4.1%
06:00 United Kingdom Nationwide house price index March 0.6% 0.4%
06:00 Germany Retail sales, real unadjusted, y/y February 2.3% 0.3%
06:00 Germany Retail sales, real adjusted February -0.8% 0.7%
06:45 France CPI, y/y (Preliminary) March 1.2%
06:45 France CPI, m/m (Preliminary) March 0.1% 0.7%
07:55 Germany Unemployment Rate s.a. March 5.9% 5.9%
07:55 Germany Unemployment Change March -14 -10
08:30 United Kingdom Business Investment, y/y (Finally) Quarter IV -2.2% -0.9%
08:30 United Kingdom Business Investment, q/q (Finally) Quarter IV 0.4% -1%
08:30 United Kingdom Current account, bln Quarter IV -25.5 -16
08:30 United Kingdom GDP, q/q (Finally) Quarter IV 0.6% 0.7%
08:30 United Kingdom GDP, y/y (Finally) Quarter IV 2.2% 2%
09:00 Eurozone Harmonized CPI ex EFAT, Y/Y (Preliminary) March 0.9%
09:00 Eurozone Harmonized CPI, Y/Y (Preliminary) March 2% 1.8%
09:00 Eurozone ECB's Benoit Coeure Speaks
12:30 Canada GDP (m/m) January 0.3% 0.3%
12:30 U.S. Personal spending February 0.2% 0.2%
12:30 U.S. Personal Income, m/m February 0.4% 0.4%
12:30 U.S. PCE price index ex food, energy, m/m February 0.3% 0.2%
12:30 U.S. PCE price index ex food, energy, Y/Y February 1.7% 1.7%
13:30 U.S. FOMC Member James Bullard Speaks
13:45 U.S. Chicago Purchasing Managers' Index March 57.4 56.9
14:00 U.S. Reuters/Michigan Consumer Sentiment Index (Finally) February 96.3 97.6
14:00 U.S. FOMC Member Kashkari Speaks
21:00 United Kingdom MPC Member Andy Haldane Speaks
-