- USD/CNH Price Analysis: RSI divergence tests bears around $6.3700
Market news
USD/CNH Price Analysis: RSI divergence tests bears around $6.3700
- USD/CNH refreshes 5.5-month low before the latest rebound.
- Bullish RSI divergence inside falling wedge keeps buyers hopeful.
- 10, 20-DMA confluence guards immediate upside, bears can aim for $6.3300.
USD/CNH consolidates intraday losses around the lowest levels since May 31 ahead of Tuesday’s European session. That said, the quote seesaws around $6.3700 by the press time.
In doing so, the offshore Chinese currency (CNH) pair remains inside a 10-week-old falling wedge bullish chart pattern as the RSI conditions diverge with the recent lower-low formation, suggesting a pullback in prices.
It should, however, be noted that a convergence of the 10-DMA and the 20-DMA near $6.3900 can challenge the corrective pullback before fueling the quote towards the stated wedge’s resistance line near $6.40.
In a case where the USD/CNH buyers manage to cross the $6.40 threshold on a daily closing basis, the pair confirms the bullish formation and can aim for the theoretical target surrounding July’s top of $6.5285.
During the run-up, $6.4250 and tops marked in September around $6.4800 will be the key to watch.
If at all the USD/CNH bears refrain from releasing the controls, the yearly bottom close to $6.3525 and lower line of the wedge, near $6.3350, may flash on the chart.
USD/CNH: Daily chart
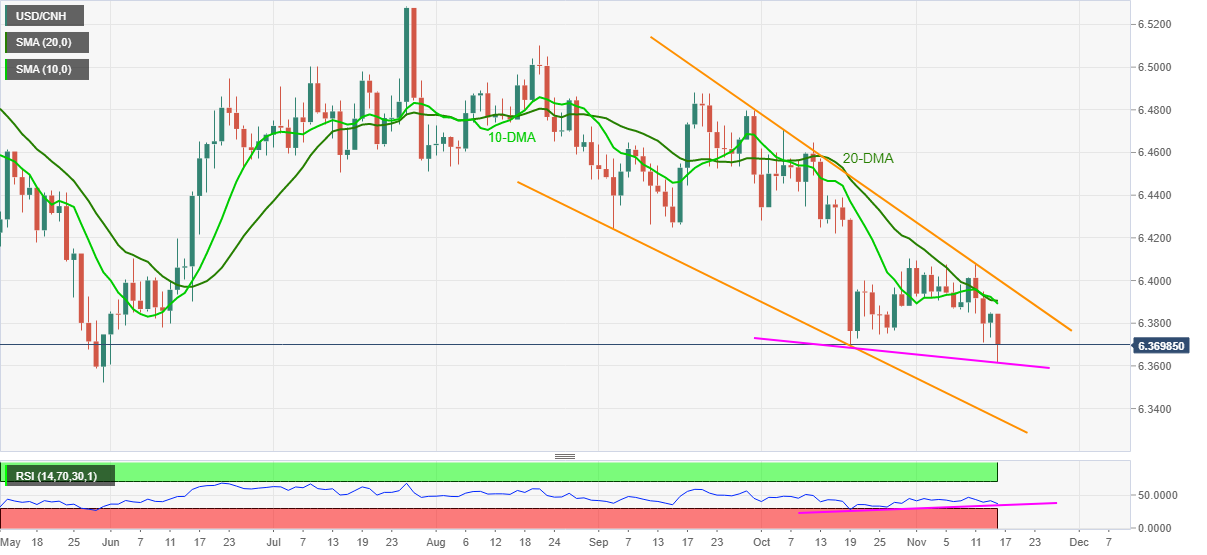
Trend: Corrective pullback expected