- AUD/USD Price Analysis: Bears stay on the attack despite pullback
Market news
2 tháng 12 2021
AUD/USD Price Analysis: Bears stay on the attack despite pullback
- AUD/USD is dangerously close to breaking to the downside again.
- The daily chart points to a test of the recent lows down at 0.7062 and 0.7030 thereafter.
As per the prior analysis, AUD/USD Price Analysis: High forex vol points to continuation to weekly support, the price is moving in on the weekly lows:
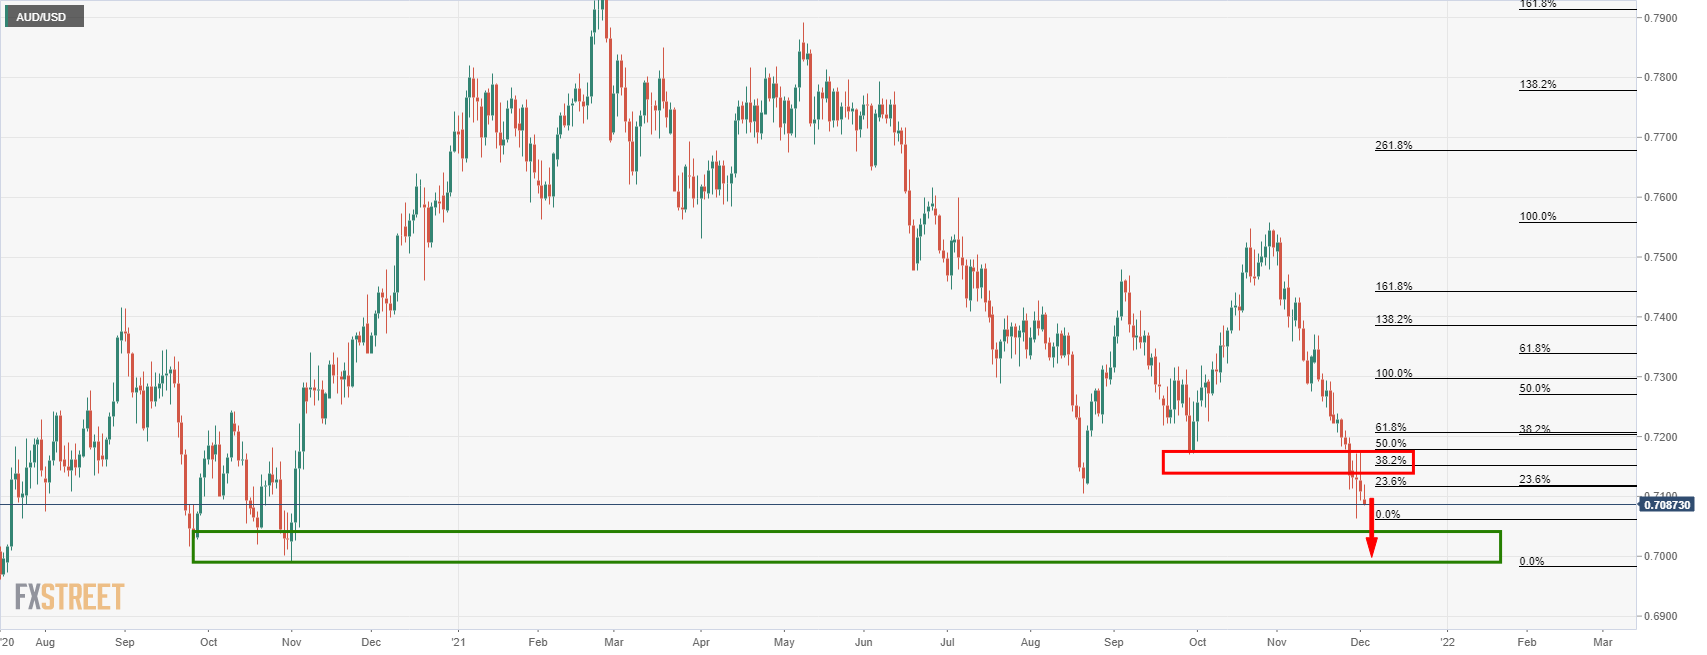
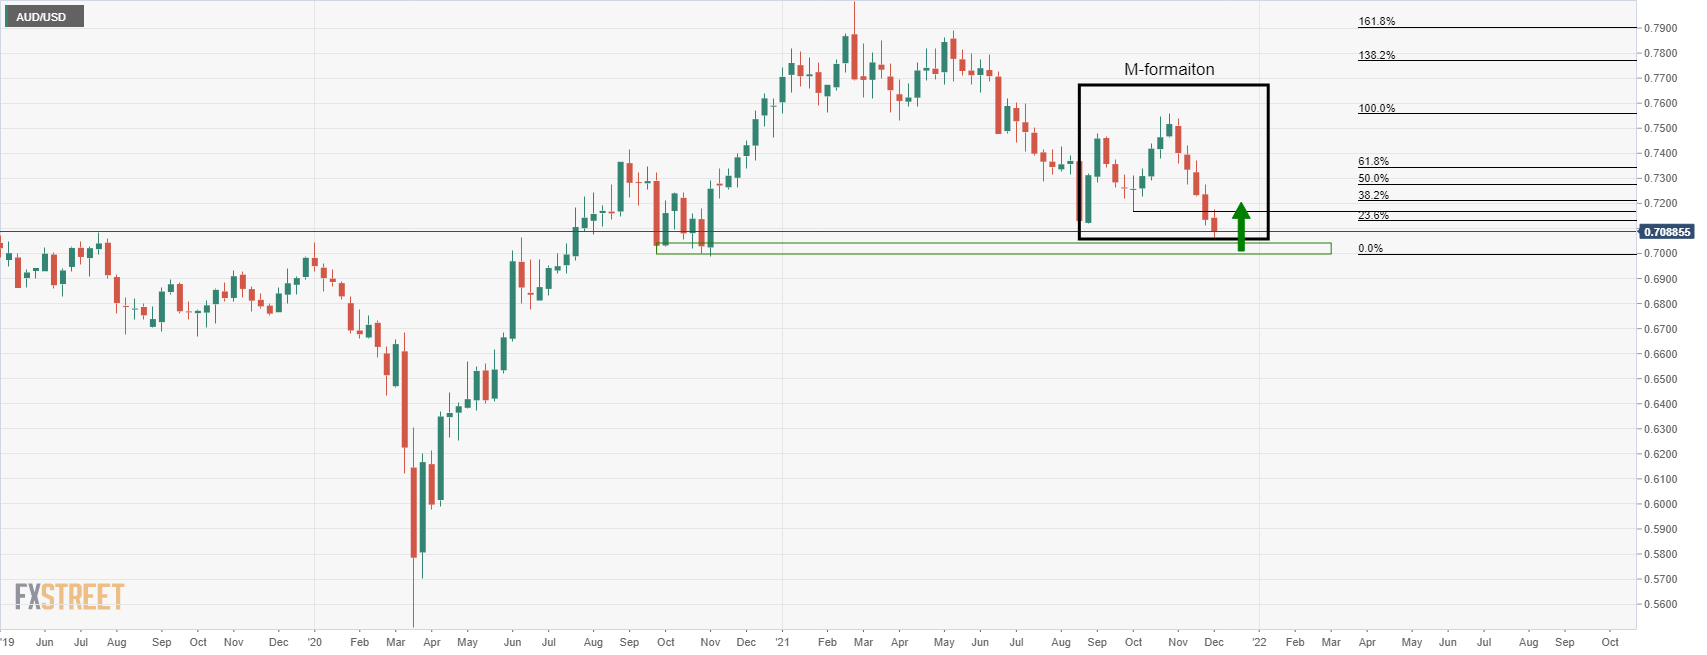
In the daily chart above, the weekly lows are illustrated with 0.6990 eyed as a potential target on a break of 0.7030. With that below said, the weekly chart's M-formation is a bullish reversion pattern that should be noted as well.
AUD/USD H1 chart
Meanwhile, the pull back on the hourly chart has not made it to a 38.25 Fibonacci retracement level and instead stalled at 0.7120, staying blow the 21-EMA:
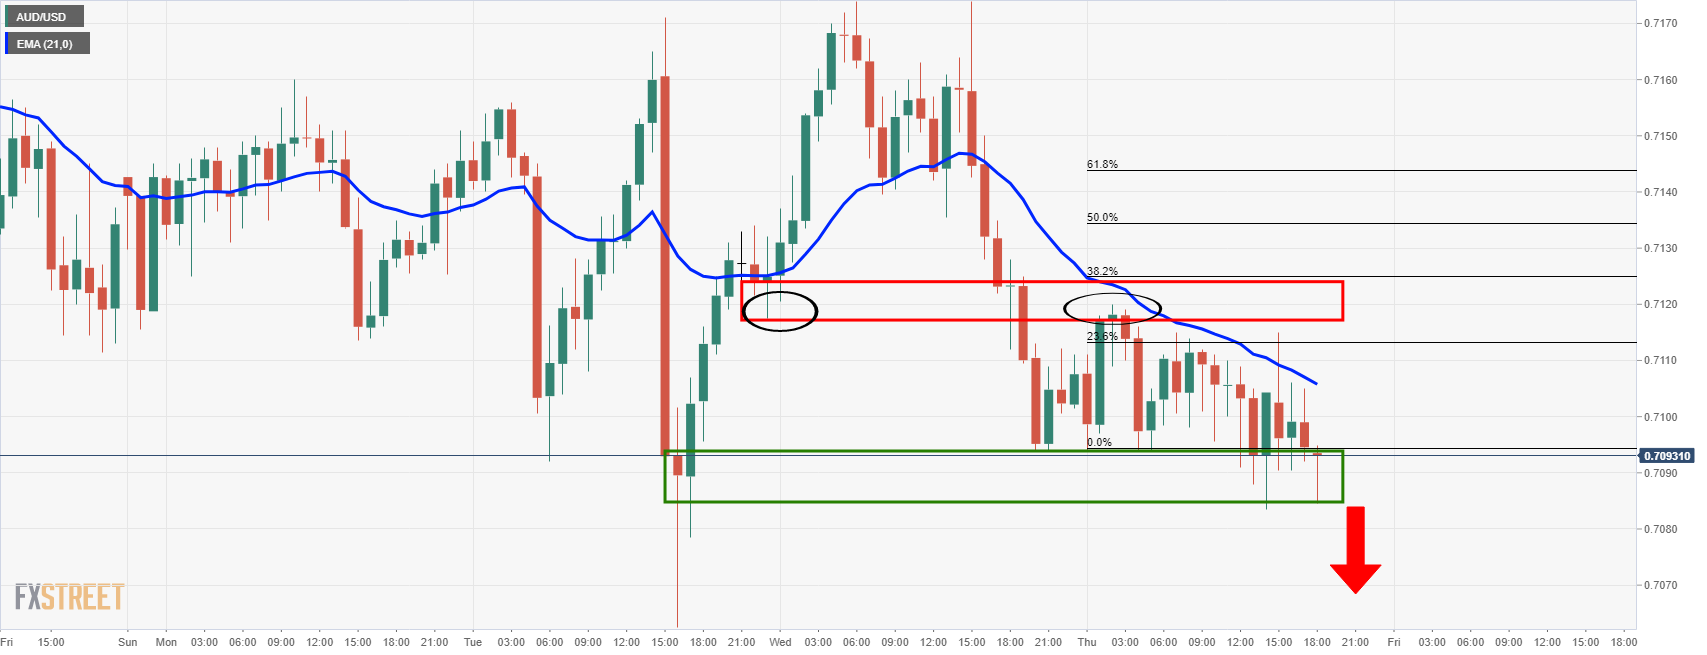
Bears will want to see a break of the 0.7080 support before fully engaging, or otherwise face the risk of a trapped market between support and resistance.
Market Focus
Open Demo Account & Personal Page