- US Dollar Index Price Analysis: Key SMAs defend DXY bulls inside ascending triangle
Market news
US Dollar Index Price Analysis: Key SMAs defend DXY bulls inside ascending triangle
- DXY prints mild gains, keeps rebound from 50-SMA, 100-SMA confluence.
- MACD teases sellers inside bearish chart pattern, 200-SMA adds to the downside filters.
- 97.00, July 2020 top act as extra hurdle to the north.
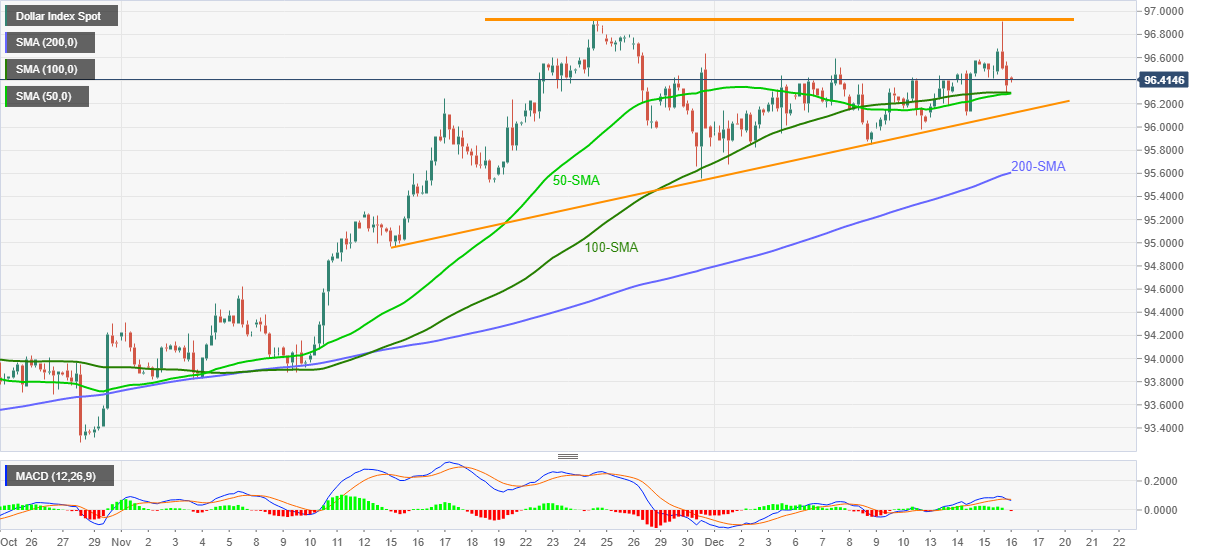
US Dollar Index (DXY) keeps the bounce off the key SMA confluence around 96.40 during early Thursday.
The greenback gauge recovered from a convergence of the 100-SMA and 50-SMA the previous day while staying inside an ascending triangle bearish chart pattern.
As the MACD line teases bear cross and the DXY remains inside a bearish formation, a clear downside break of the stated triangle’s support line, around 96.10, will portray a notable south-run towards the theoretical target near 94.00.
During the fall, the 200-SMA level of 95.60 and the mid-November swing low near 95.00 can act as intermediate halts.
Meanwhile, recovery moves remain elusive below the triangle’s resistance, close to the 97.00 round-figure, a break of which will direct US Dollar Index bulls towards July 2020 peak near 97.80.
To sum up, the DXY bulls keep controls inside a bearish chart formation, suggesting further grinding towards the north.
Also read: Fed Quick Analysis: Hawks attack with shift to three hikes in 2022, King dollar to end 2021 on top
DXY: Four-hour chart
Trend: Pullback expected
 Material posted here is solely for information purposes and reliance on this may lead to losses. Past performances are not a reliable indicator of future results. Please read our full disclaimer