- USD/CAD Price Analysis: Break of weekly support directs bears to 200-HMA
Market news
USD/CAD Price Analysis: Break of weekly support directs bears to 200-HMA
- USD/CAD remains pressured after two-day downtrend, sidelined of late.
- 50% Fibonacci retracement, RSI rebound challenge sellers around the key moving average.
- Buyers will wait for a successful run-up beyond previous support line.
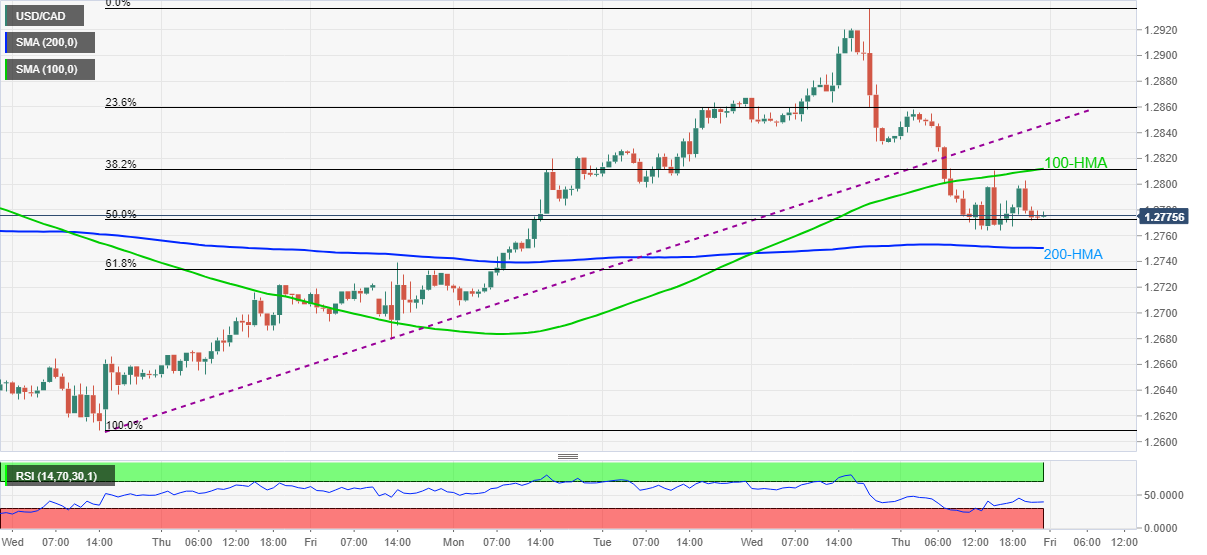
USD/CAD sellers keep reins around 1.2775, despite recently sidelined performance during Friday’s Asian session.
In doing so, the Loonie pair takes rounds to 50% Fibonacci retracement (Fibo.) of December 08-15 upside as the RSI line improves from oversold territory.
However, the corrective pullback has limited room to the north as a convergence of the 100-HMA and 38.2% Fibo. near 1.2815 will be a tough nut to crack for intraday buyers.
Even if the USD/CAD buyers manage to cross the 1.2815 hurdle, the support-turned-resistance line surrounding 1.2845 will challenge the advances before highlighting the 1.2900 threshold and the multi-month top of 1.2937 marked on Wednesday.
Meanwhile, a clear downside break of the 50% Fibonacci retracement level close to 1.2770 will be challenged by the 200-HMA and 61.8% Fibo., respectively around 1.2750 and 1.2730.
In a case where USD/CAD prices remain bearish past 1.2730, the December 10 swing low near 1.2680 can offer an intermediate halt during the fall to the monthly low near 1.2600.
USD/CAD: Hourly chart
Trend: Sideways
 Material posted here is solely for information purposes and reliance on this may lead to losses. Past performances are not a reliable indicator of future results. Please read our full disclaimer