- EUR/JPY Price Analysis: Bears are moving in, eye a break of 128.10
Market news
20 tháng 12 2021
EUR/JPY Price Analysis: Bears are moving in, eye a break of 128.10
- EUR/JPY is at risk of a downside correction should 128.10 give way to bearish pressures.
- 127.90 guards a deeper resumption of the dominant bear trend.
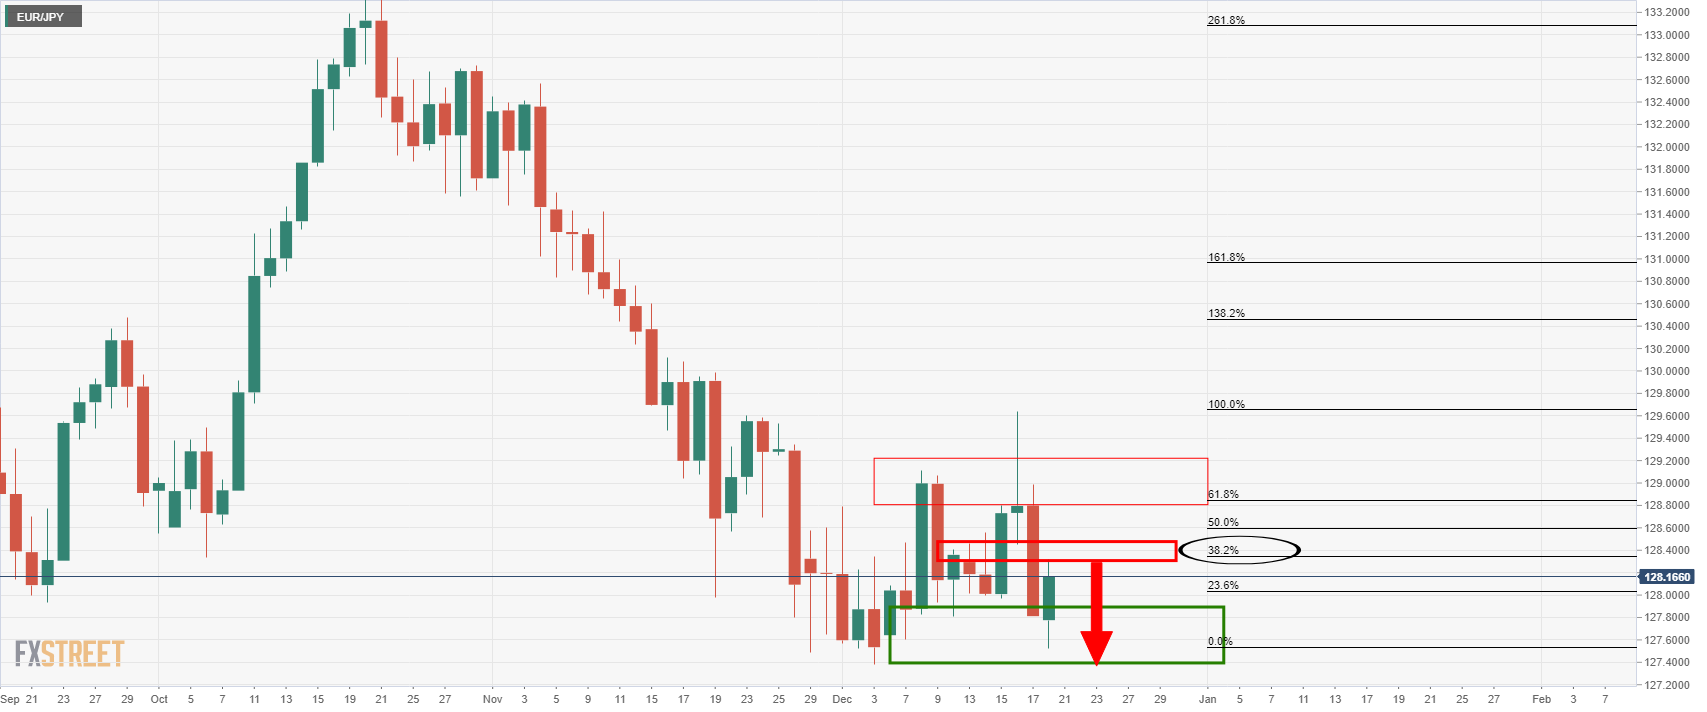
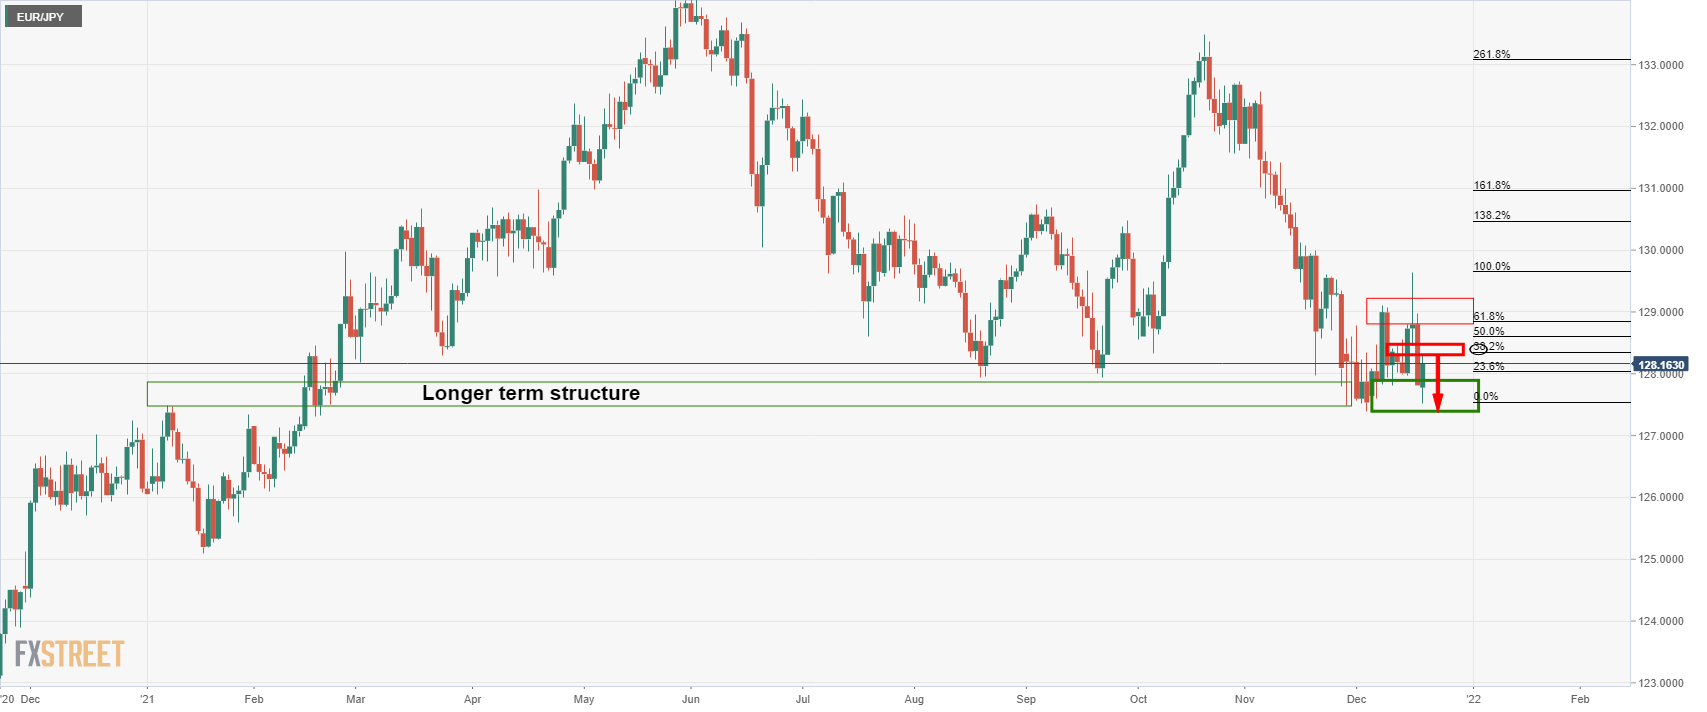
The daily chart shows that the price is consolidating and has reached a 38.2% Fibonacci retracement level. This would be expected to hold on to initial tests and then potentially lead to a downside test of support once again.
The following illustrates the market's structure and the downside bias from both a daily and shorter-term perspective:
EUR/JPY daily chart
EUR/JPY H1 chart
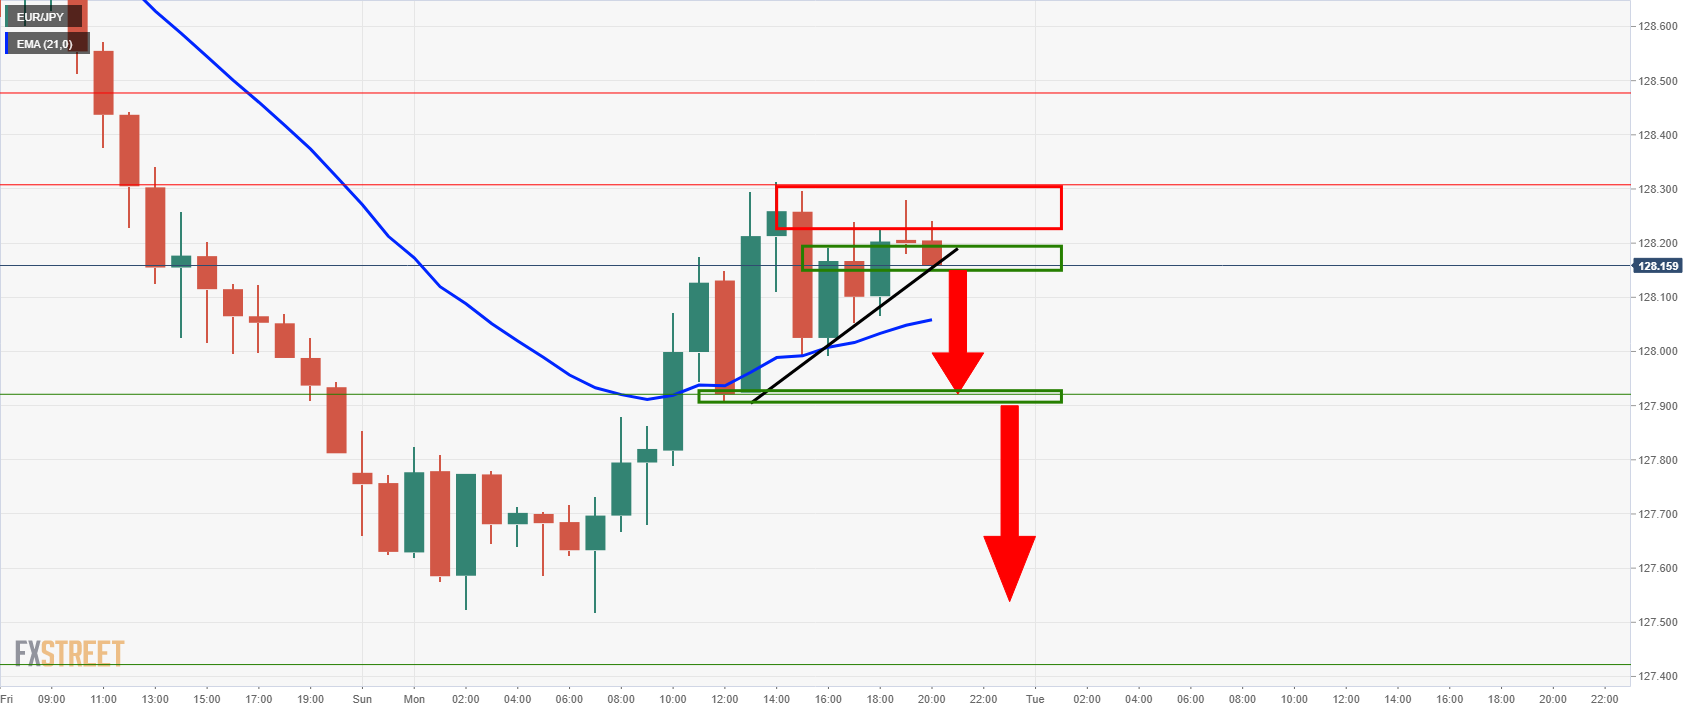
From this hourly perspective, we can see that the price is struggling at a meanwhile resistance and given the temperament of the market, that is to say consolidative with a risk-off tone, the bias is to the downside. A break of the current trendline opens risk to test the prior hourly support near 127.90. If this were to give, then the daily support will be vulnerable near to 127.50.
Market Focus
 Material posted here is solely for information purposes and reliance on this may lead to losses. Past performances are not a reliable indicator of future results. Please read our full disclaimer
Open Demo Account & Personal Page