- USD/CAD Price Analysis: Extends pullback towards 1.2900 inside rising wedge
Market news
USD/CAD Price Analysis: Extends pullback towards 1.2900 inside rising wedge
- USD/CAD remains pressured inside a bearish chart pattern after stepping back from yearly top.
- RSI retreat, MACD conditions suggest further downside but 1.2690 becomes a tough nut to crack for bears.
- Bulls need to cross 1.2975 to keep the reins.
USD/CAD drops towards 1.2900, extending the previous day’s pullback from the yearly top, during Wednesday’s Asian session. In doing so, the Loonie pair post the second consecutive daily loss while staying inside a bearish chart pattern called a rising wedge.
Given the recently flashed bearish MACD signal and RSI retreat from the overbought zone, USD/CAD declines are likely to stretch longer.
While the 1.2900 may entertain intraday sellers, a downside break of the stated wedge’s support line near 1.2840, will open the door for the USD/CAD downturn towards the mid-November lows near 1.2490.
However, a convergence of the 200-SMA and a five-week-old support line, near 1.2690, is strong support to break for keeping the USD/CAD bears in the driver’s seat after 1.2840.
Alternatively, recovery moves remain elusive until staying below the wedge’s resistance line near 1.2975.
Even so, the 1.30000 psychological magnet will be crucial before USD/CAD bulls eye the November 2020 peak of 1.3172.
USD/CAD: Four-hour chart
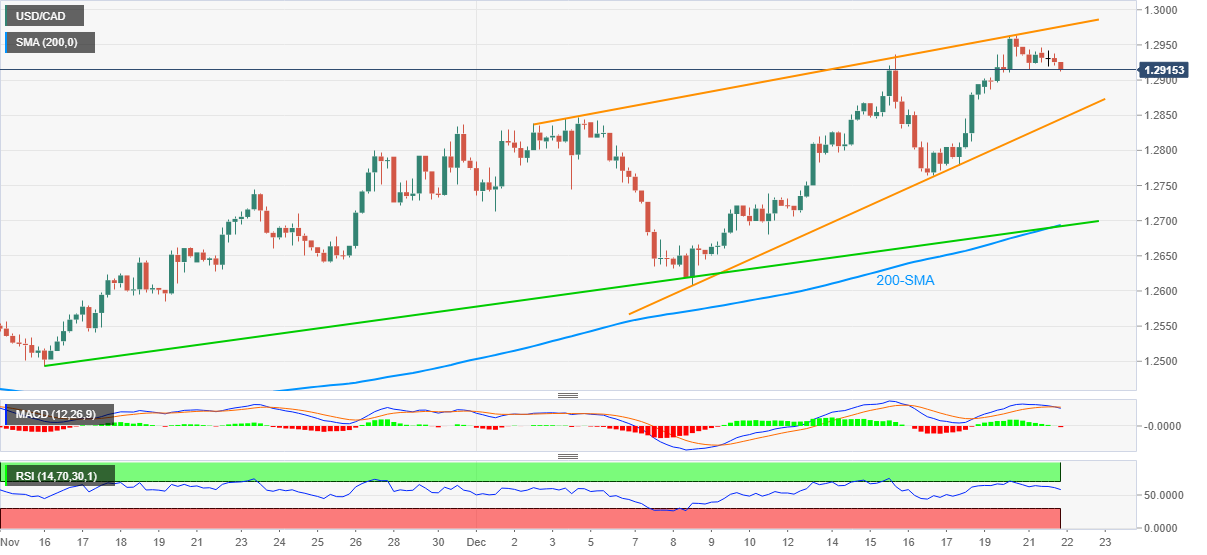
Trend: Further weakness expected
 Material posted here is solely for information purposes and reliance on this may lead to losses. Past performances are not a reliable indicator of future results. Please read our full disclaimer