- Gold Price Forecast: XAU/USD key levels to watch heading into 2022 – Confluence Detector
Market news
Gold Price Forecast: XAU/USD key levels to watch heading into 2022 – Confluence Detector
- Gold price remains depressed in a familiar range around the $1,800 mark.
- 10-year US Treasury yields are back above 1.50%, pressurizing gold price.
- Gold 2022 Outlook: Correlation with US T-bond yields to drive yellow metal.
Amid thin-year end liquidity conditions, gold price continues to trade choppy within familiar levels, largely pivoting around the $1,800 mark. The downbeat sentiment around gold price could be attributed to a broad-based US dollar rebound, aided by the recent strength in the Treasury yields. The 10-year rates have recaptured the 1.50% key level, which warrants caution for gold bulls. Going forward the year-end repositioning in the greenback will continue to have a significant impact on gold while thin conditions could exaggerate the moves.
Read: Gold Price Forecast: Year-end flows to keep XAU/USD choppy around $1,800
Gold Price: Key levels to watch
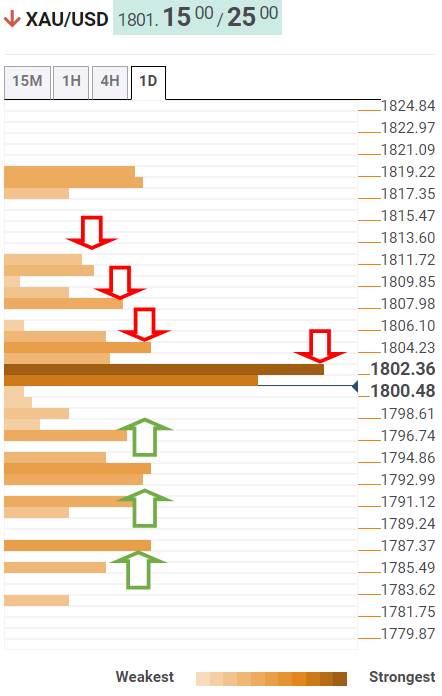
The Technical Confluences Detector shows that the gold price is struggling to recapture strong resistance at $1,803, which is the intersection of the Fibonacci 38.2% one-week, Fibonacci 61.8% one-day and SMA10 one-day.
The immediate upside will then be capped by the Fibonacci 38.2% one-month of $1,806. The previous day’s high of $1,808 will provide another roadblock to gold buyers.
Acceptance above the latter could fuel a renewed uptick towards the previous week’s high of $1,811, above which the December top of $1,820 will be on the bulls’ radars.
On the flip side, the Fibonacci 38.2% one-day at $1,796 will get tested on a sustained move below $1,800.
A dense cluster of healthy support levels is aligned around $1,793, which will be a powerful cap. That price zone comprises of the SMA100 four-hour, Fibonacci 23.6% one-day and pivot point one-week S1.
SMA100 one-day at $1,791 will be the next downside target, below which sellers will aim for the Fibonacci 23.6% one-month at $1,787.
Here is how it looks on the tool
About Technical Confluences Detector
The TCD (Technical Confluences Detector) is a tool to locate and point out those price levels where there is a congestion of indicators, moving averages, Fibonacci levels, Pivot Points, etc. If you are a short-term trader, you will find entry points for counter-trend strategies and hunt a few points at a time. If you are a medium-to-long-term trader, this tool will allow you to know in advance the price levels where a medium-to-long-term trend may stop and rest, where to unwind positions, or where to increase your position size.
 Material posted here is solely for information purposes and reliance on this may lead to losses. Past performances are not a reliable indicator of future results. Please read our full disclaimer