- Gold Price Forecast: XAU/USD remains at the mercy of yields, key levels to watch – Confluence Detector
Market news
Gold Price Forecast: XAU/USD remains at the mercy of yields, key levels to watch – Confluence Detector
- Gold price to remain at the mercy of the Treasury yields’ price action.
- Powell likely to express concerns about US inflation ahead of Wednesday’s CPI.
- Gold 2022 Outlook: Correlation with US T-bond yields to drive yellow metal.
What is driving gold price higher? US Treasury yields sit close to the highest level in two years, as markets now price in four Fed rate hikes in 2022. Inflation emerges as a strong concern for the world’s most powerful central bank, as Chair Jerome Powell will likely say that the Fed will prevent inflation from becoming entrenched. Wednesday’s US Consumer Price Index (CPI) remains in the spotlight for a fresh direction on gold price.
Read: Gold Price Forecast: XAU/USD could extend the rebound if 50-DMA holds, focus on yields, US inflation
Gold Price: Key levels to watch
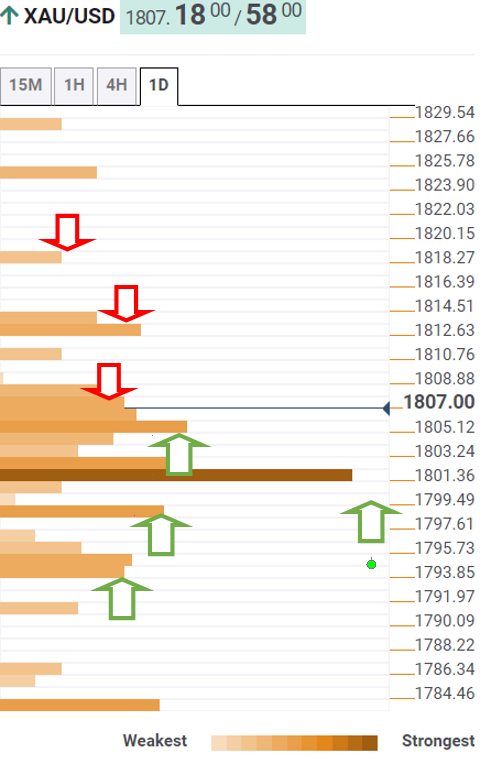
The Technical Confluences Detector shows that the gold price is heading towards a dense cluster of healthy resistance levels around $1,807, where SMA200 one-hour, SMA10 one-day and previous high four-hour coincide.
If the bullish momentum extends, then gold price could challenge the pivot point one-day R2 at $1,809, above which the confluence of the Fibonacci 61.8% one-week and Fibonacci 23.6% one-month at $1,813 will come into play.
Further up, buyers will aim for the pivot point one-day R3 at $1,818.
On the flip side, the immediate downside remains capped by $1,803, the SMA100 four-hour.
The next relevant support is seen around $1,801-$1800, which is the intersection of the SMA200 one-day, SMA100 one-hour and Fibonacci 38.2% one-month.
The Fibonacci 38.2% one-day at $1,798 will then come to the rescue of gold optimists. The last line of defense for bulls is envisioned at $1,794.
At that level, the Fibonacci 23.6% one-week meets with the SMA200 four-hour.
Here is how it looks on the tool
About Technical Confluences Detector
The TCD (Technical Confluences Detector) is a tool to locate and point out those price levels where there is a congestion of indicators, moving averages, Fibonacci levels, Pivot Points, etc. If you are a short-term trader, you will find entry points for counter-trend strategies and hunt a few points at a time. If you are a medium-to-long-term trader, this tool will allow you to know in advance the price levels where a medium-to-long-term trend may stop and rest, where to unwind positions, or where to increase your position size.
 Material posted here is solely for information purposes and reliance on this may lead to losses. Past performances are not a reliable indicator of future results. Please read our full disclaimer