- USD/JPY Price Analysis: Bulls move in and eye the 115 area
Market news
USD/JPY Price Analysis: Bulls move in and eye the 115 area
- USD/JPY bulls are stepping in to correct the price drop from overnight.
- The 115 area is in focus for the sessions ahead.
USD/JPY is trying to correct the strong bearish drop that occurred overnight and the following illustrate the market structure in a top-down analysis and the potential price flow.
USD/JPY daily charts
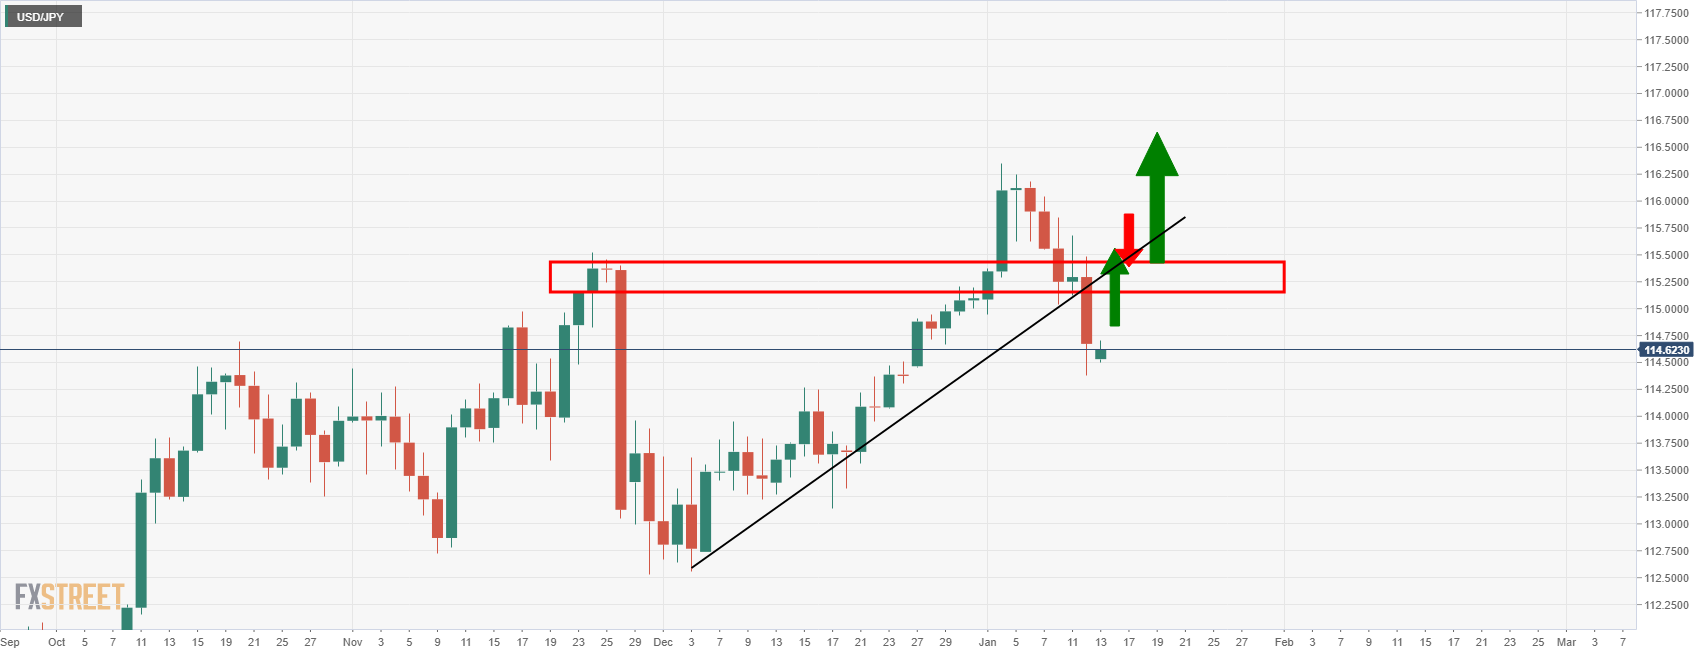
For the bulls, there is little prospect of an upside opportunity until the daily structure is broken once again. This falls in at around 115.40.
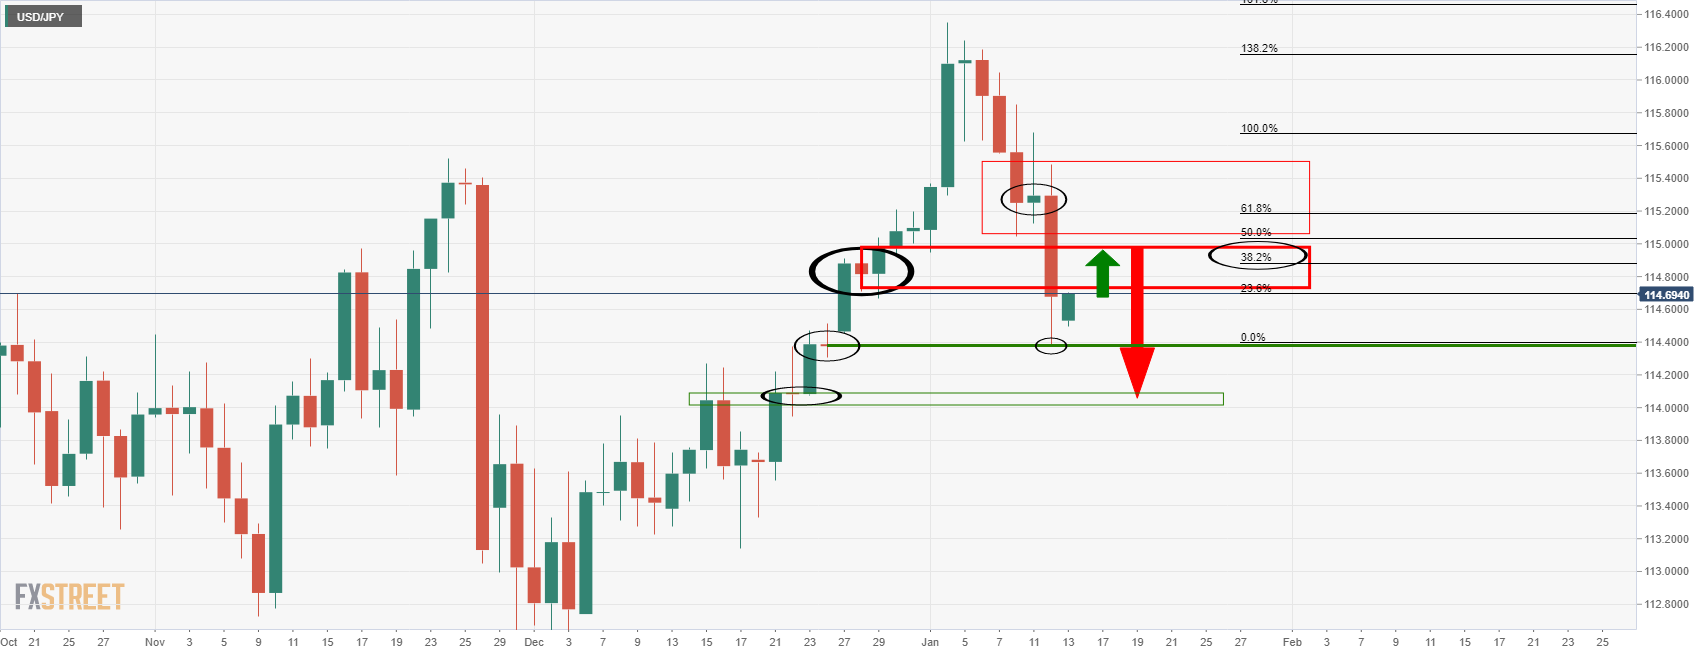
For the bears, a move towards 114.80/115.00 could be on the cards where a confluence of the 38.2% Fibonacci retracement and a 50% mean reversion come into line. This area might be expected to act as resistance on initial tests and potentially lead to a downside continuation.
USD/JPY H4 chart
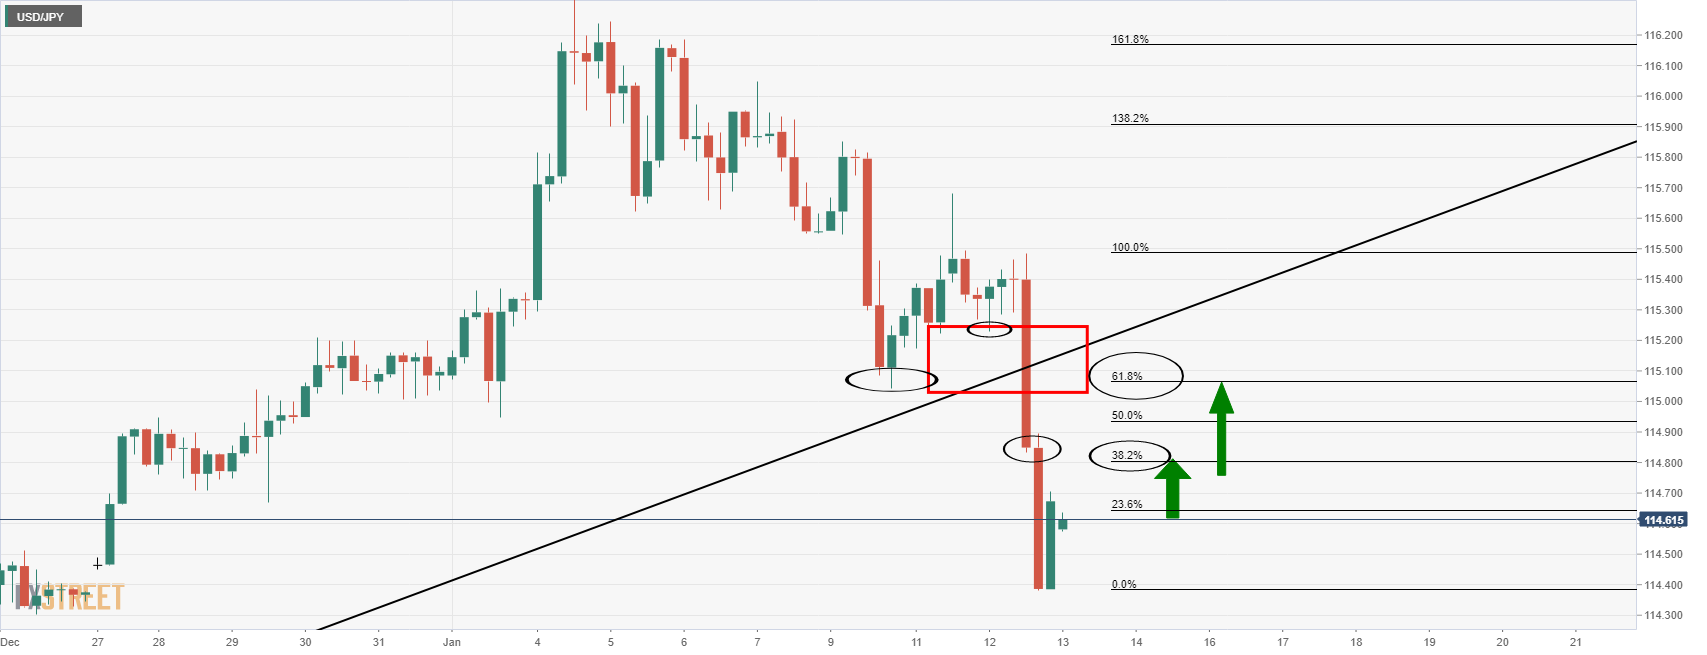
On the 4-hour chart, the price path could resemble something as illustrated above where the various structural levels of interest are eclipsed.
USD/JPY H1 chart
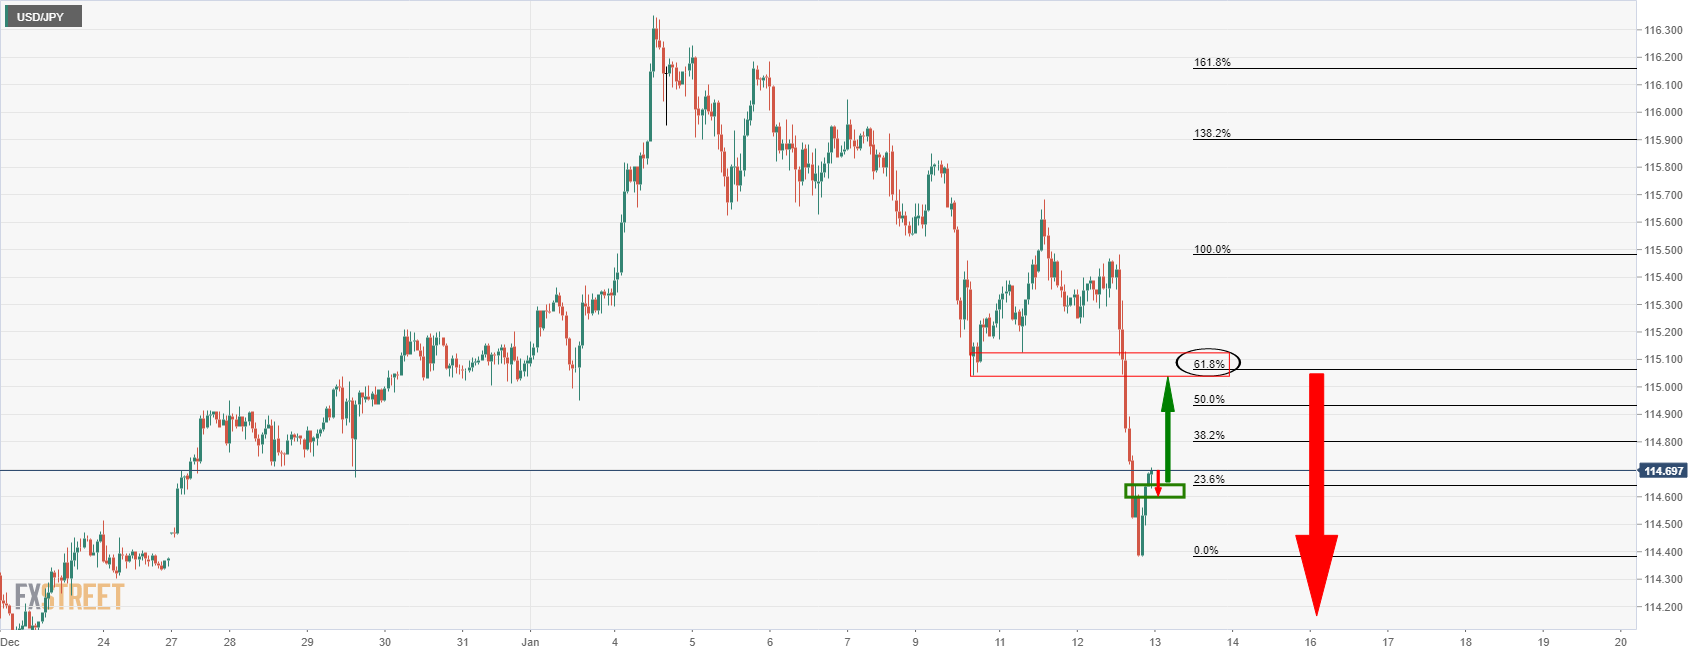
At this juncture, the price is above the hourly structure which could act as support on a retest and lead to a meanwhile bullish correction, again, towards the 115 figure. The 61.8% Fibo is located there also.
USD/JPY M15 chart
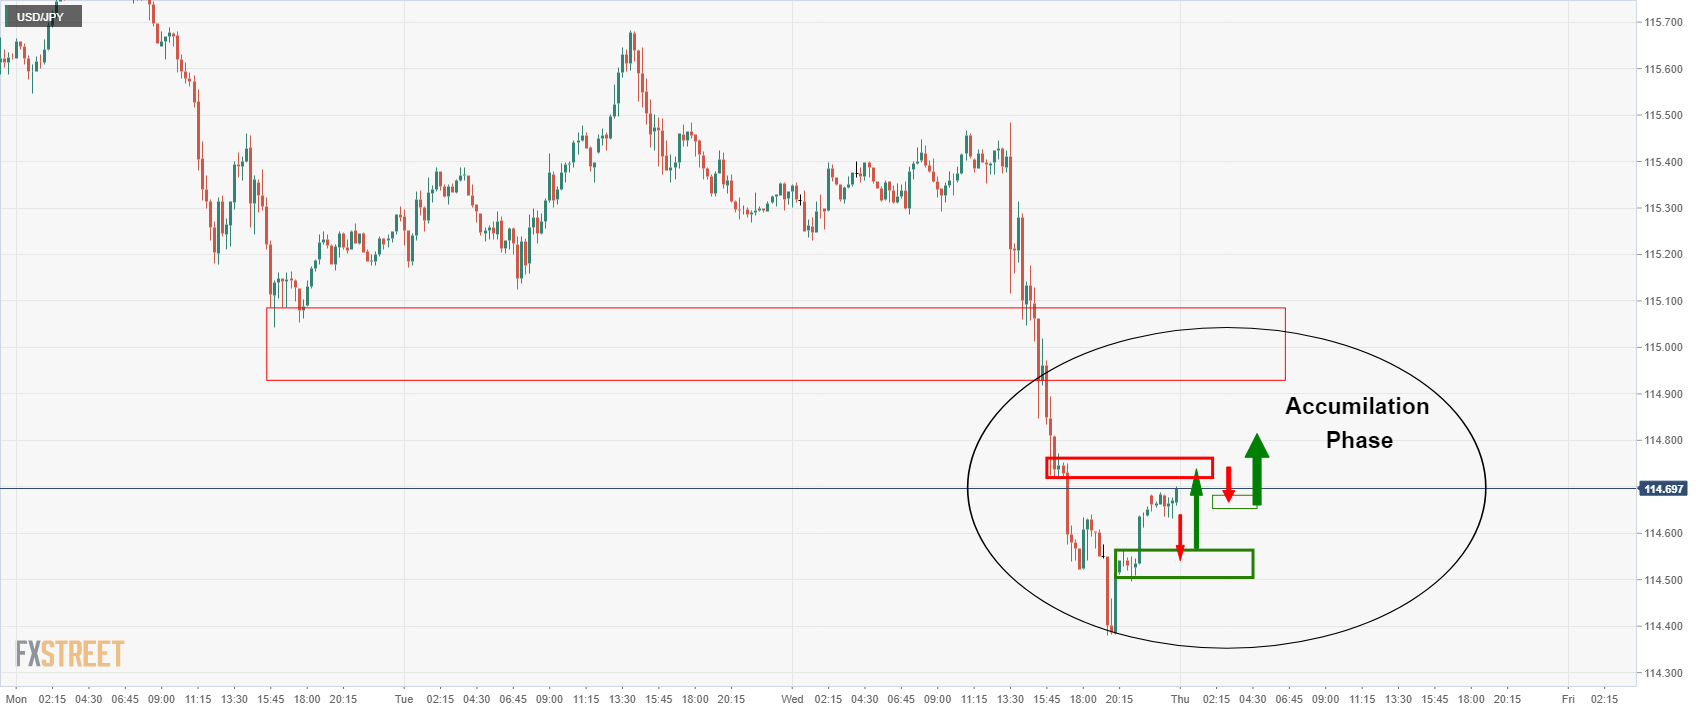
From a 15-min perspective, the price action could evolve in a phase of accumulation, similar to the above schematic.
 Material posted here is solely for information purposes and reliance on this may lead to losses. Past performances are not a reliable indicator of future results. Please read our full disclaimer