- EUR/USD Price Analysis: Bulls eye an extended rally towards monthly targets
Market news
EUR/USD Price Analysis: Bulls eye an extended rally towards monthly targets
- EUR/USD meets critical resistance and could be on the verge of a correction.
- The bears will be looking for a restest of the 1.1400 area.
- Bulls have their eyes on longer-term 1.17 area as a monthly objective.
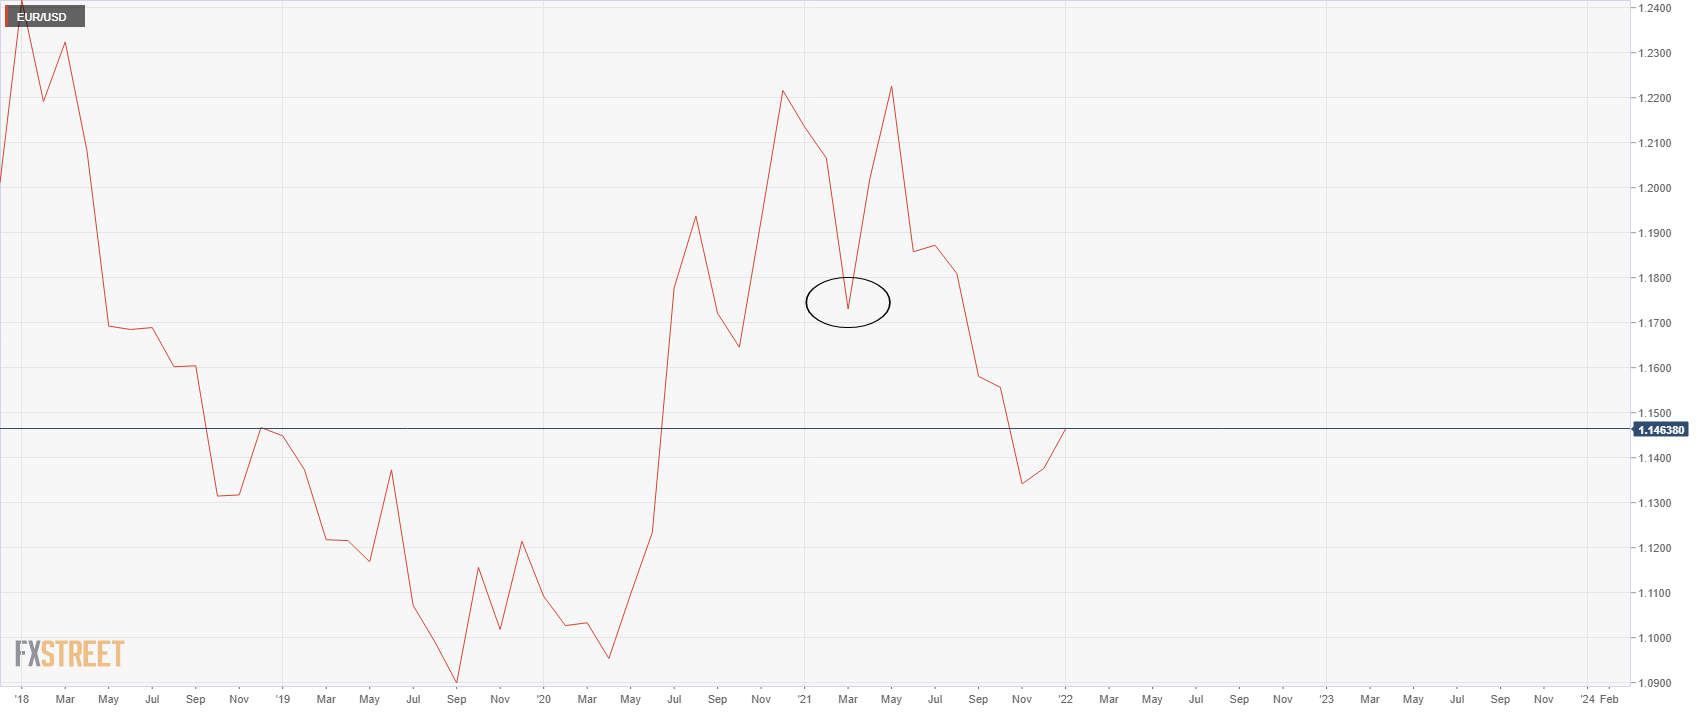
The price of EUR/USD is leaving a monthly M-formation which is seen with ease on the line chart for which is a reversion pattern. The price would be expected to revisit the neckline of the formation, in which case in the above illustration is identified near 1.1730.
EUR/USD monthly chart
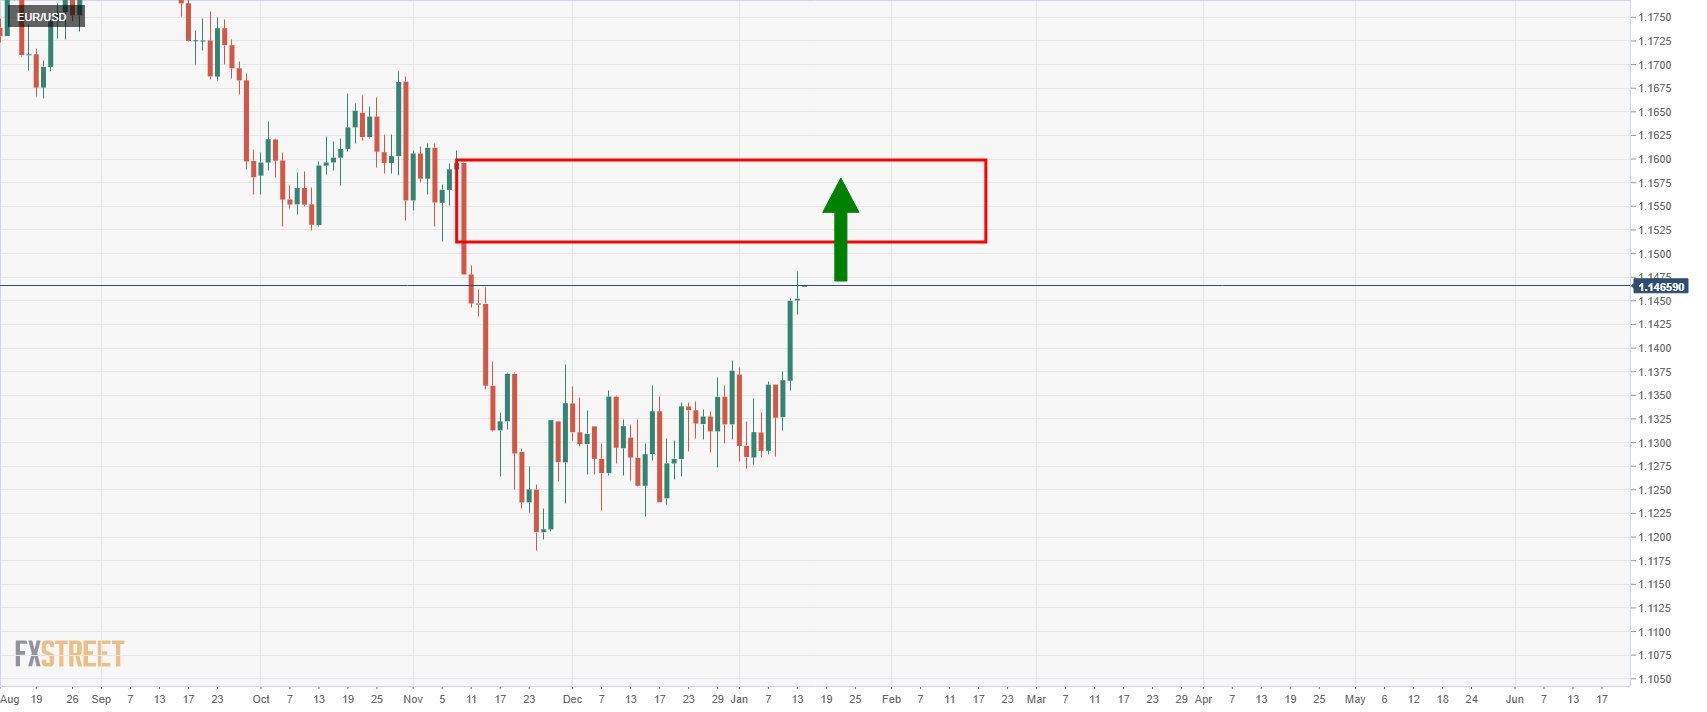
However, there is plenty of resistance structure on the way there and ground to cover. The first notable area of resistance will be within the 1.15 area as seen on the daily chart as follows:
the, on a lower time frame basis, we can identify some Wycoff methodology characteristics as follows:
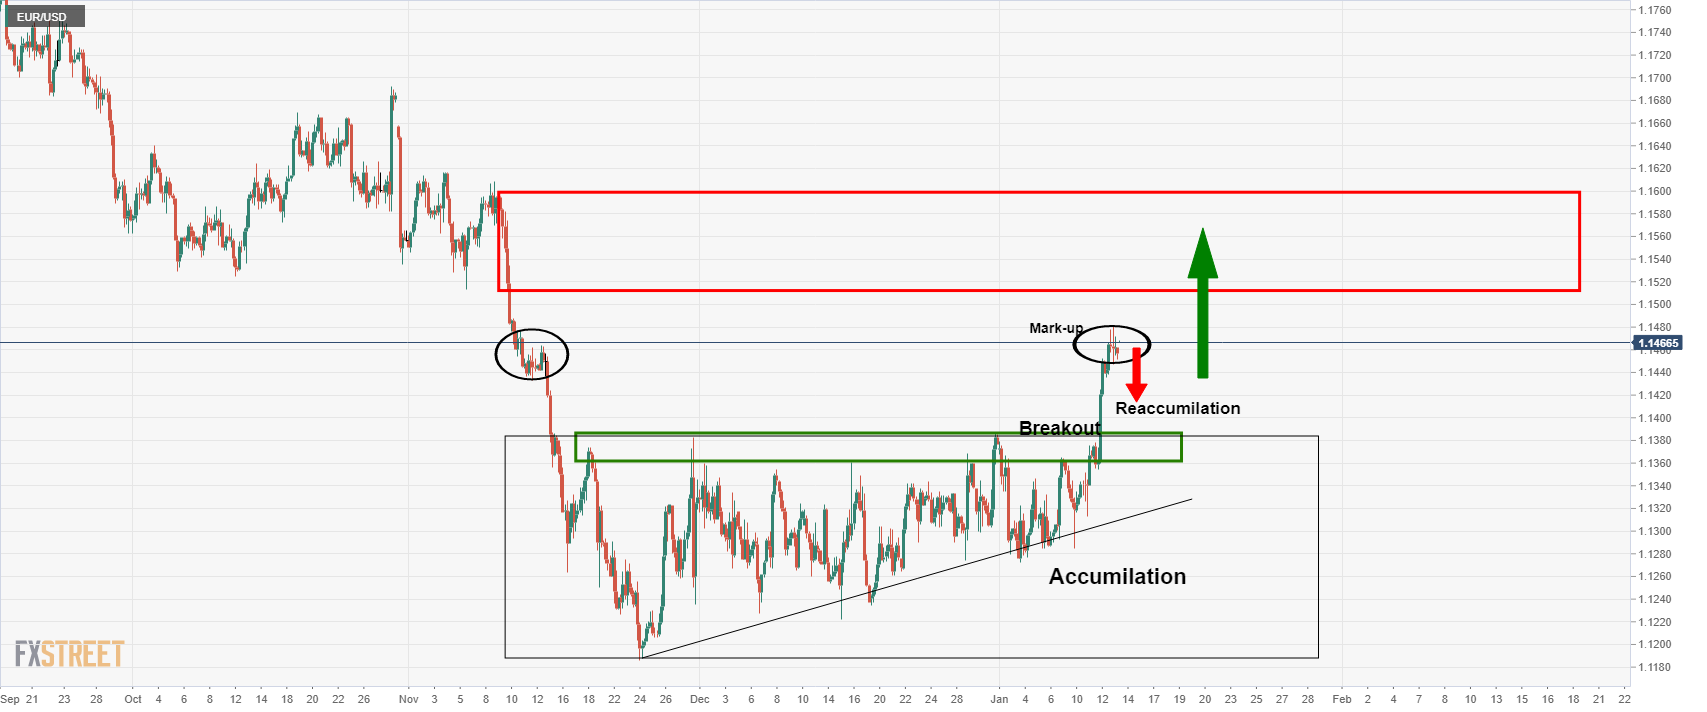
The 4-hour chart shows a period of accumulation that has recently seen a breakout, termed as the ''mark-up''. There is only so far that the price can rally before it meets sellers and should the buyers move in at a discount, then the price would be expected to ''accumulate'' and move higher to mitigate the next imbalance of price towards the monthly M-formation's neckline.
This process would be expected to take days, if not weeks to play out, however:
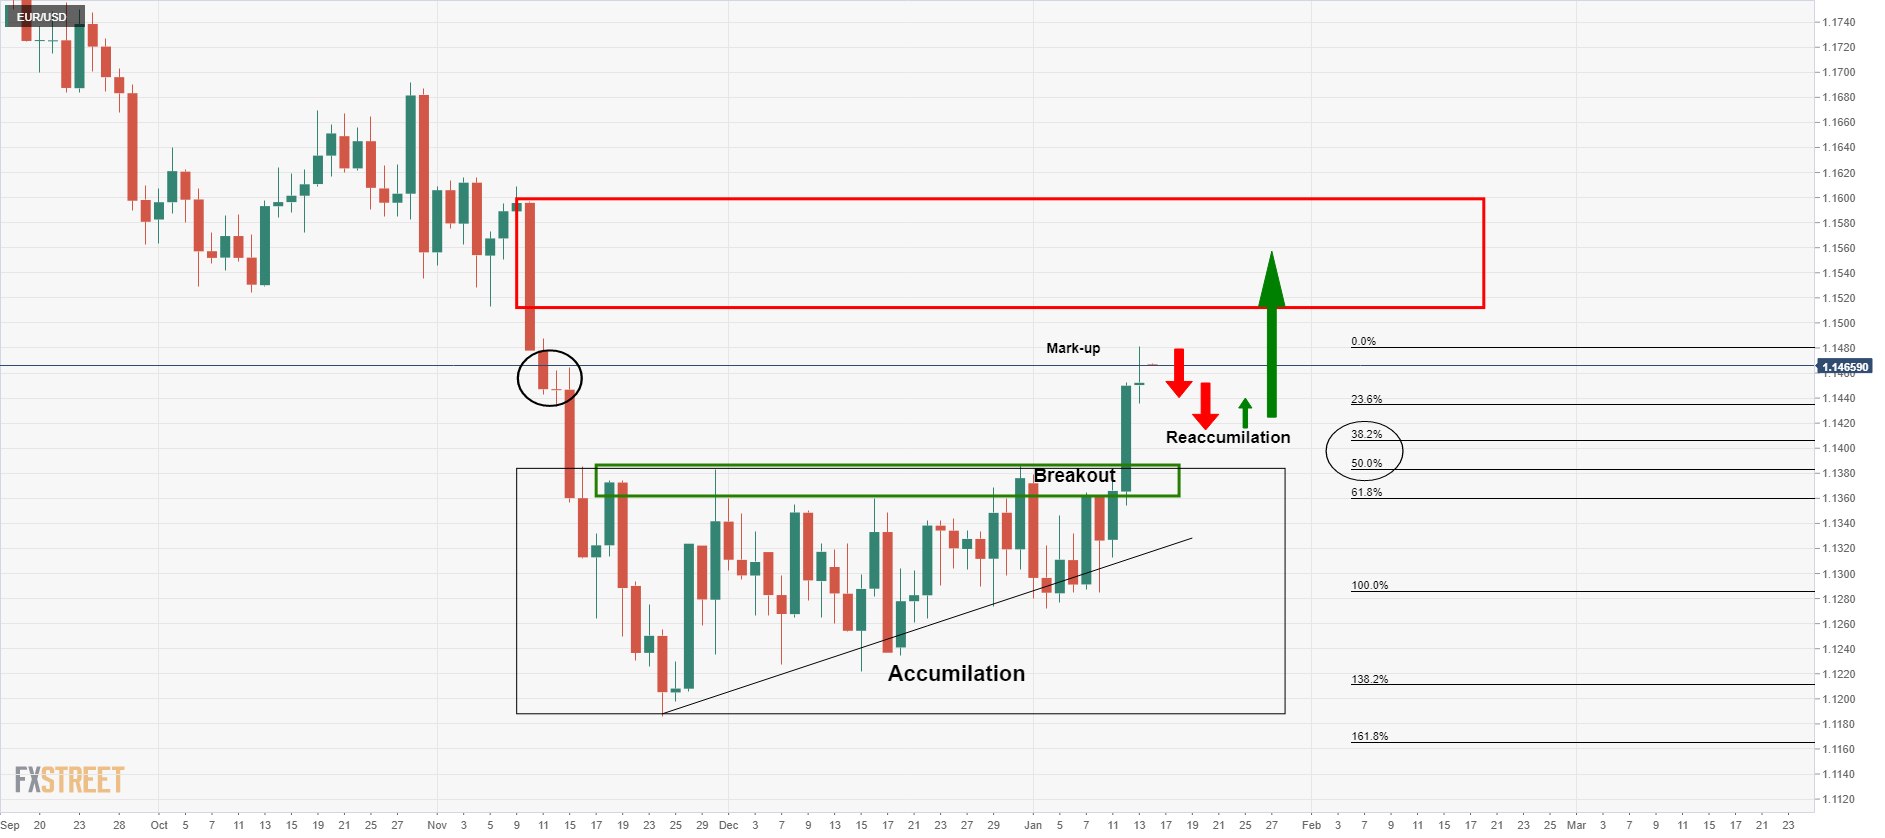
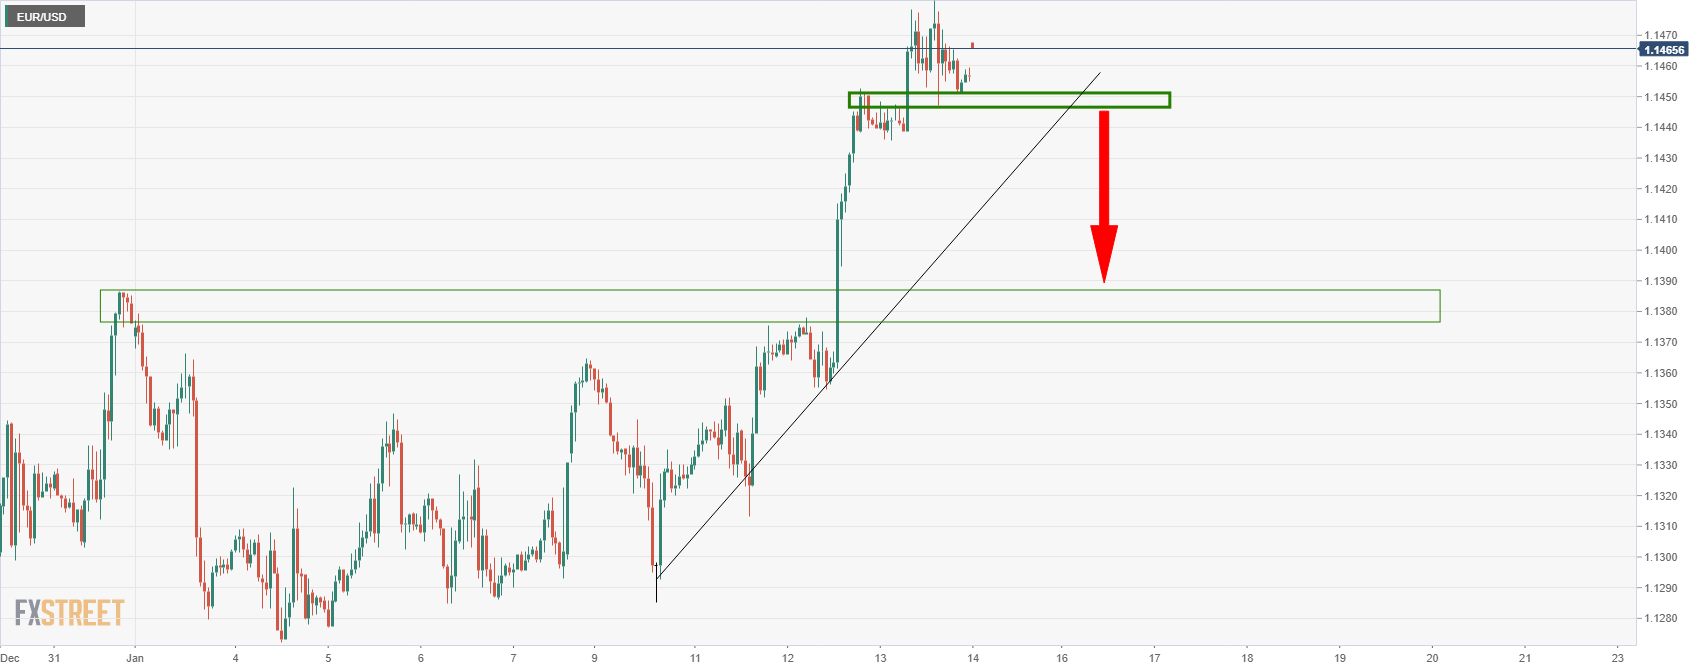
From a daily perspective, the bears will have their eye son at least a 38.2% Fibo retracement towards 1.14 the figure of not a full 50% mean reversion to the breakout point near 1.1380.
In the meantime, a sideways period of consolidation would be expected as per the following hourly chart:
 Material posted here is solely for information purposes and reliance on this may lead to losses. Past performances are not a reliable indicator of future results. Please read our full disclaimer