- GBP/JPY Price Analysis: Bears need to break critical support of 153.83
Market news
GBP/JPY Price Analysis: Bears need to break critical support of 153.83
- GBP/USD offers something for both the bulls and bears until the 4-hour support structure breaks.
- The bulls will want to see the 61.8% Fibo give on the 4-hour time frame.
As per the prior day's analysis, GBP/JPY Price Analysis: Bears sinking their teeth into what could be a fresh daily impulse, the price has moved accordingly within the corrective stage of the bearish trend.
The Fibonacci levels are in focus and for now, the space between the 38.2% ratio and the 50% mean reversion mark is offering resistance:
GBP/JPY daily chart
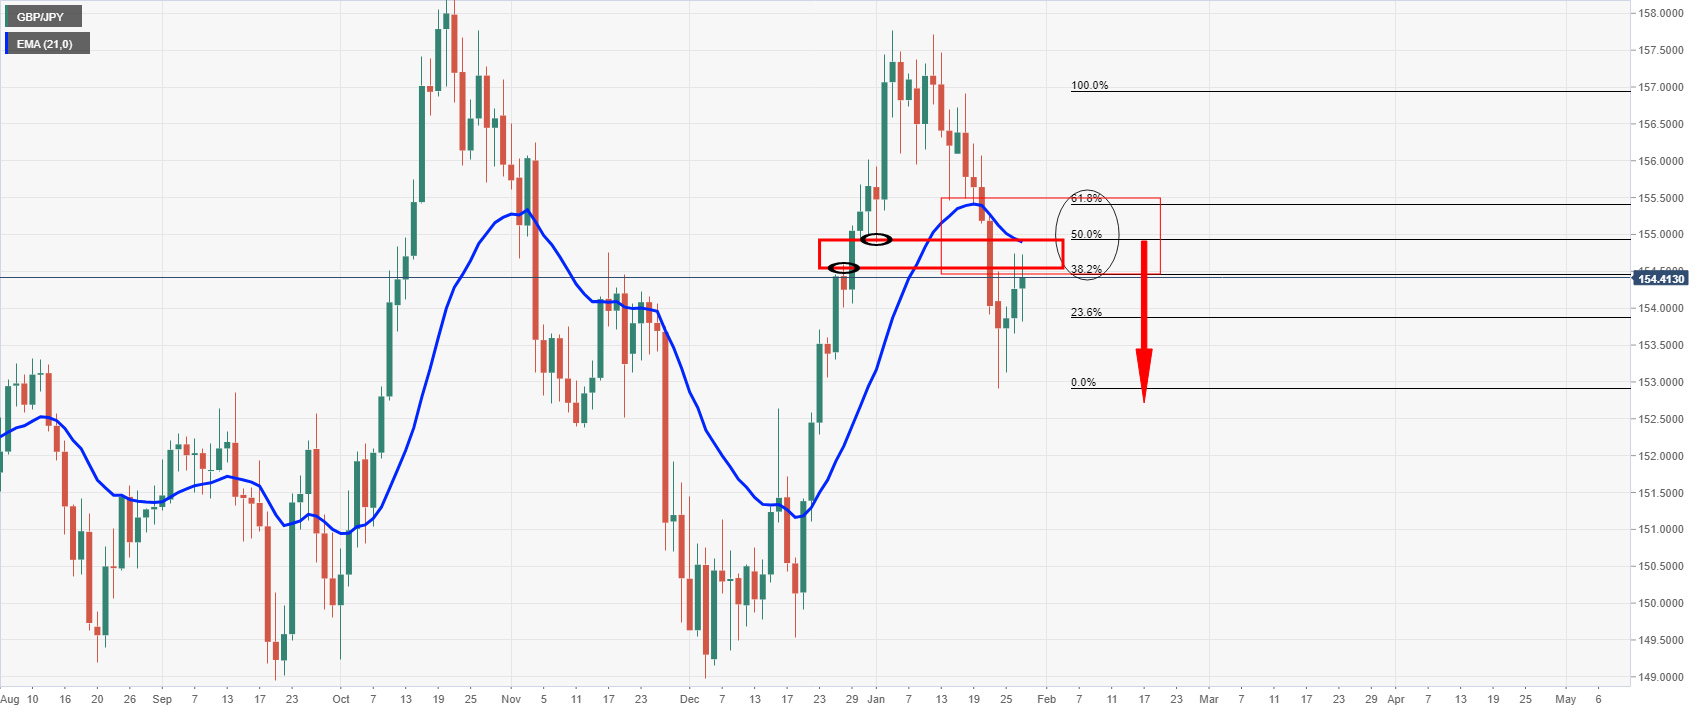
The wicks of the 28 December and 3 January daily candlesticks align and offer values of liquidity below the 21-day EMA, reinforcing the resistance potential.
GBP/JPY H4 chart
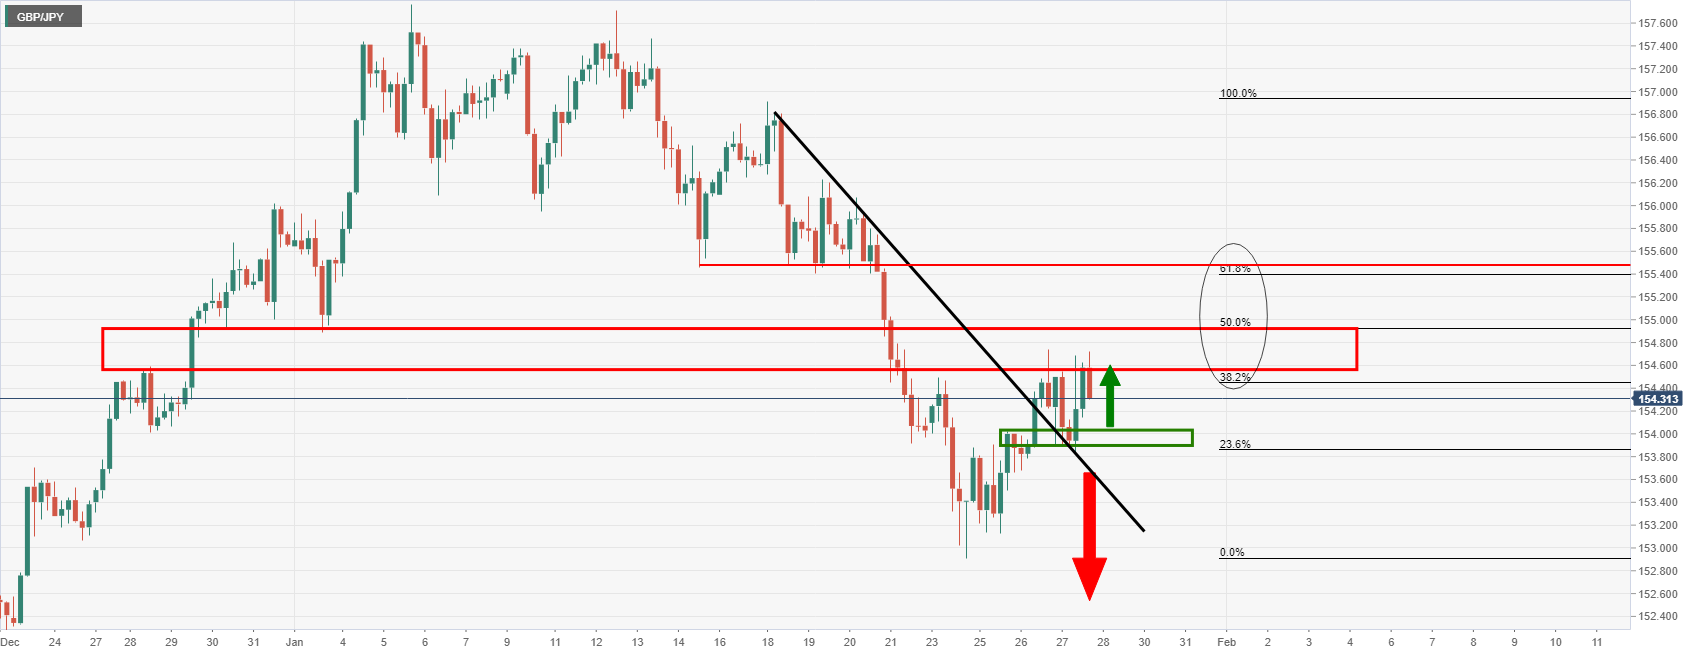
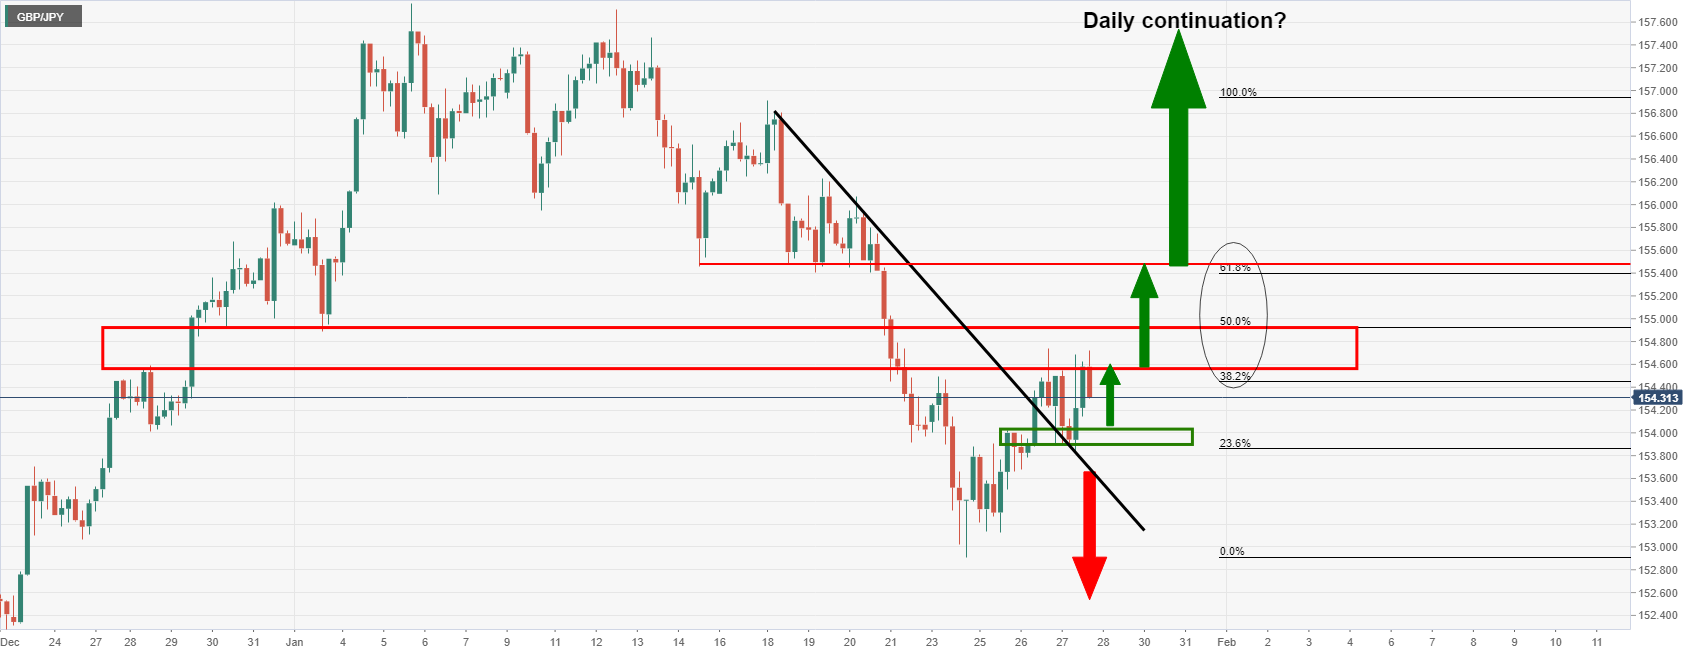
The 4-hour chart shows that the price needs to get below 153.83 where the dynamic support of the counter-trendline and horizontal support meet. On the flip side, if the bulls commit and should the 50% mean reversion give way, then the 61.8% will be the last defence to a potential bullish daily and weekly continuaiton:
GBP/JPY weekly chart
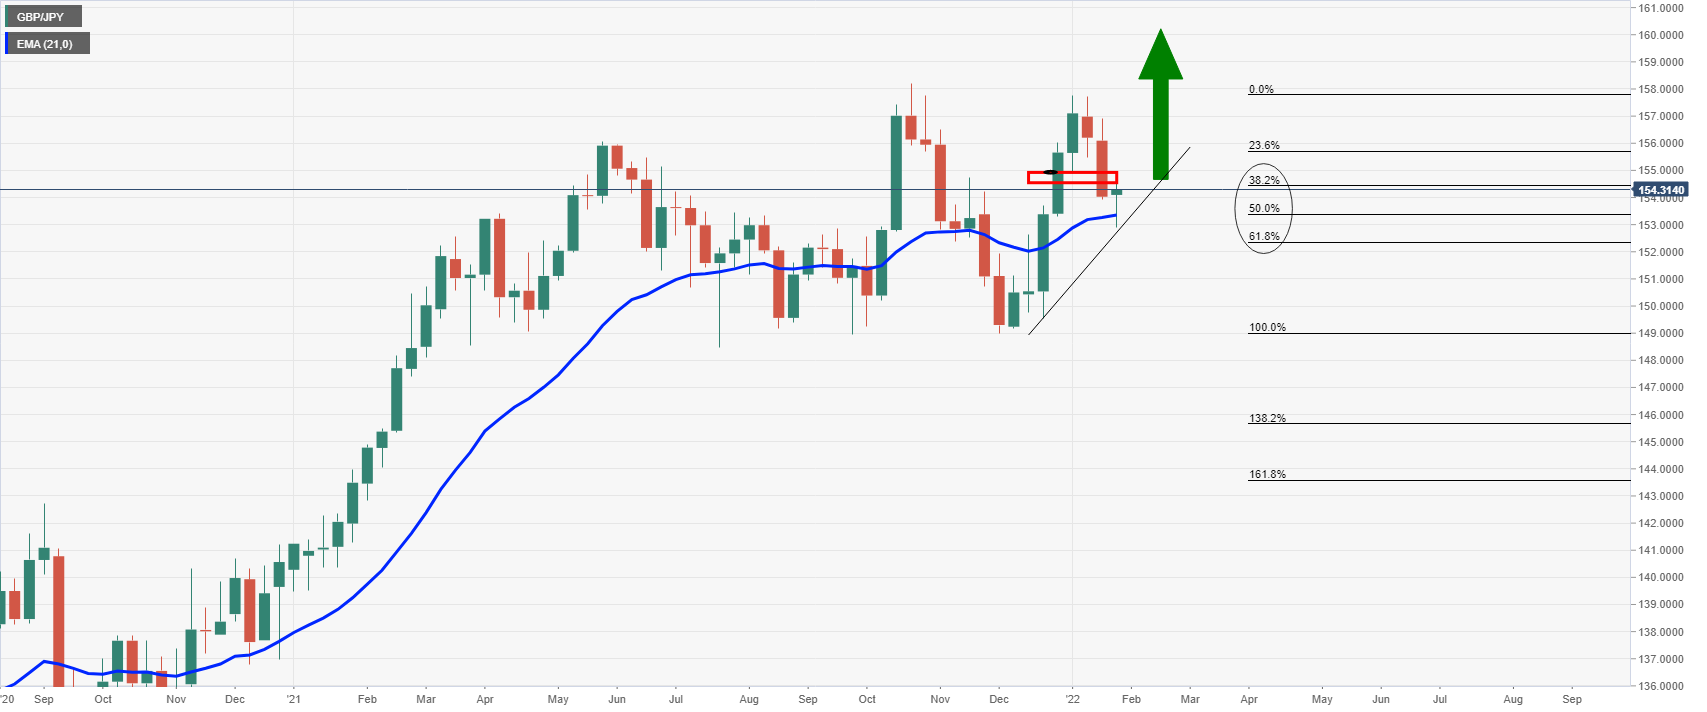
The weekly chart is bullish and the price s testing the critical Fibonaccis. If the price holds the 21-week EMA, and the 4-hour chart's 61.8% gives, then this will be bullish for the outlook in weeks ahead.
 Material posted here is solely for information purposes and reliance on this may lead to losses. Past performances are not a reliable indicator of future results. Please read our full disclaimer