- USD/TRY Price Analysis: 50-DMA pushes bulls to aim for six-week-old resistance line
Market news
USD/TRY Price Analysis: 50-DMA pushes bulls to aim for six-week-old resistance line
- USD/TRY keeps early-week rebound from 50-DMA towards 21-DMA.
- Descending trend line from late December becomes the key hurdle.
- Steady RSI suggests sideways moves between 50-DMA, stated resistance line.
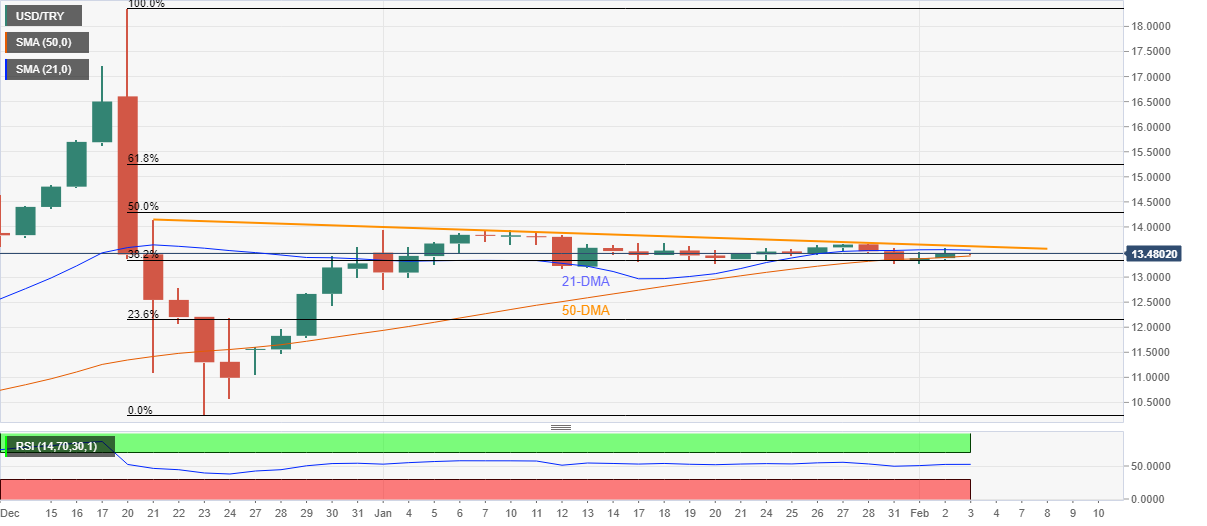
USD/TRY stays firmer around $13.48 during Thursday’s Asian session, holding the latest rebound from the 50-DMA.
The quote’s sustained bounce off the 50-DMA gains support from the steady RSI line to battle the 21-DMA, around $13.53 at the latest.
However, a downward sloping trend line from December 21, near $13.61, becomes the key challenge for the USD/TRY buyers, a break of which will not hesitate to propel the quote towards January’s top surrounding $13.95.
It’s worth mentioning that the USD/TRY bulls need validation from 50% Fibonacci retracement (Fibo.) of December 20-23 downturn, around $14.30, for further upside.
Meanwhile, pullback moves remain elusive until staying beyond the 50-DMA level of $13.42. Also challenging USD/TRY sellers are the lows marked in early January around $13.15 and $12.75.
Should the prices drop below $12.75, USD/TRY bears may not hesitate to challenge the late 2021 bottom close to $10.25.
USD/TRY: Daily chart
Trend: Sideways