- AUD/USD Price Analysis: Bears lining up for a move to 0.7180's and 0.7150's
Market news
21 tháng 2 2022
AUD/USD Price Analysis: Bears lining up for a move to 0.7180's and 0.7150's
- AUD/USD resistance is identified near 0.72 the figure.
- A Fibo extension to the downside in measuring for the 50% mean revision leaves 0.7181 as a key target.
The price is attempting to break lower but there is some meanwhile support coming in at the lows. A correction to prior lows could be on the cards in a 50% mean reversion.
AUD/USD H1 chart

This could be expected to act as resistance and result in further selling for fresh hourly lows into the 0.7180's.
AUD/USD M15 chart
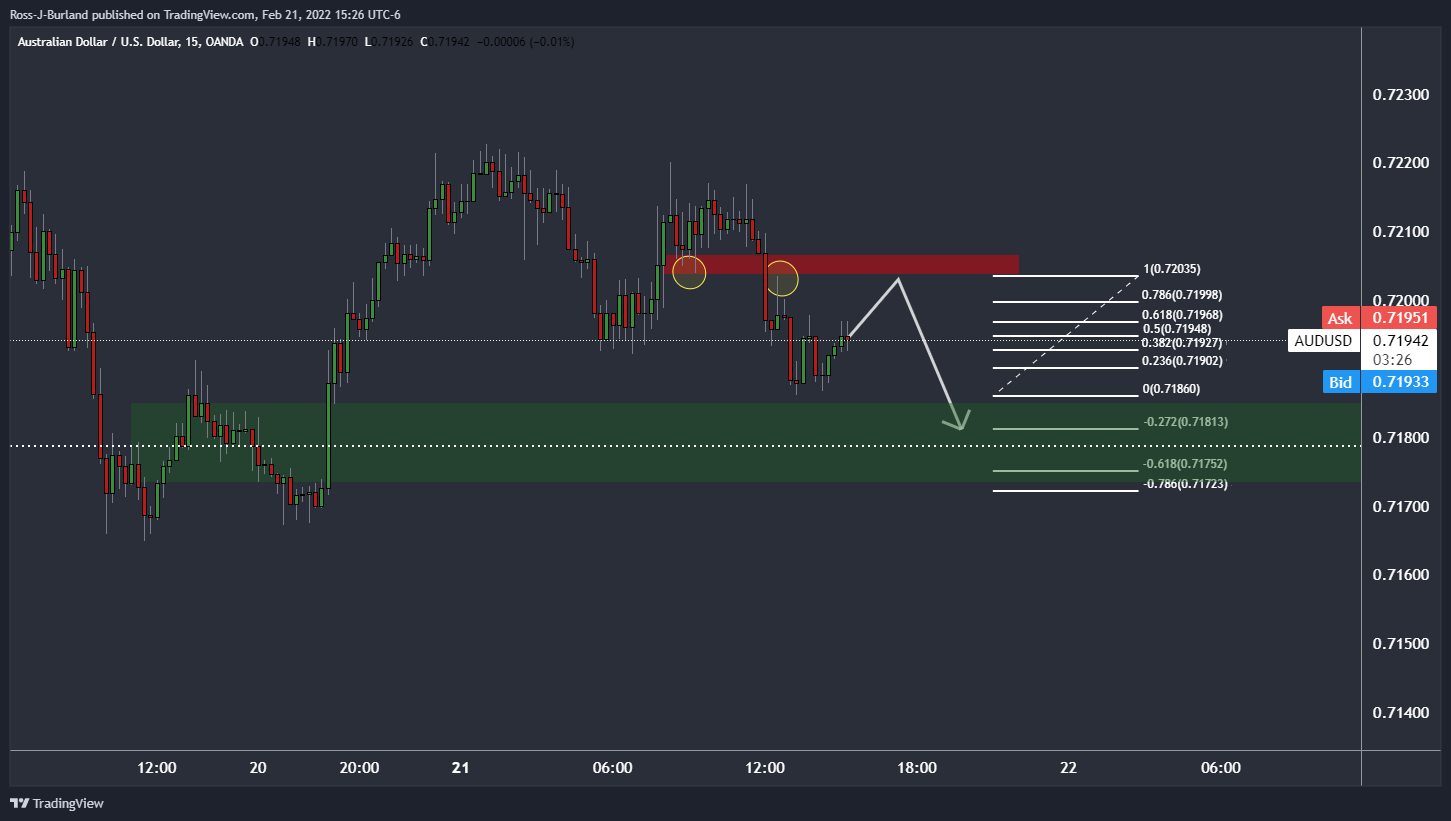
From a 15-min perspective, the resistance structure is made clearer with the above chart identifying the wicks of prior lows and highs near 0.72 the figure.
This would be expected to act as resistance on a retest as the price corrects from the hourly lows. A Fibo extension to the downside in measuring for the 50% mean revision leaves 0.7181 as a key target to the downside for a continuation.
Market Focus
Open Demo Account & Personal Page