- EUR/JPY Price Analysis: A double-top near the 137.00 area looms as bears eye 131.40
Market news
EUR/JPY Price Analysis: A double-top near the 137.00 area looms as bears eye 131.40
- The EUR/JPY failure to reclaim 137.00 exposed the pair to selling pressure.
- EUR/JPY Price Forecast: A double top in the daily chart looms and targets 131.40.
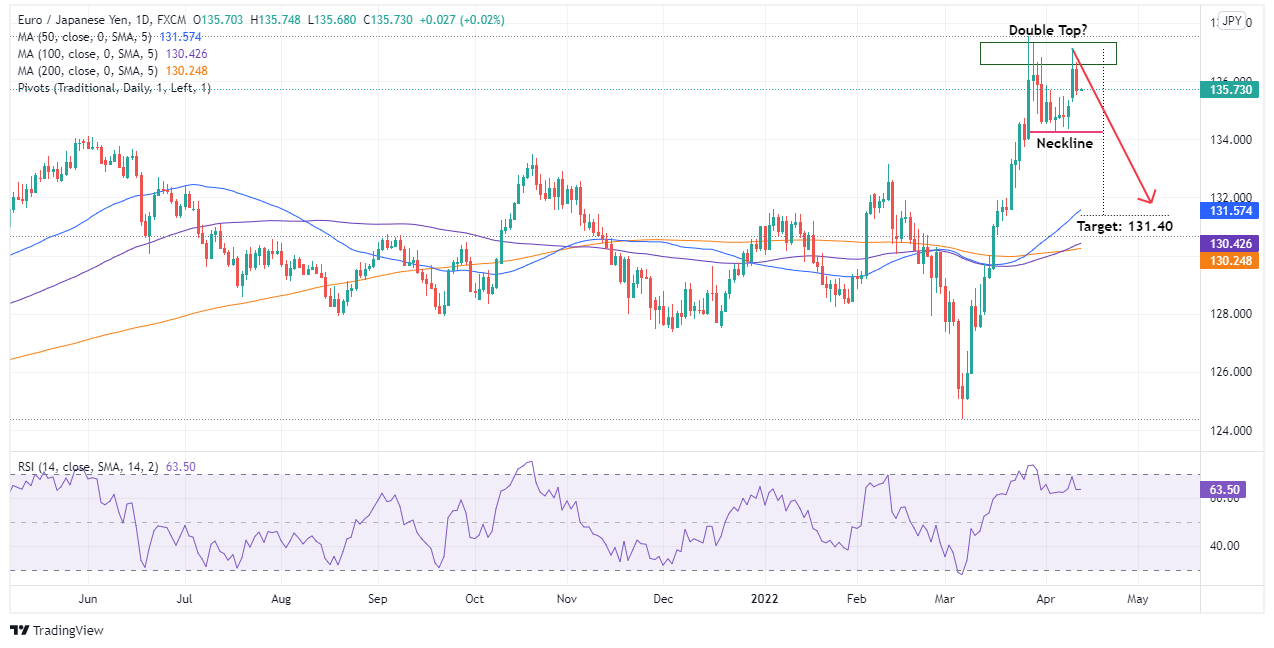
After Monday’s price actions witnessed the EUR/JPY lifting to the 137.10s region and then dropping towards the 136.60s area, the EUR/JPY continues falling as a double-top chart pattern forms in the daily chart. At the time of writing, the EUR/JPY is trading at 135.73.
EUR/JPY Price Forecast: Technical outlook
The EUR/JPY daily chart depicts an upward bias in the cross-currency pair. However, price action since March 28, when the EUR/JPY printed a YTD high at 137.54, coincides with the Relative Strength Index (RSI) highest level reached at 73.27, within overbought conditions, the first signal that the pair might consolidate.
Then, on April 4, the EUR/JPY fell towards the 134.20s area and was range-bound in the 134.20-135.40 range before April 11, when the EUR/JPY exploded upwards, close to 190-pips, failing to reclaim 137.00, retreating afterward towards 136.65.
That said, the cross-currency pair formed a double top, and as it is headed south, it would find some hurdles on its way down. The EUR/JPY first support would be April 7 at 135.50. A breach of the latter would expose 135.00. Once cleared, the EUR/JPY bull’s following line of defense would be the neckline at 134.29, followed by the double-top target at 131.40.
Technical levels to watch