- GBP/USD Price Analysis: Bulls step in and eye 38.2% Fibo
Market news
25 tháng 4 2022
GBP/USD Price Analysis: Bulls step in and eye 38.2% Fibo
- GBP/USD bears moved in with force and the price is potentially moving into bullish accumulation.
- The Fibonaccis are drawn and the 38.2% ratio is eyed ahead of the 61.8%.
GBP/USD's parabolic move on Friday may have run out of gas and there are eyes on the 61.8% ratio for the days ahead. The following illustrates the potential for a significant correction across the daily and hourly charts.
GBP/USD daily chart
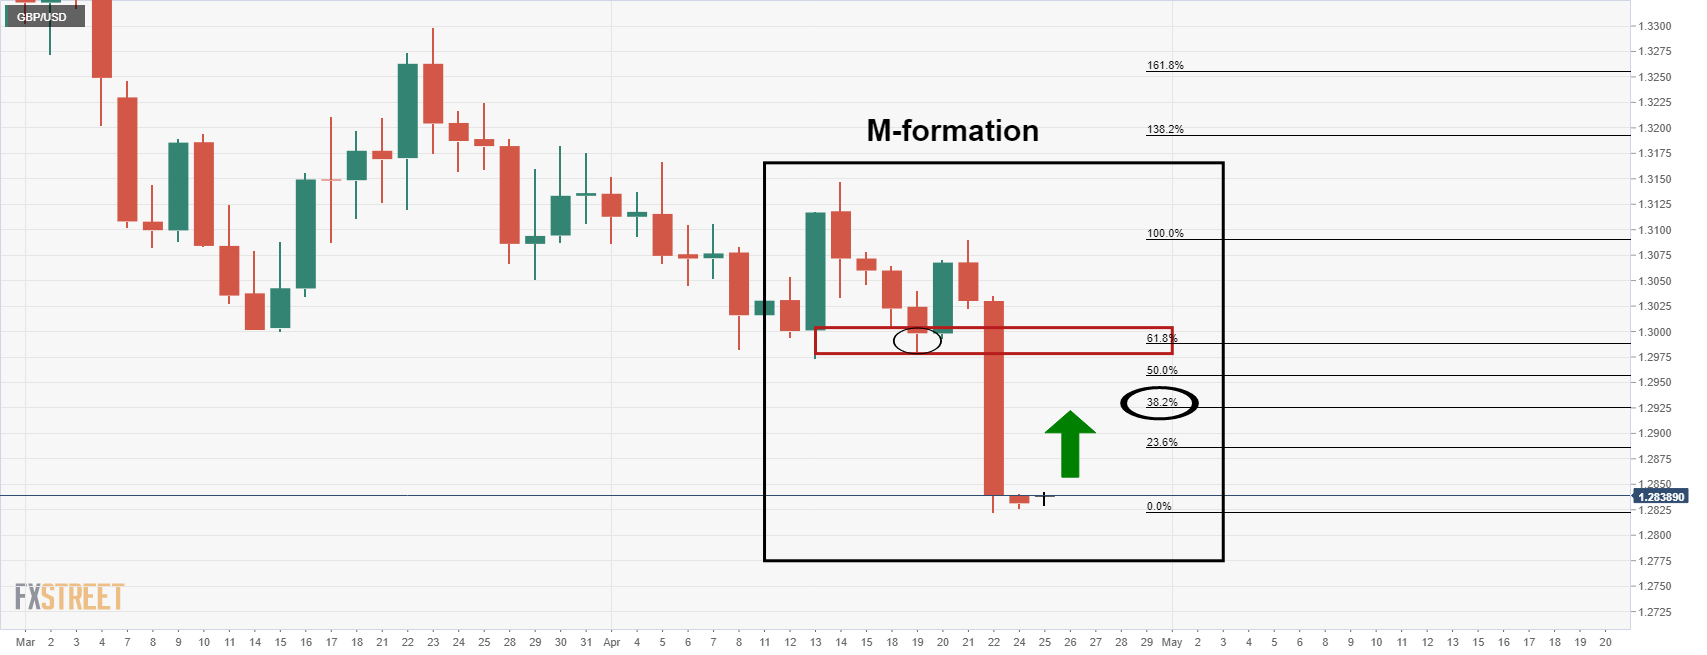
The daily chart has left an M-formation behind which is a reversion pattern. However, considering how heavy the drop has been, the formation is overextended, therefore the 38.2% Fibonacci has a higher probability of being reached.
GBP/USD H1 chart
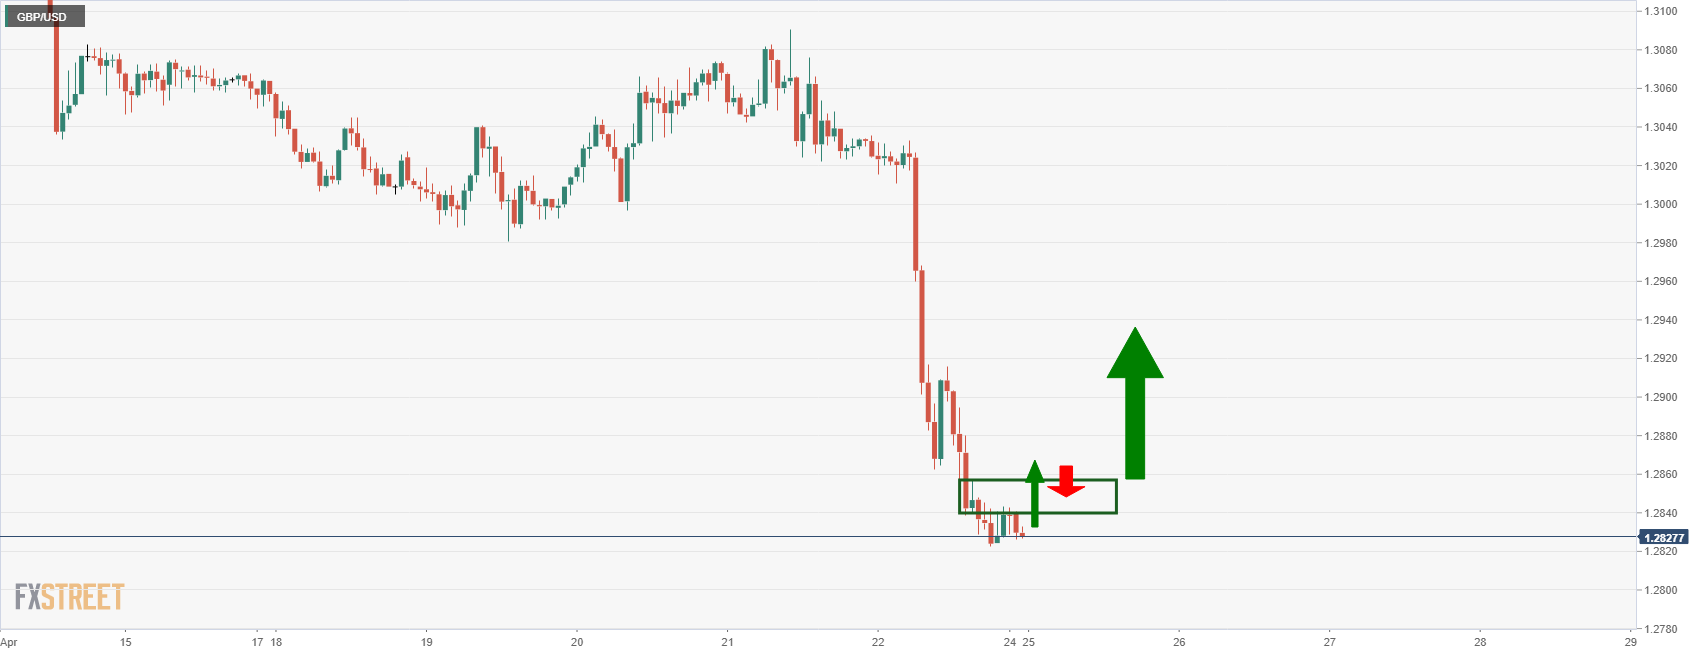
From an hourly perspective, the price is moving within a phase of accumulation and until the meanwhile resistance is overcome, there are still prospects of a lower low for the sessions ahead.
Market Focus
Open Demo Account & Personal Page