- USD/INR Price Analysis: Holds comfortably above 83.00, eyes all-time high ahead of FOMC
Market news
USD/INR Price Analysis: Holds comfortably above 83.00, eyes all-time high ahead of FOMC
- USD/INR struggles to gain any meaningful traction and oscillates in a range on Tuesday.
- The technical setup favours bulls and supports prospects for a further appreciating move.
- Any meaningful corrective decline is more likely to get bought into and remain limited.
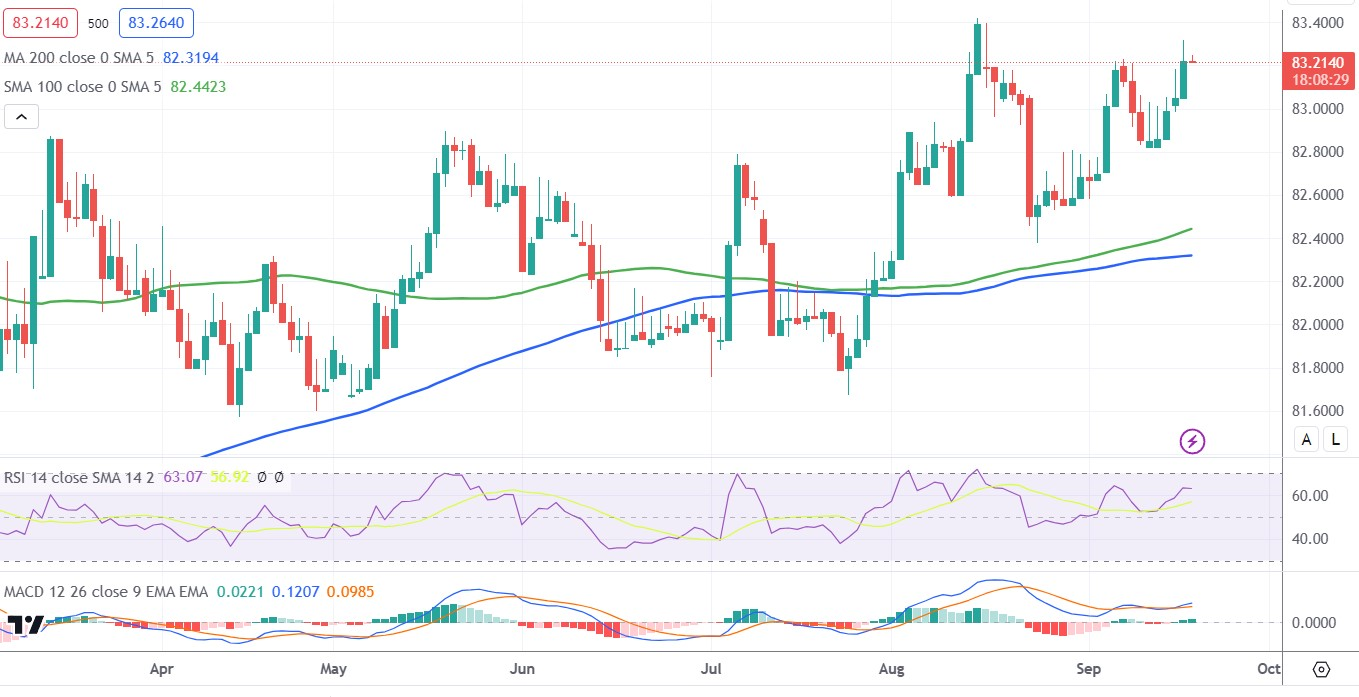
The USD/INR pair oscillates in a range around the 83.20-83.25 area during the Asian session on Tuesday and remains well within the striking distance of over a one-month high touched the previous day. The technical setup, meanwhile, still seems tilted in favour of bullish traders and suggests that the path of least resistance for spot prices is to the upside.
The positive bias is reinforced by the fact that the USD/INR pair is holding comfortably above technically significant 100-day and 200-day Simple Moving Averages (SMAs). Moreover, technical indicators on the daily chart have been gaining some positive traction and are still far from being in the overbought territory. This, in turn, validates the constructive outlook and supports prospects for an extension of the recent upward trajectory witnessed over the past week or so.
Hence, a subsequent strength back towards challenging the all-time high, around the 83.45 region touched in August, looks like a distinct possibility. Some follow-through buying will be seen as a fresh trigger for bulls and allow the USD/INR pair to conquer the 84.00 round-figure mark. Bulls, however, might refrain from placing aggressive bets and prefer to wait on the sidelines ahead of the crucial FOMC monetary policy decision, scheduled to be announced on Wednesday.
On the flip side, any meaningful corrective slide might now find decent support near the 83.00 level and bought into near last week's swing low, around the 82.80 area. This is followed by the 100-day, currently around the 82.45 region, ahead of the 200-day SMA near the 82.30 zone. A convincing break below the said support levels might prompt some technical selling and make the USD/INR pair vulnerable to accelerate the downward trajectory towards the 82.00 round figure.
The USD/INR pair could slide further towards the July monthly swing low, around the 81.70-81.65 region. Failure to defend the latter will suggest that spot prices have topped out in the near term and pave the way for deeper losses. The pair might then weaken further below the 81.35 intermediate support and eventually drop towards testing sub-81.00 levels.
USD/INR daily chart

Technical levels to watch