- NZD/JPY Price Analysis: Bulls gain some ground, bears are still around the corner
Market news
NZD/JPY Price Analysis: Bulls gain some ground, bears are still around the corner
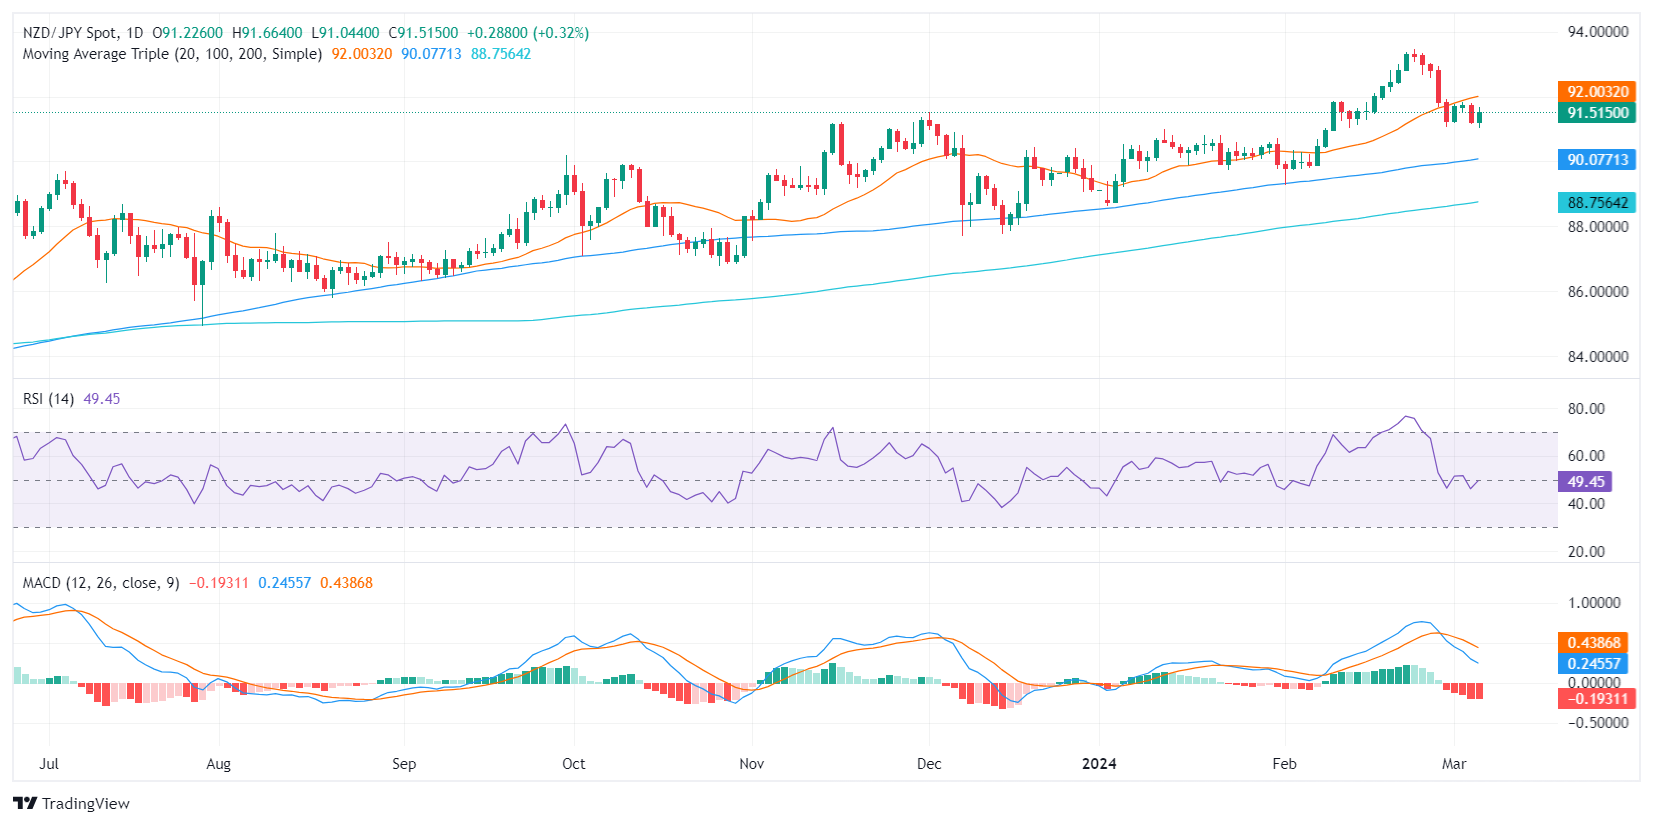
- The daily chart of the NZD/JPY shows a period of consolidation following last week’s sharp losses.
- Red bars seen consistently on the daily MACD further depict a steady selling momentum.
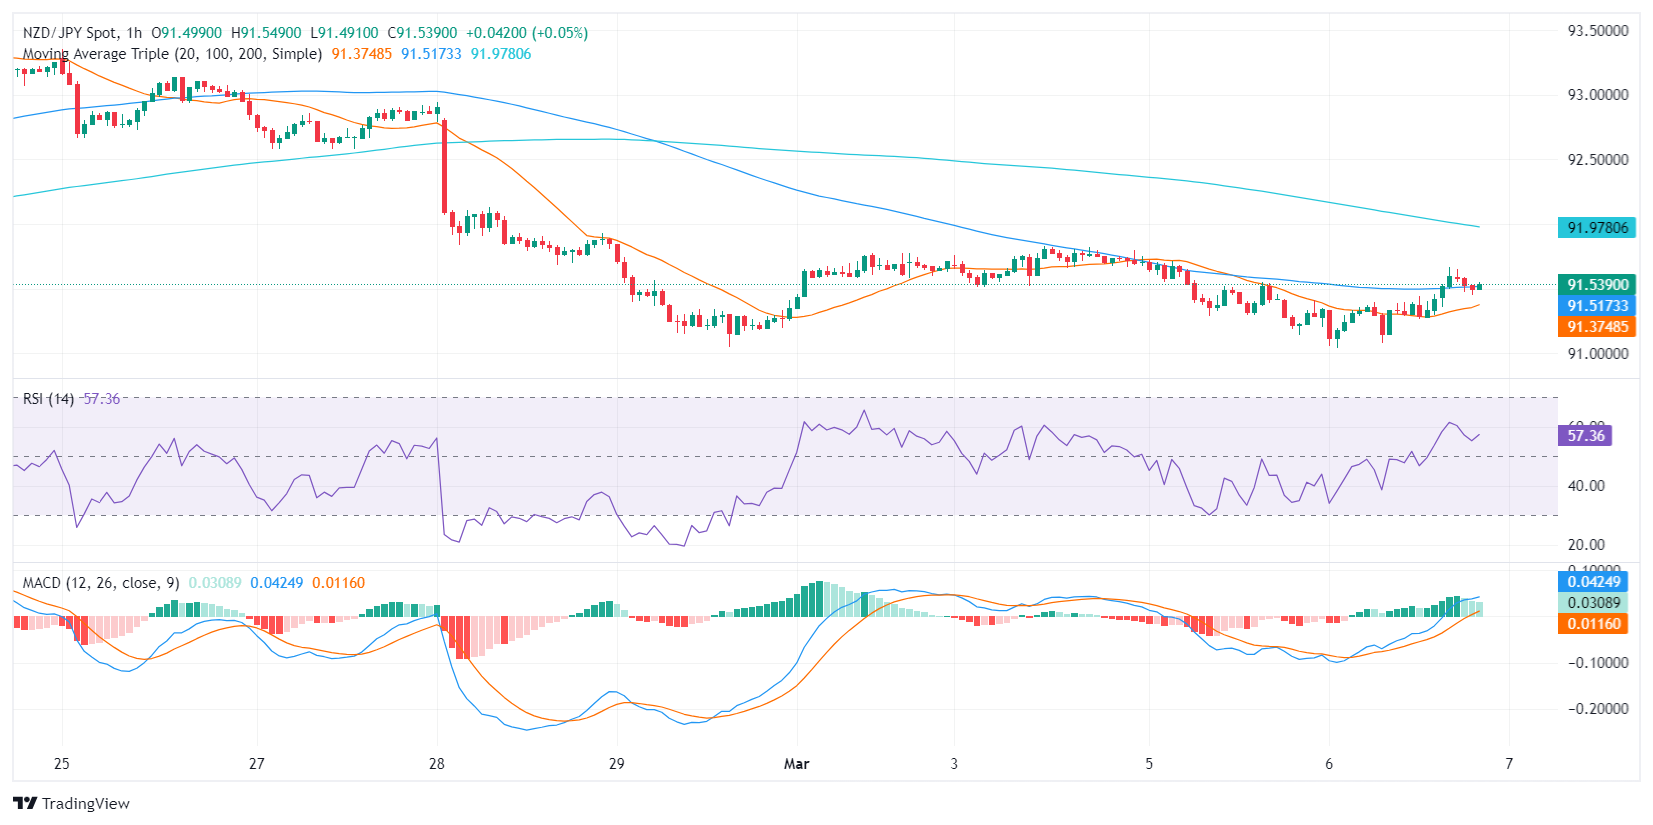
- RSI values on the hourly chart signal short-term buyer domination.
In Wednesday’s session, the NZD/JPY showed some gains. Bears seem to be consolidating last week’s losses but for the short term, the outlook is turning negative. The overall trend, however, remains bullish.
On the daily chart, the Relative Strength Index (RSI) displays a positive slope in negative territory. It quickly corrected overbought conditions reached last week and fell below 50. This indicates a shift in momentum with sellers gaining ground. The consistently flat red bars on the Moving Average Convergence Divergence (MACD) histogram further show a decline in positive momentum, reinforcing the selling pressure taking place.
NZD/JPY daily chart
Examining the hourly chart, RSI values hover within positive territory suggesting buyers dominate shorter-term trades. Simultaneously, the decreasing green bars on the MACD histogram indicate a drop in positive momentum. Despite temporary bearish pressure, the pair displays strength in a broader perspective, given its position above the 100 and 200-day Simple Moving Averages (SMAs).
NZD/JPY hourly chart
In conclusion, while sellers appear to have gained traction intraday according to the daily RSI and MACD, the overarching trend remains bullish. The pair holds resilience above the long-term averages.