- AUD/JPY Price Analysis: Bulls recover traction, recovery may be incoming
Market news
AUD/JPY Price Analysis: Bulls recover traction, recovery may be incoming
- The selling pressure dominates the daily chart, but indicators recovered on Tuesday.
- The hourly chart also depicts an improvement hinting at a potential recovery.
- With the operating above key SMAs, a longer-term bullish sentiment could potentially override recent bearish tendencies.
The AUD/JPY pair is trading at 97.477, showing a gain of 0.31%. Despite the gains, selling pressure seems to dominate in the short term but the overall trend remains bullish. Indicators are improving in the hourly chart.
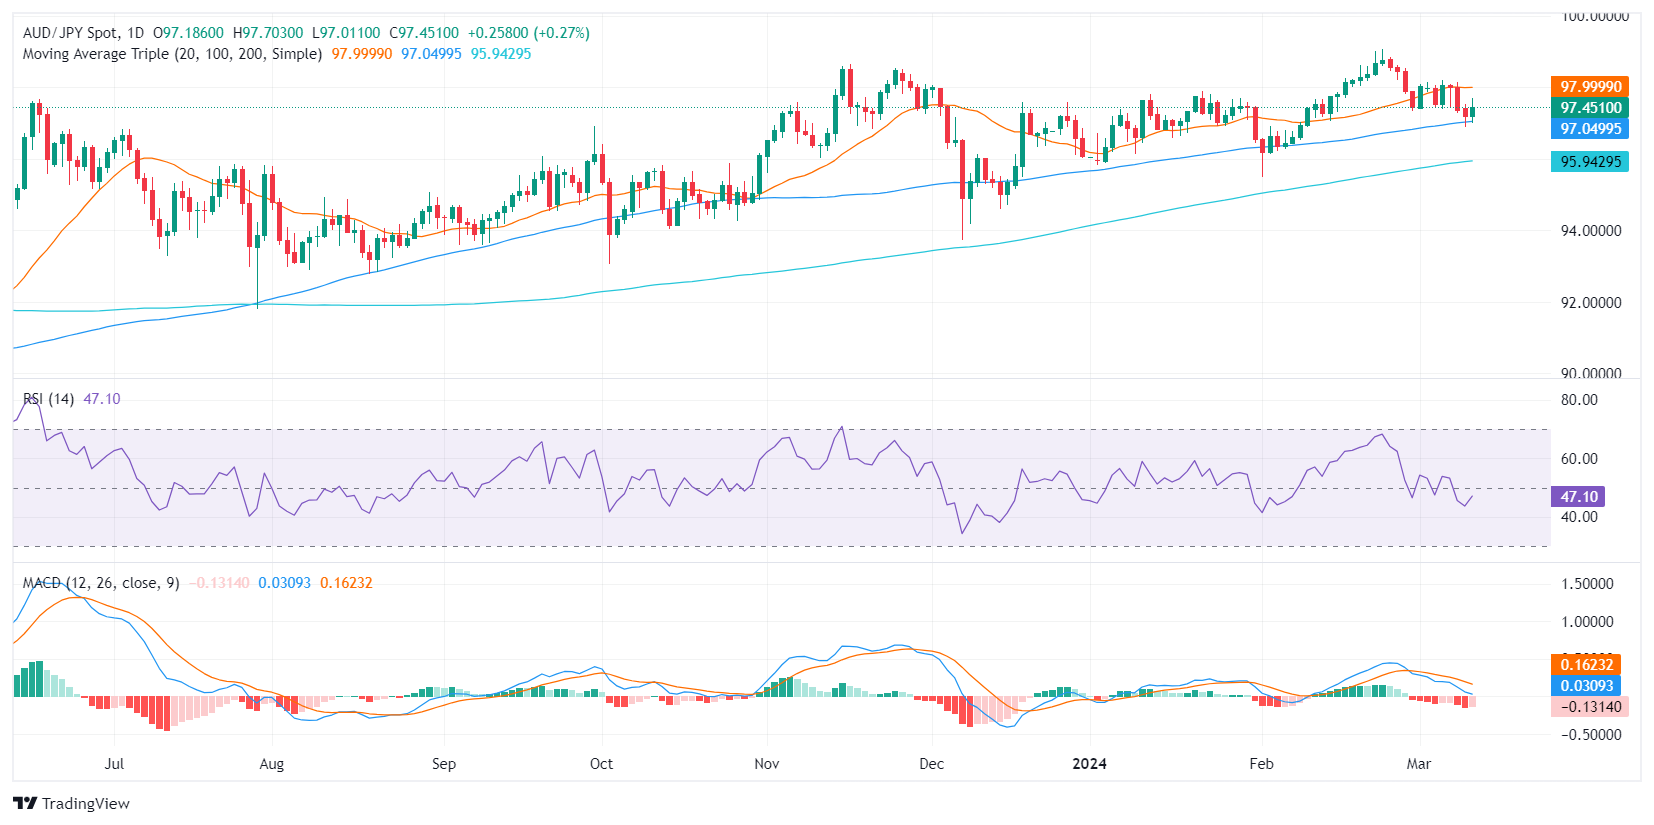
Based on the indicators of the daily chart, the AUD/JPY pair shows a negative momentum as the Relative Strength Index (RSI) is currently in negative territory. Its rising slope however, suggests that the buyers are recovering The declining red bars in the Moving Average Convergence Divergence (MACD) histogram further emphasize this bearish momentum, signaling that sellers currently dominate the market but with a weakened grip.
AUD/JPY daily chart

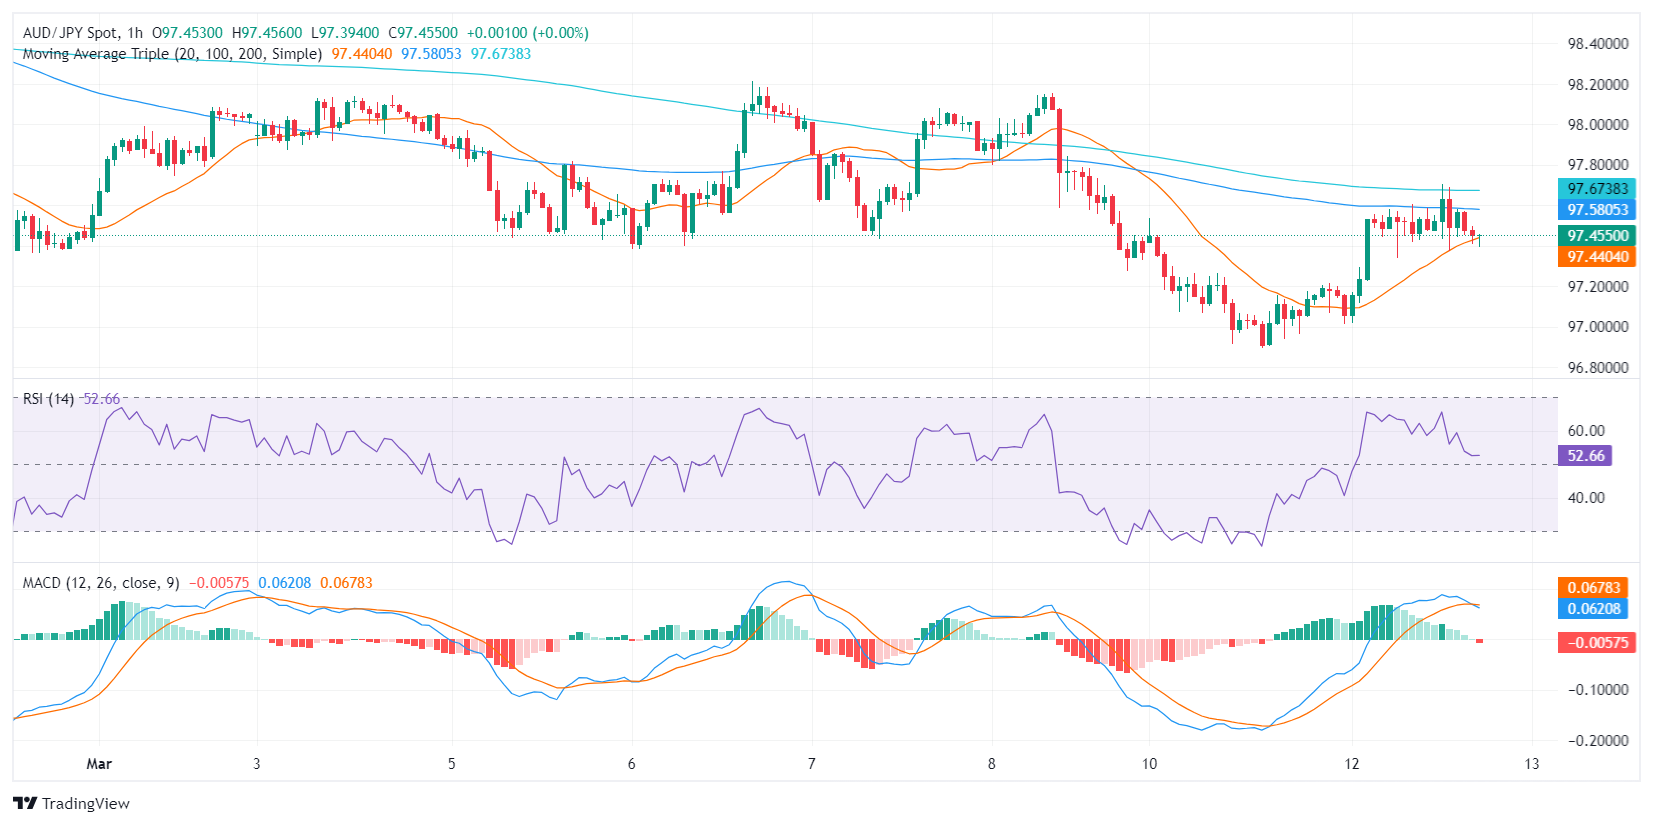
Transitioning to the hourly chart, the RSI stands in positive territory, illustrating a recovery in recent hours. The MACD histogram on the other hand printed a red bar, indicating that the resurge might be short-lived.
AUD/JPY hourly chart

Looking at the broader context, despite the short-term negative outlook, the AUD/JPY remains bullish as it trades above its 100, and 200-day Simple Moving Averages (SMAs). This suggests that the longer-term positive trend could still overshadow recent bearish movements. That being said, the buyers shouldn’t relax and must recover the 20-day average to resume its upward path.