- EUR/JPY Price Analysis: Bearish pressure holds steady, bullish recovery uncertain
Market news
EUR/JPY Price Analysis: Bearish pressure holds steady, bullish recovery uncertain
- The daily chart indicators suggest that overall selling pressure remains steady despite daily gains.
- On the hourly chart, indicators send mixed signals.
- The pair defending the 100-day SMA contributes to the overall outlook remaining bullish.
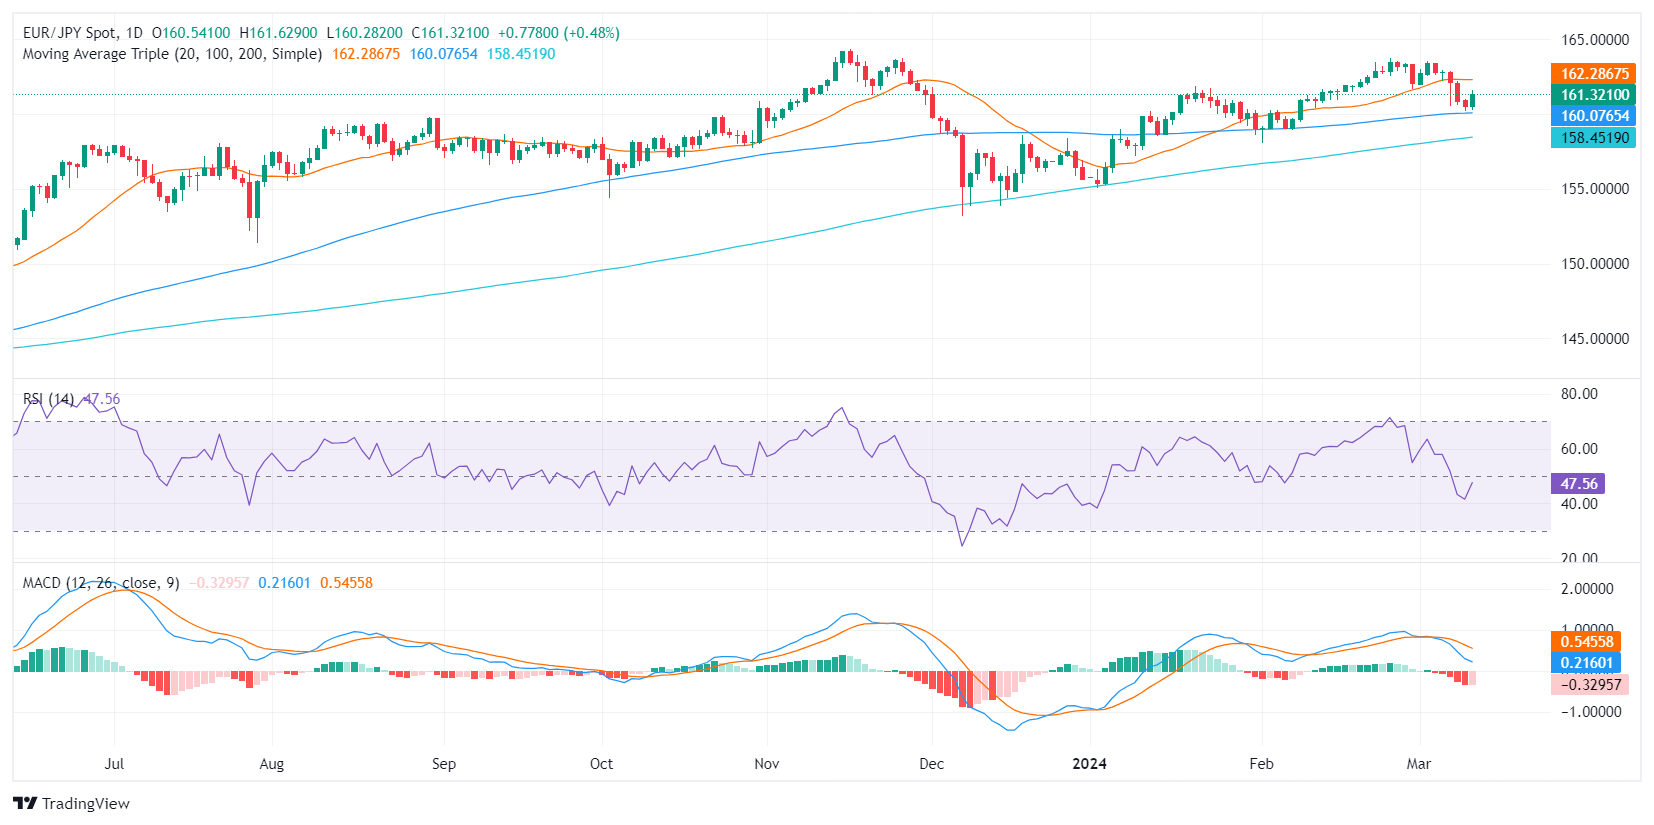
In Tuesday's trading session, EUR/JPY is trading roughly around 161.27, with a daily gain of 0.44%. Despite recent selling pressures, the pair maintains a position above critical support levels, hinting at an overall bullish power. In the short term, the sellers seem to have a stronger grip, as the pair struggles below the 20-day Simple Moving Average (SMA).
On the daily chart, the EUR/JPY's Relative Strength Index (RSI) is currently in negative territory. This implies that the selling pressure has been dominating the market in recent sessions. This trend is underscored by the red bars observed in the Moving Average Convergence Divergence (MACD), indicating negative but weakening momentum. Despite this, the pair is still above its key 100 and 200-day SMAs, pointing to broader bullish control.
EUR/JPY Daily Chart

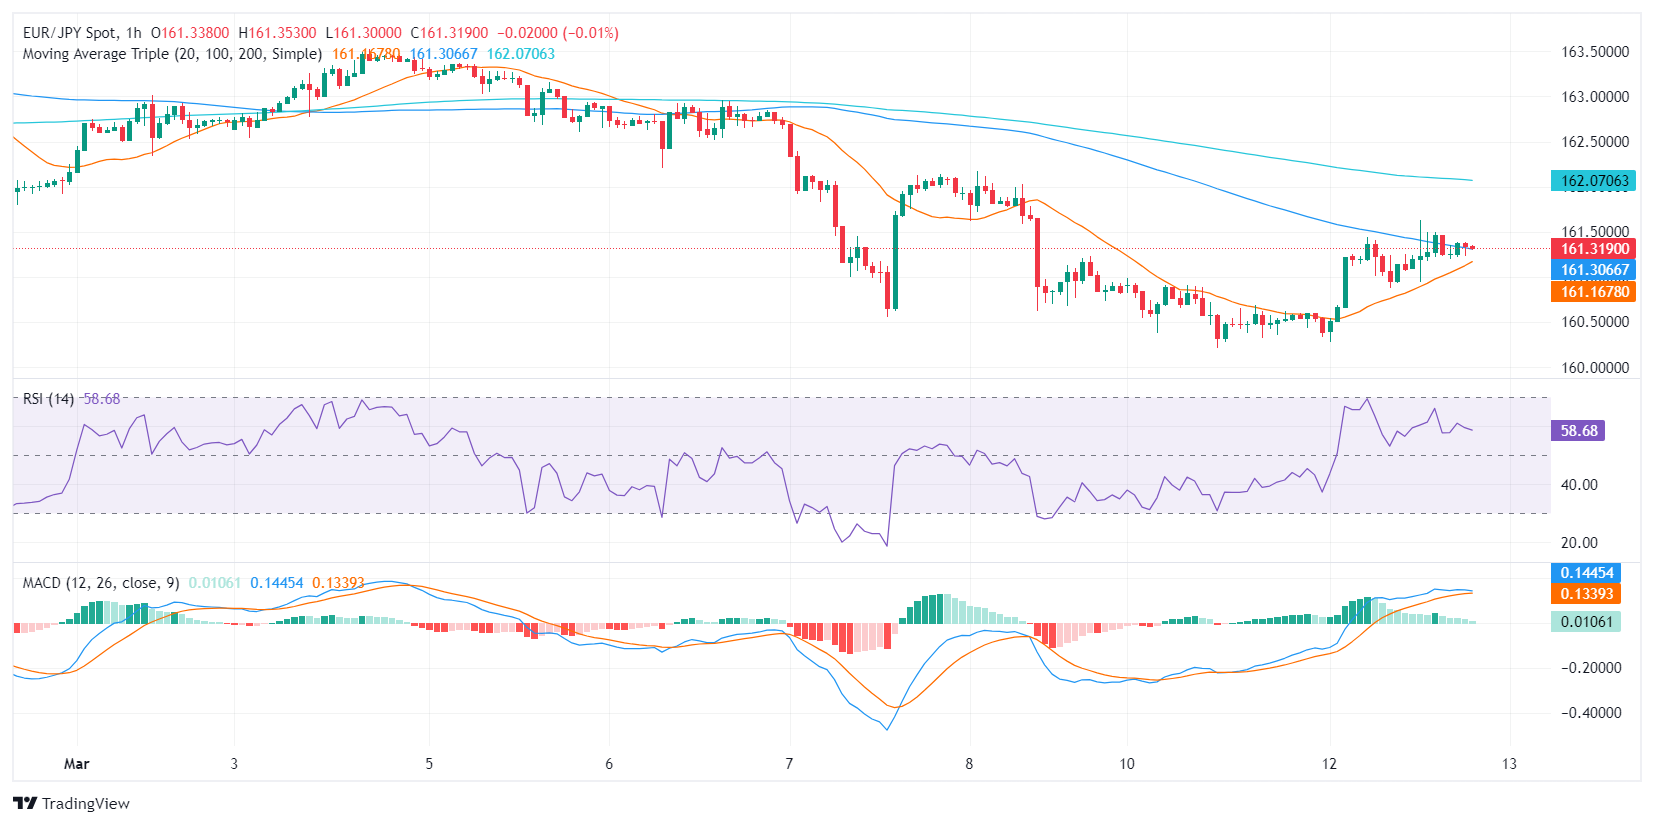
Switching focus to the hourly chart, the RSI has been moving within positive territory. On the other hand, the MACD is printing decreasing green bars, which suggests a slightly tapering bullish momentum. This aligns with the slope of the RSI which seems to have flattened during the American session.
EUR/JPY Hourly Chart