- USD/CAD Price Analysis: Reaches higher to near 1.3480 ahead of nine-day EMA
Market news
USD/CAD Price Analysis: Reaches higher to near 1.3480 ahead of nine-day EMA
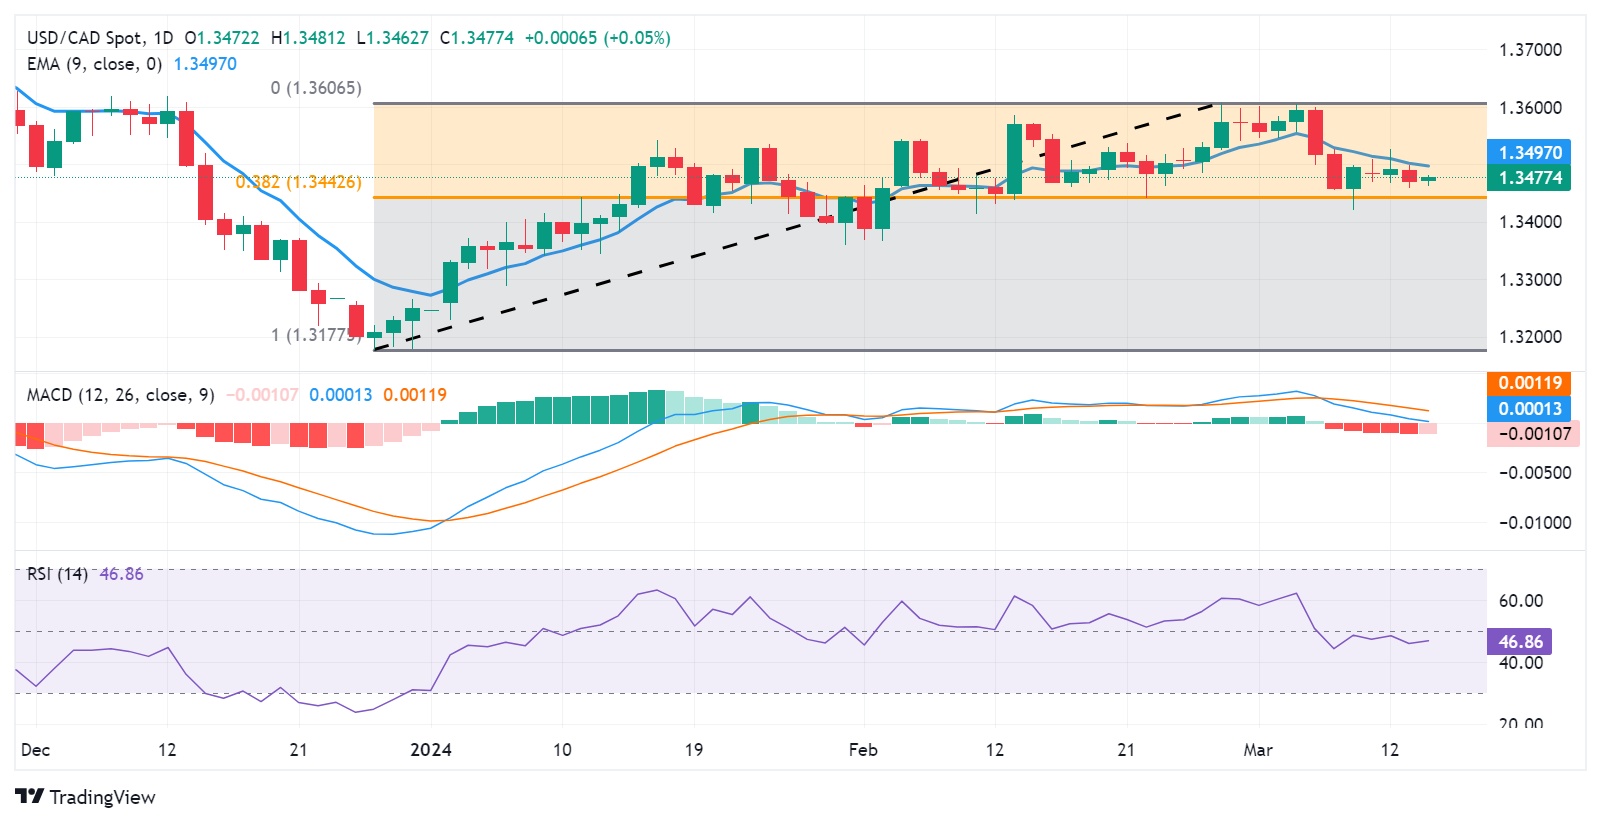
- USD/CAD could test a nine-day EMA of 1.3497 and a psychological level of 1.3500.
- The major level of 1.3450 and the 38.2% Fibonacci retracement level of 1.3442 could act as key support levels.
- A break above the 1.3600 level could lead the pair to test March’s high of 1.3605.
USD/CAD retraces its recent losses from the previous session, edging upwards to near 1.3480 during Thursday's European session. The US Dollar (USD) receives support from higher US Treasury yields, likely influenced by recent data indicating sticky inflation in the United States (US).
The immediate resistance is at the nine-day Exponential Moving Average (EMA) at 1.3497, coinciding with the psychological level of 1.3500.
A breakout above the psychological level could provide upward support for the USD/CAD pair, with the next resistance at the major level of 1.3550. Further upside momentum may target the region around the psychological level of 1.3600, aligned with March’s high of 1.3605.
On the downside, the USD/CAD pair may encounter significant support around the major level of 1.3450, followed by the 38.2% Fibonacci retracement level at 1.3442. A breach below this level could exert downward pressure on the pair, potentially leading it toward the support zone near the previous week’s low of 1.3419 and the psychological level of 1.3400.
The technical analysis indicates mixed signals for the USD/CAD pair. The 14-day Relative Strength Index (RSI) is positioned below 50, suggesting bearish momentum. However, the Moving Average Convergence Divergence (MACD) suggests a potential momentum shift.
The MACD line is above the centerline, indicating bullish momentum, but there is divergence below the signal line. Traders may await confirmation from the MACD, a lagging indicator, to determine the direction of the trend.
USD/CAD: Daily Chart
