Market news
-
23:17
Japan’s Top FX Diplomat Kanda: Concerned about one-sided sharp FX moves
Japan's top currency diplomat Masato Kanda, who will instruct the BOJ to intervene, when he judges it necessary, commented on the weaker Japanese Yen (JPY) following the Bank of Japan (BoJ) policy decision on Tuesday.
Key quotes
“Concerned about one-sided, sharp FX moves.”
“Speculative moves seem to play the biggest factor.”
“Won't rule out any steps to respond to disorderly FX moves.”
“Did not intervene in FX market last month.”
“In close contact with authorities internationally on FX.”
“FX moves affect price stability target.”
Market reaction
At the time of writing, USD/JPY is trading at 151.28, losing 0.24% on the day.
-
23:15
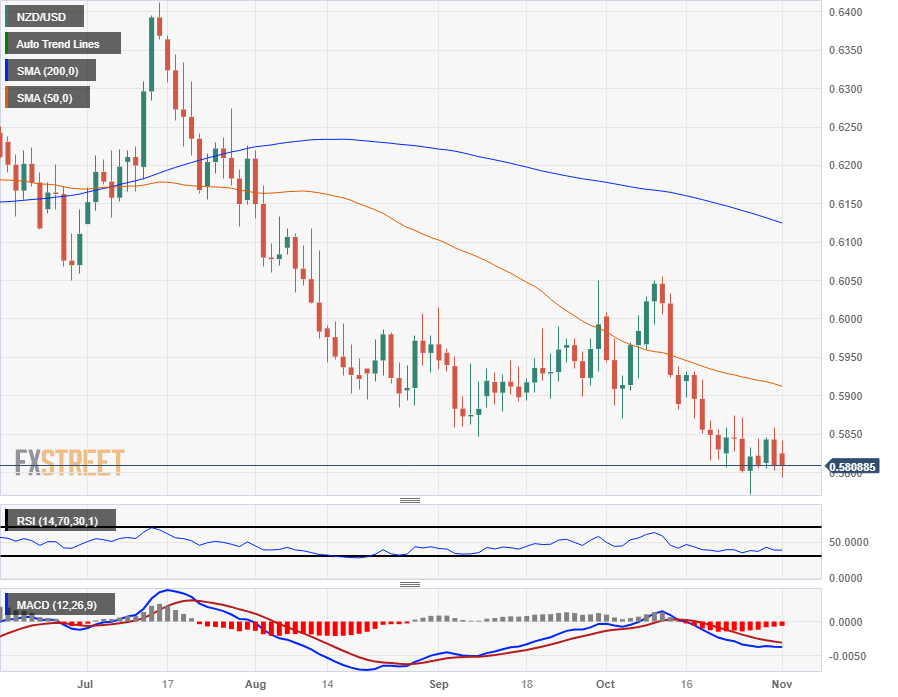
NZD/USD wobbles on employment change miss, testing 0.5800
- New Zealand Employment Change misses expectations, looses jobs instead of meager gain.
- RBNZ Financial Stability Report reveals little new for investors to chew on.
- Broader market will shift attention to Wednesday's upcoming Fed rate call.
The NZD/USD saw mild declines on Tuesday as broad-market sentiment tips in favor of the US Dollar (USD), taking the Kiwi (NZD) down from opening bids near 0.5840 after hitting a new, albeit minor high for the week near 0.5860.
The Kiwi's downside pressure is set to continue through Wednesday as New Zealand saw an unexpected contraction in employment figures and the Reserve Bank of New Zealand's (RBNZ) Financial Stability Report (FSR) revealed little of note for investors to be concerned about.
New Zealand's Employment Change for the 3rd quarter unexpectedly contracted, printing at -0.2% against the previous quarter's 1% gain, missing the forecast 0.4% that NZD traders expected. Despite the miss, NZ's overall Employment Rate printed at expectations, coming in at the forecast 3.9% against the 2nd quarter's 3.6%, so overall market effect was restrained.
RBNZ Governor Adrian Orr delivered the NZ central bank's latest FSR, with the RBNZ head noting that significant risks remain on the horizon as New Zealand households and businesses continue to grapple with higher debt servicing costs. The NZ financial system is still adjusting to a higher-rate environment, and the RBNZ looks unlikely to raise rates any time soon as the central bank remains leery of potential declines or deterioration in asset quality.
Markets will now turn their eyes to Wednesday's Federal Reserve (Fed) rate call, where markets are expecting the US central bank to keep rates where they are, but investor bets of one last 25-basis-point rate hike to close out the year are on the rise in the face of firm US economic data and sticky inflation metrics that refuse to decline on-pace with market expectations.
NZD/USD Technical Outlook
The Kiwi continues to waffle into the low end of the charts, but there's only so far the NZD can fall, and the pair is struggling to extend further declines below 0.5800 despite broad-market US Dollar strength.
Bullish recovery still sees significant technical resistance, with the 50-day Simple Moving Average (SMA) descending into the 0.5900 handle region, and the NZD/USD continues to test the waters on the low end of 2023's prices.
NZD/USD Daily Chart
NZD/USD Technical Levels
-
23:03
WTI Crude Oil drops amidst Greenback’s recovery, reduced supply concerns
- WTI dropped more than 1.40%, trading at $81.43 per barrel.
- A Reuters survey revealed that OPEC's crude output rose by 180K barrels per day in October.
- The US Energy Information Administration (EIA) reported a rise in US crude production to 13.05 million barrels daily.
West Texas Intermediate (WTI), the US crude oil benchmark, dropped more than 1.40% on Tuesday as the Greenback recovered while market players remain less worried about supply disruptions amid the Middle East conflict. At the time of writing, WTI is trading at $81.43 per barrel.
US Crude Oil benchmark faces a decline as the US Dollar rose, worries about supply disruptions in the Middle East
According to a Reuters survey sponsored by Nigeria and Angola, the Organization of Petroleum Exporting Countries (OPEC) revealed that crude output rose by 180K per day in October. Alongside that, the US revealed that is crude production rose at a 13.05 million barrel per day, revealed the US Energy Information Administration (EIA).
Crude Oil extended its losses as China revealed that manufacturing activity contracted, weighing on demand prospects in one of the largest oil importers.
Fears of global economic slowdown reignited as the Eurozone (EU) revealed its Gross Domestic Product (GDP) for the third quarter slipped to contractionary territory. Aside from this, woes of a possible escalation of the Israel-Hamas conflict loom, as Israel’s Prime Minister Benjamin Netanyahu disregarded the cease-fire in exchange for hostages.
WTI Technical Level
-
23:01
New Zealand Unemployment Rate comes in at 3.9% in Q3 versus 3.6% prior
The New Zealand Unemployment Rate in the third quarter (Q3) climbed to 3.9% from 3.6% in the second quarter, according to data published by Statistics New Zealand on Wednesday. The market consensus was a 3.9% print in the reported period.
Additionally, the Employment Change dropped to 0.2% in the third quarter from a 1% rise in the previous reading. This figure came in worse than the expectation of a 0.4% rise.Market reaction
Following the key New Zealand (NZ) Q3 employment report, the NZD/USD pair is trading lower on the day at 0.5809, as of writing.
-
22:49
AUD/USD sticks to the range-bound trade below the mid-0.6300s ahead of Fed rate decision
- AUD/USD faces some range-bound trade below the mid-0.6300s on Wednesday.
- The markets anticipate that the FOMC will leave interest rates unchanged at its November meeting.
- The Middle East geopolitical tensions and the downbeat Chinese data weighed on the Aussie.
- The FOMC interest rate decision and FOMC press conference will be in the spotlight.
The AUD/USD pair sticks to a range-bound trade during the early Asian session on Wednesday. Appetite for risk assets elsewhere was subdued ahead of the Federal Open Market Committee (FOMC) announcement, with no change in rates expected. The pair currently trades around 0.6334, losing 0.04% for the day.
The FOMC meeting on Wednesday will be a closely watched event. The markets anticipate that the central bank will leave interest rates unchanged at its November meeting. The FOMC has made it obvious that it will not raise interest rates at this meeting, thus, investors will keep an eye on the FOMC’s message after the meeting about how high the bar is to convince the FOMC to hike rates again.
The elevated geopolitical risks in the Middle East and the downbeat Chinese data weighed on the risk sentiment and lift the safe-haven US Dollar (USD) higher. The weaker-than-expected Chinese Manufacturing PMI data raised concerns about the economic recovery in the world’s second-largest economy.
Apart from this, the latest data on Wednesday revealed that the Australian AiG Industry Index for September came in at -9.9 versus -3.5 prior, while the AiG Manufacturing PMI arrived at -20.9 from -12.8 in the previous reading.
Looking ahead, market players will monitor the US ADP employment report, JOLTS, and the ISM Manufacturing PMI on Wednesday. The highlight events will be the FOMC decision and Powell's press conference. Traders will take cues from the events and find trading opportunities around the AUD/USD pair. -
22:32
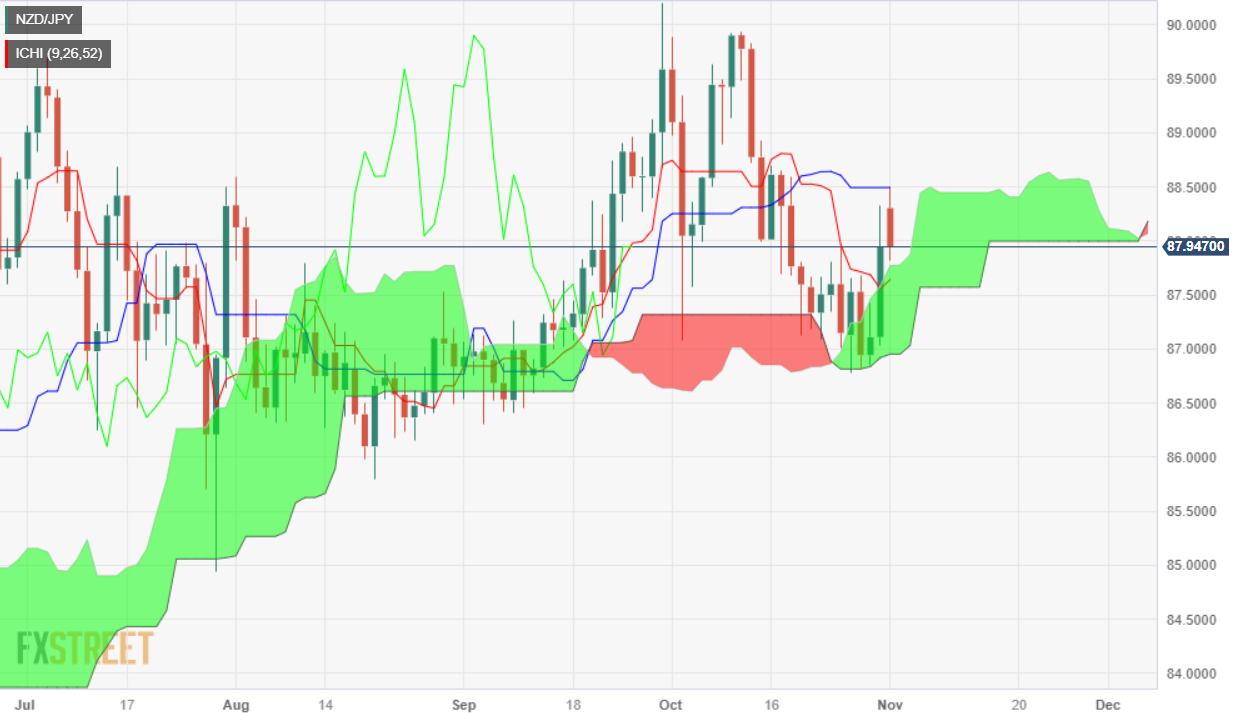
NZD/JPY Price Analysis: Rally capped at Kijun-Sen, at around 88.00
- NZD/JPY rose from daily lows of 87.03 to test 88.00, though the rally was halted by the Kijun-Sen at 88.49.
- On the upside, resistance levels are at 88.00, the Kijun-Sen at 88.49, and the October 11 high at 89.93.
- Key support levels include the top of the Kumo at 87.82, the bottom of the Kumo at 87.00, and the September 5 swing low at 86.30.
The NZD/JPY jumped from daily lows of 87.03, climbing past the 88.00 figure on Tuesday. However, the advancement was capped by the Kijun-Sen at 88.49, and a seven-month-old upslope support trendline turned resistance, which pushed prices toward the top of the Ichimoku Cloud (Kumo). The pair is trading at 87.89, down 0.48%.
The daily chart portrays the pair as neutral to downward biased, about to break inside the Kumo, which could pave the way for further downside. If NZD/JPY falls below the top of the Kumo at 87.82, that would drive the price towards the bottom of the Kumo at 87.00 before challenging the September 5 swing low of 86.30.
On the contrary, NZD/JPY buyers could remain hopeful if the pair climbs back above the 88.00 figure. A breach of the latter would expose the Kijun-Sen at 88.49, followed by 89.00. A decisive break would expose the October 11 high at 89.93.
NZD/JPY Price Action – Daily chart
NZD/JPY Technical Levels
-
22:24
AUD/NZD Price Forecast: Aussie sees early Wednesday break higher against Kiwi
- The AUD/NZD spent most of Tuesday drifting lower before a late-day break buoyed the pair.
- The Aussie is trading into familiar top end against the Kiwi heading into Wednesday's market session.
- The Kiwi stumbled on an employment data miss, hobbling the NZD's chances to turn bullish.
The AUD/NZD has bumped back over 1.0900 after the Kiwi (NZD) tripped and stumbled in early Wednesday market action, trading back down against the Aussie (AUD) and sending the AUD/NZD tipping back into a near-term high around 1.0930.
Aussie intraday declines sent the AUD/NZD back into the 200-hour Simple Moving Average (SMA) before the pair caught a rebound bid from the moving average.
The pair is trading back into the high end of recent action, but further upside remains limited for the AUD with long-term resistance piling up from the 1.0920 level.
On the down side, prices have been firmly cycling the 200-day SMA for most of the back half of 2023, and it won't take much to push the Aussie back into a bearish pattern in a return to the long-run average.
Technical indicators are also running dry on the high side, with the Relative Strength Index (RSI) and Moving Average Convergence-Divergence (MACD) both tipping into overbought territory, though daily candlestick traders will want to wait for a slow-MA MACD crossover to confirm bearish momentum.
AUD/NZD Hourly Chart

AUD/NZD Daily Chart

AUD/NZD Technical Levels
-
22:19
Australia Judo Bank Manufacturing PMI came in at 48.2, above expectations (48) in October
-
21:57
EUR/JPY Price Analysis: Soars to new 15-year high, above 160.00
- EUR/JPY reached a new YTD high of 160.85, closing Tuesday's session with gains of over 1.32%.
- The uptrend remains intact, with the potential to test multi-year high of 169.97.
- Key resistance levels include the April 2008 high at 164.97 and the 2008 highs.
- On the downside, support levels are at 160.00, followed by the Tenkan-Sen at 159.27 and the 159.00 mark.
EUR/JPY rallies to a new year-to-date (YTD) high of 160.85, closing Tuesday’s session with gains of more than 1.32% or 200 pips post the Bank of Japan’s (BoJ) decision to keep its ultra-loose monetary policy. As Wednesday’s Asian session begins, the cross-currency pair trades at 160.35, almost unchanged.
With price action finally breaking the top of the range, the EUR/JPY uptrend remains intact, and it could be testing 13-year highs of 169.97, but buyers must face solid resistance levels ahead. The next resistance level would be the April 2008 high at 164.97 before rallying towards the 2008 highs.
Conversely, the EUR/JPY first support would be the 160.00 mark. Once cleared, the next support would be the Tenkan-Sen at 159.27, followed by the 159.00 mark. If sellers push prices lower, the next support would be the Senkou Span A at 158.43 before tripping towards 158.00.
EUR/JPY Price Action – Daily chart

EUR/JPY Technical Levels
-
21:47
New Zealand Unemployment Rate meets expectations (3.9%) in 3Q
-
21:46
New Zealand Labour Cost Index (YoY) below forecasts (4.2%) in 3Q: Actual (4.1%)
-
21:46
New Zealand Participation Rate came in at 72% below forecasts (72.5%) in 3Q
-
21:46
New Zealand Employment Change came in at -0.2% below forecasts (0.4%) in 3Q
-
21:46
New Zealand Labour Cost Index (QoQ) registered at 0.8%, below expectations (1%) in 3Q
-
21:29
GBP/USD fails to hold above the 20-day SMA, eyes on BoE and Fed
- The Cable slightly retreated and closed Tuesday with 0.15% losses at 1.2150.
- Markets aren’t discounting rate hikes for this week’s BoE and Fed meetings.
- Focus will be set on both bank's statements and their Chairman’s pressers.
- The BoE will release a fresh macro forecast.
In Tuesday’s session, the GBP/USD traded in the 1.2120 - 1.2200 range, closing with mild losses around 1.2150. On the USD side, it gained momentum with the DXY Index, advancing to 106.70, mainly driven by a cautious market mood. In that sense, as the economic calendar was empty with no relevant reports released by the US or the UK, the Greenback’s strength explained the pair’s trajectory.
On the Federal Reserve’s (Fed) side, investors await more clues on the bank’s stance, specifically on how they are assessing the recent robust economic reports and how they would impact their policy stance as they may give the officials reasoning to continue hiking. That being said, since the September meeting, inflation and job creation have decelerated, which would favour the case of the Fed finishing its tightening cycle with no hikes in the remainder of 2023. Markets have already discounted a pause for Wednesday's announcement, and the odds of a hike in December are still low but the bank's stance will likely impact the expectations for the last meeting of 2023.
On the Bank of England’s side, investors aren’t foreseeing a hike and will also look for clues for placing their bets for the next meetings on the bank’s statement and on Andrew Bailey’s words. Regarding the forecasts, there are growing expectations that as recent economic activity data came in weak, the bank will revise to the downside growth estimations while inflation projections are expected to be revised to the upside as prices remain stubbornly high.
GBP/USD Levels to watchAnalysing the daily chart, GBP/USD presents a bearish outlook for the short term. Both the Relative Strength Index (RSI) and Moving Average Convergence Divergence (MACD) remain in negative territory, and the pair is below the 20,100 and 200-day Simple Moving Averages (SMAs), which highlights the continued dominance of bears on the broader scale.
Support levels: 1.2100, 1.2080, 1.2050.
Resistance levels: 1.2180 (20-day SMA), 1.2200, 1.2250.
GBP/USD Daily Chart
-638343844439788174.png)
-
21:25
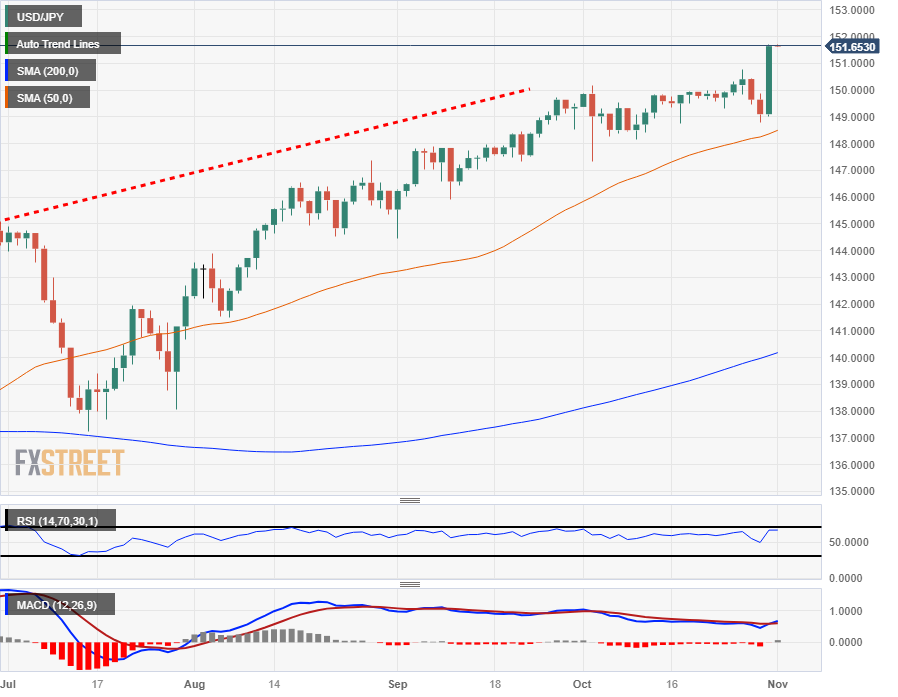
USD/JPY pinned into the high end near 151.80 after dovish BoJ leaves Yen to flounder
- The USD/JPY climbed 1.75% on Tuesday after a dovish showing from the BoJ.
- The Yen has tumbled back into record lows, with the USD/JPY twenty pips away from a 30-year record.
- Fed Wednesday, US NFP Friday to dominate the back half of the trading week.
The USD/JPY is inches away from setting a new three-decade high as the pair trades into 151.70 heading into the end of Tuesday trading after the Bank of Japan (BoJ) left the Yen (JPY) in the dust with a dovish showing.
It's going to be a USD-forward showing for the latter half of the trading week, with the Federal Reserve's (Fed) latest rate call due on Wednesday, with another US Non-Farm Payroll (NFP) Friday set to close out the action.
BoJ: Another disappointment for JPY bulls – TDS
After announcing a slight tweak to the BoJ's yield curve control (YCC) scheme, BoJ Governor Kazuo Ueda struck a notably dovish tone, voicing concerns that inflation wouldn't achieve the BoJ's long-run targets "with certainty" and there's still too much room until positive price cyclicality is seen.
Despite that, the BoJ still upgraded their inflation forecasts, and the Japanese central bank now sees Japan's inflation at 2.8% for 2024 (previously 1.9%).
On the US side, the Fed is set to give their latest rate call on Wednesday, and though markets are broadly forecasting the Fed to stand pat on rates for this meeting, odds of one last rate hike for 2023 are rising, and investors will be keeping a close eye on FEd Chairman Jerome Powell's ensuing speech after the rate announcement.
Further out, US NFP is set to cap off another trading week, and markets are expecting a decline in the headline figure from 336K to 180K, and another beat in jobs data would be just the spark needed to send the US Dollar spiraling even higher.
USD/JPY Technical Outlook
The Yen's deflate on Tuesday has sent the USD/JPY surging, and the pair is resting some 20-odd pips from setting a fresh 30-year high beyond 151.94, a previous record ceiling set back in October of 2022.
With record bids crossing the pair, there's little in the way of technical resistance keeping the pair lashed down. The Relative Strength Index (RSI) and Moving Average Convergence-Divergence (MACD) indicators have been pinned in overbought-to-neutral territory since August.
On the low side, the 50-day Simple Moving Average (SMA) is drifting upwards, acting as dynamic technical support from just north of the 148.00 handle.
USD/JPY Daily Chart
USD/JPY Technical Levels
-
20:39
Forex Today: Dollar rises as markets await the Fed and employment data
During the Asian session, New Zealand will release the employment report, and RBNZ Governor Orr will hold a press conference following the presentation of the Financial Stability Report. Australia's data includes the AiG Index and Building Permits. Later in the day, the ADP Employment report and the ISM Manufacturing PMI are due. The key event will be the FOMC decision and Powell's press conference.
Here is what you need to know on Wednesday, November 1:
The Federal Reserve (Fed) concludes its two-day meeting on Wednesday, with market expectations for the central bank to maintain its monetary policy stance. No surprises are expected, and if the Fed holds the same tone and message, it could be a non-event for markets. Analysts are looking for clues about how long the Fed will keep rates higher.
Before the FOMC statement, important economic data is due, including the ADP employment report, JOLTS, and the ISM Manufacturing PMI. More jobs data is due later in the week with the weekly Jobless Claims on Thursday and Nonfarm Payrolls on Friday.
Wall Street posted gains on Tuesday; however, the US Dollar strengthened amid higher Treasury yields. The Dow Jones gained 0.38%, and the Nasdaq climbed 0.48%. The 10-year Treasury yield rose to 4.90%. The US Dollar Index (DXY) rebounded and posted its highest close since October 4, above 106.60.
Data from the Eurozone showed that inflation slowed more than expected in October and that the economy contracted by 0.1% during the third quarter. These numbers will likely keep the European Central Bank (ECB) on hold. EUR/USD dropped from 1.068 to 1.0555. Despite the decline, the pair continues to make higher highs and higher lows, which is a positive sign for the Euro. However, it needs to break above 1.0700 to open the doors to more gains.
Analysts at Commerzbank on Euro area inflation:
Most members of the ECB's Governing Council are likely to be pleased with the data. The ECB is unlikely to raise interest rates further. This is all the more true as the economy contracted slightly in the third quarter.
GBP/USD reached 1.2200 and then turned downward, remaining below the 20-day Simple Moving Average (SMA). It closed around 1.2150, moving sideways near monthly lows. EUR/GBP reversed after hitting the highest level since May at 0.8757 and dropped towards 0.8700.
The Japanese Yen was the worst performer on Tuesday after the Bank of Japan (BoJ) meeting. USD/JPY continued to rise even during the American session and posted at 151.60, the highest daily close since 1990.
The Swiss Franc also tumbled across the board on Tuesday, with USD/CHF rising almost a hundred pips, and EUR/CHF climbing above 0.9600, reaching the highest level since October 5.
AUD/USD continued to trade in a range around 0.6350, offering no clear signals. The improvement in market sentiment did not offset Dollar strength and kept the pair far from 0.6400 and closer to 0.6300. Australian data due on Wednesday includes the AiG Construction, Manufacturing, and Industry indexes, as well as Building Permits.
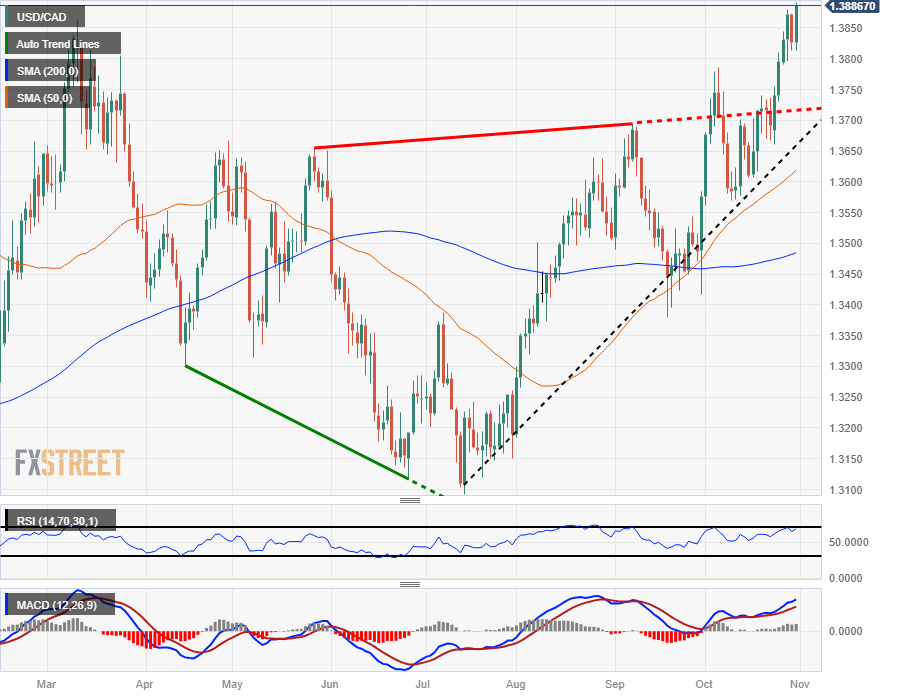
USD/CAD hit fresh one-year highs at 1.3891 and then pulled back to 1.3870. The pair maintains a bullish tone, facing resistance at 1.3900.
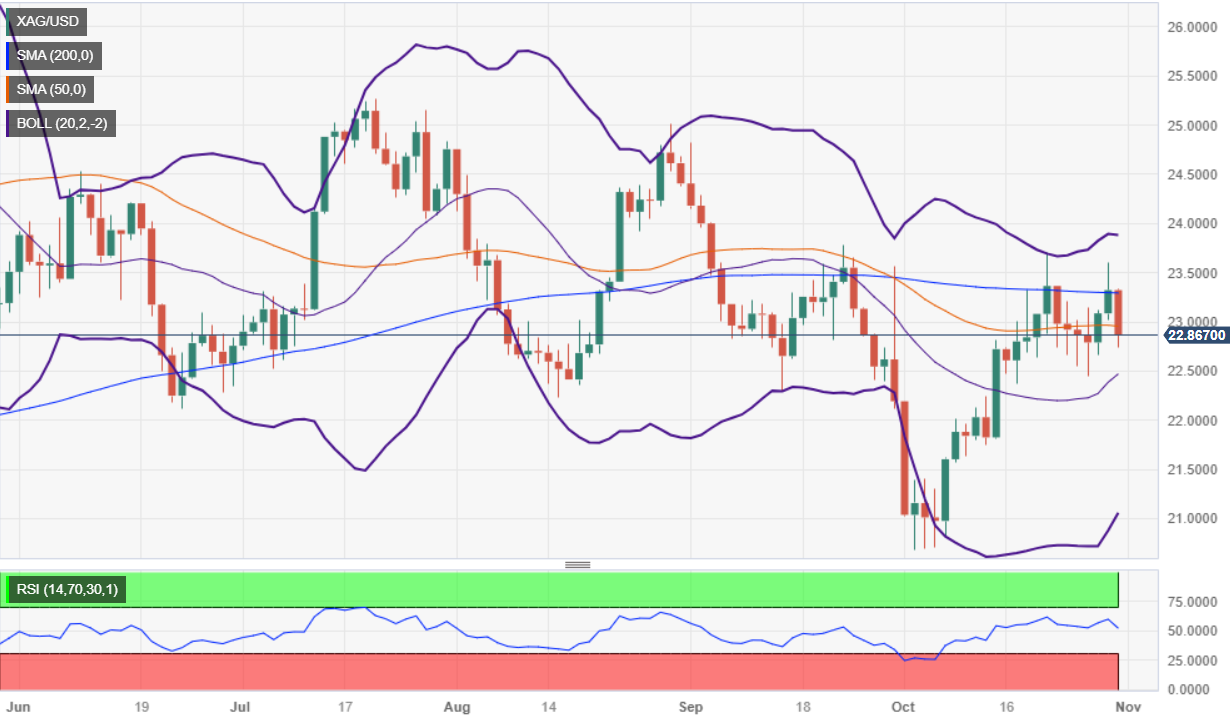
Gold and Silver tumbled ahead of the FOMC meeting. XAU/USD failed to hold above $2,000 and dropped to $1,980. Silver lost 2%, falling to $22.75.
Like this article? Help us with some feedback by answering this survey:
Rate this content -
20:32
United States API Weekly Crude Oil Stock rose from previous -2.668M to 1.347M in October 27
-
19:50
Silver Price Analysis: XAG/USD price retreats below $23.00 as double-top looms
- Silver is facing a potential double-top formation on the daily chart suggests further retracement is possible.
- Key support levels include the 50-day moving average (DMA) at $22.93 and the 20-day DMA at $22.45.
- On the upside, reclaiming $23.00 would bring the 200-DMA at $23.28 into focus, followed by the September 23 daily high at $23.77.
Silver price trips down and aims below the $23.00 mark, which was briefly visited by the grey metal and capped by a strong recovery from the Greenback. The XAG/USD is trading at $22.86, down 1.82%.
A double-top in the daily chart is forming, suggesting that XAG/USD could retrace further, past the latest cycle low of $22.45, the October 26 low. However, on its way to challenging the latter, Silver must break key technical support levels like the 50-day moving average (DMA) at 422.93, and the 20-day moving average (DMA) at $22.45. Once those levels are cleared, Silver could shift from a neutral to a downward bias.
Conversely, if XAG/USD stays above the 50-DMA and reclaims $23.00, the following resistance level would be the 200-DMA at $23.28, which needs to be cleared, along with the September 23 daily high at $23.77, the latest cycle high, to shift the grey-metal bias to upwards. In that outcome, the XAG/USD next resistance would be $24.00.
XAG/USD Price Action – Daily chart
XAG/USD Technical Levels
-
19:06
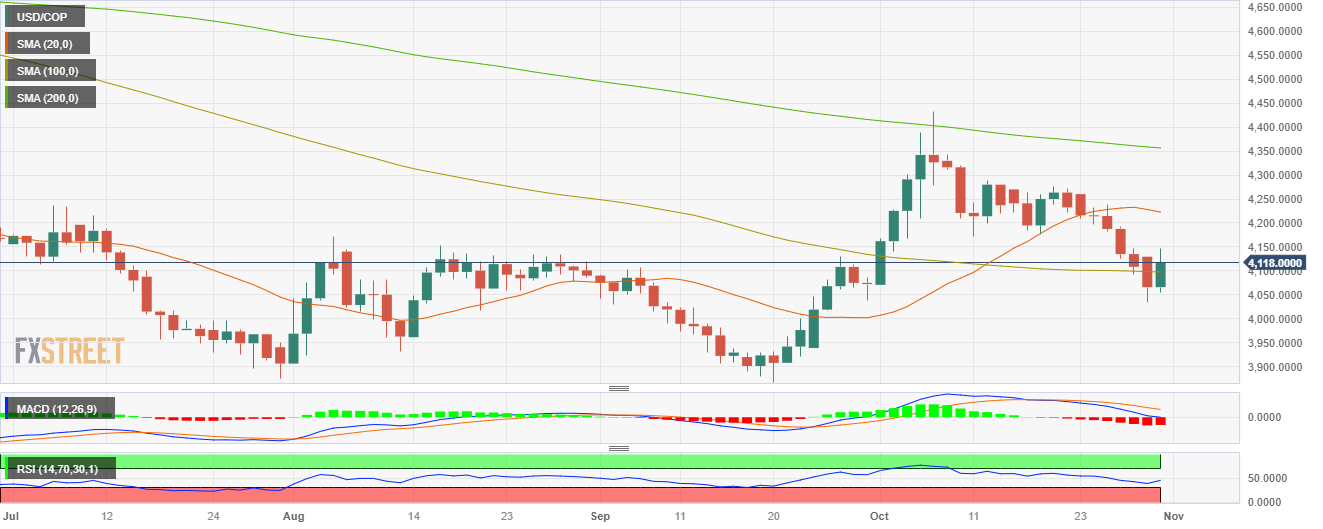
USD/COP retakes the 100-day SMA, bears still in command
- USD/COP is up by more than 1.50%, towards 4122.5.
- On Wednesday, the Fed announces its monetary policy decision, on Thursday, it’ll be the Colombian Bank’s turn.
- A negative market environment seems to be favouring the USD.
The USD/COP sharply rose on Tuesday, mainly driven by a cautious market mood ahead of the Federal Reserve (Fed) and the Colombian central bank decisions on Wednesday and Thursday.
On the US side, markets have already discounted a pause, but investors are looking for further clues on the Fed’s plan for the December meeting to take on their next positions. As for now, the CME FedWatch tool suggests that the odds of a hike in the last meeting of 2023 are low, but the policy statement and Chair Powell’s presser will likely impact those expectations.
Recent indicators reported that the US economy is doing better than expected, which will probably give the Fed officials reasons to leave the door open to hiking agains. Job creation has slightly decelerated, but the economic activity remains strong, which gave the Greenback traction in the last sessions.
On the COP’s side, markets are also discounting a pause in Thursday’s quarterly report from the Colombian Central Bank, holding rates at 13.25%. In the last meeting, the bank sounded hawkish and considered that its wasn’t prudent to consider cutting rates due to the recent economic data. In the meantime, swaps markets are discounting higher odds of the easing cycle to start next December.
USD/COP Levels to watch
According to the daily chart, the technical outlook for the USD/COP remains neutral to bearish, as despite the bulls gaining ground, the bears are in command. The Relative Strength Index (RSI) shows an upward trend below its midline, suggesting a potential resurgence of bullish strength, while the Moving Average Convergence (MACD) prints neutral red bars.
In the larger context, the pair is below the 20 and 200-day Simple Moving Averages (SMAs), and if the bulls hold above the 100-day average, the buyers may have some hope of stopping the recent bearish momentum.
Support levels: 4096.7 (100-day SMA), 4045.7,4027.3.
Resistance levels: 4147.8,4175.5, 4190.9.
USD/COP Daily Chart
-
19:04
Gold Price Forecast: XAU/USD reclaims $2,000 ahead of Fed rate call
- Spot Gold prices are on the high end as investors await the latest Fed statement.
- XAU/USD is hesitating near the $2,000 major level, but markets remain pinned in risk-off territory.
- Central banks may be a major underpin in Gold prices.
The XAU/USD is seeing some hesitation after pinning into the $2,000 major level as investors turn broadly risk-off ahead of the Federal Reserve's (Fed) upcoming interest rate call slated for tomorrow.
Spot Gold is set for it's best four-week performance in over seven months, with the XAU/USD reaching 11% from October's low bids near $1,810 and reaching a monthly high of $2,009.49.
Broad-market sentiment remains firmly beaten back on Tuesday, with Gold and the US Dollar climbing for the day as investors brace for the Fed rate call tomorrow. Markets anticipate the US central bank will hold rates steady for the upcoming meeting, but steady US economic data and still-firm inflation figures are increasing the chances of one last rate hike for 2023 at December's Fed meeting.
Central bank Gold purchases may have been an unexpected underpin in XAU/USD bids lately; according to reporting by the World Gold Council (WGC), central banks were a primary driver of Gold demand in the 3rd quarter.
Central banks socked away an additional 337 tons of physical Gold in the three months through September, compared to 175 tons the previous quarter, and 103 tons the quarter before that.
Central bank Gold purchases for 2023 now total over 800 tons, and central bank Gold demand is a key counterweight for XAU/USD bids that have become increasingly disconnected from US Treasury yields as of late.
XAU/USD Technical Outlook
Spot Gold's recent gains see the XAU/USD vaulting cleanly over the 200-day Simple Moving Average (SMA) currently rising into $1,940.
The 50-day SMA is set to complete a bullish rollover, rising into $1,940, and will confirm a bullish crossover of the 200-day SMA if XAU/USD sellers don't get bids pushed back towards $1,900.
2022's swing high of $2,079.76 sits as the key ceiling to break through for Gold bulls, while a bearish return to October's bottoms past $1,810 will see the XAU/USD trading into fresh lows for 2023.
XAU/USD Daily Candles
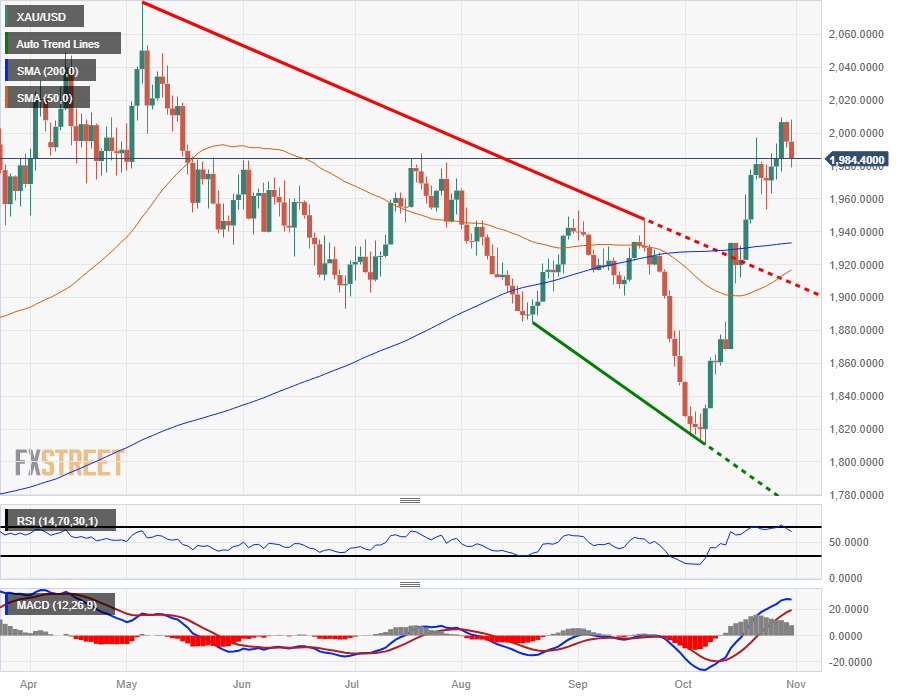
XAU/USD Technical Levels
-
19:03
EUR/USD dips below 1.0600 on mixed EU data, ahead of Fed’s decision
- EUR/USD retreats from a weekly high of 1.0675, currently trading below 1.0600.
- Mixed economic data from the Eurozone, with inflation dropping to 2.9% in October but GDP contracting by 0.1% in Q3.
- ECB officials keep the door open for additional tightening, with Joachim Nagel emphasizing the need for high rates for a prolonged period.
EUR/USD retreats from a weekly high at 1.0675 reached during the European session and dives below the 1.0600 figure courtesy of mixed economic data from the Eurozone (EU) and overall US Dollar (USD) strength. At the time of writing, is trading at 1.0580, down 0.31%.
Euro loses ground against the US Dollar amid mixed economic signals from the Eurozone
With Wall Street printing gains, risk appetite has improved throughout the North American session. Consumer Confidence deteriorated in the United States (US), as the Conference Board (CB) revealed. Figures came at 102.6, from 104.3 in September, above estimates of 100.5. At the same time, the US Department of Labor reported that employment costs are rising. Employment Cost Index rose 1.1%, above forecasts of 1%.
On Wednesday, the economic docket would feature the ADP Employment Change report and S&P Global and ISM PMIs ahead of the Federal Reserve’s monetary policy decision. The Fed is expected to keep rates unchanged, but it will most likely keep another rate hike increase on the table.
In October, Eurozone inflation dropped below the 3% threshold, coming in at 2.9%, which is lower than the expected 3.1% and a significant decrease from the 4.3% recorded in September. This data supports the European Central Bank's decision to keep rates on hold last week. As a result, money market futures are now estimating that the first-rate cut may occur in the first half of 2024.
Despite the positive inflation figures, the Eurozone's GDP for the third quarter was disappointing, coming in at -0.1%, which missed the forecast of 0% growth. Despite this, some European Central Bank (ECB) officials have kept the door open for additional tightening. Joachim Nagel from the Bundesbank stated, "Our tight monetary policy is working, but we must not let up too soon." He emphasized the need to maintain sufficiently high-interest rates for an extended period.
EUR/USD Technical Levels
-
18:21
Colombia Interest rate in line with expectations (13.25%)
-
18:14
GBP/JPY reclaims 184.00 on Tuesday as Yen gets yanked back down by dovish BoJ
- The GBP/JPY has rocketed back to 184.00 after the BoJ flubbed hawkish tone expectations.
- The Pound Sterling is set for its single best trading day against the Yen since July.
- The Guppy is back into its highest bids in over a month.
The GBP/JPY is climbing back over the 184.00 handle for Tuesday, with the Yen (JPY) getting punished after the Bank of Japan (BoJ) struck a far more dovish tone than markets were prepared for, even as Japanese inflation forecasts tick higher.
BoJ: Another disappointment for JPY bulls – TDS
BoJ Governor Kazuo Ueda hit newswires early Tuesday with dovish comments, stating that he doesn't see Japanese inflation reaching BoJ targets "with certainty", and the Japanese central bank will stand pat on interest rates for the foreseeable future, even as the BoJ's own inflation forecasts are revised higher.
The BoJ now expects 2024 inflation to come in at 2.8% (previous 1.9%), with 2025 seen at 1.7% (previous 1.6%).
It is now the Bank of England's (BoE) ballgame to lose with UK's central bank slated to bring another rate call on Thursday. The BoE is broadly expected to also hold steady on rates, and investors will be looking at the BoE's Monetary Policy Report and BoE Governor Andrew Bailey's press conference.
BoE Governor Bailey's press conference is scheduled for thirty minutes after the rate decision announcement is released.
GBP/JPY Technical Outlook
Tuesday's rally in the GBP/JPY sends the pair back over the 184.00 handle, taking the Guppy into its highest bids in six weeks.
The pair continues to cycle the 50-day Simple Moving Average (SMA), with the MA in play near 183.00.
Major top side resistance is baked in from August's swing high into 186.77, and a congestion range from here will see the formation of a head and shoulder pattern from July's peak near 184.00.
GBP/JPY Daily Chart
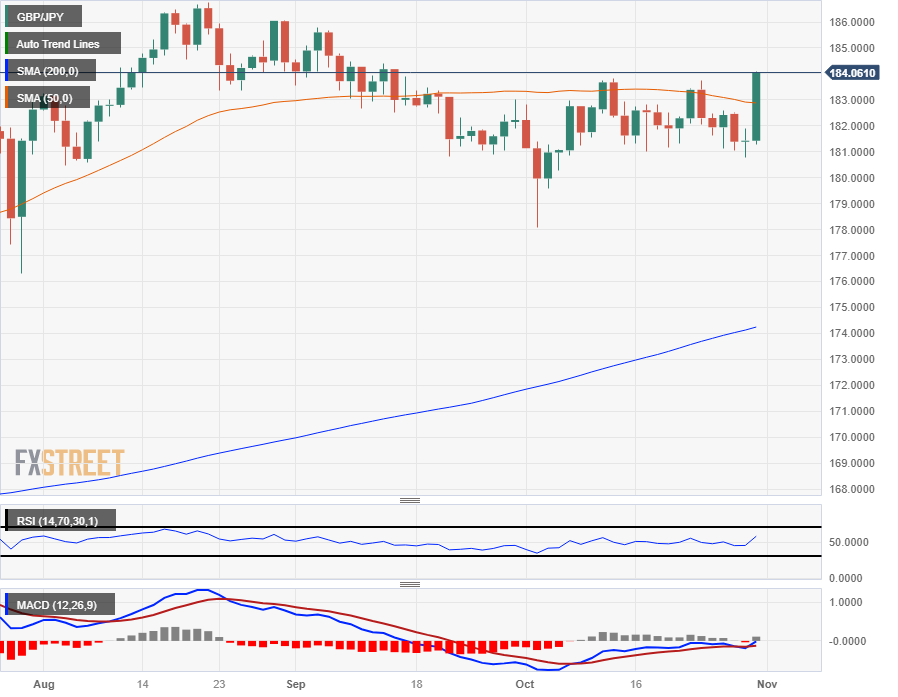
GBP/JPY Technical Levels
-
17:30
USD/CHF to multi-week highs ahead of Fed decision
- USD/CHF tallies a sixth consecutive day of gains, rising to a high above 0.9100 and then settled at 0.9080.
- The market's mood is cautious ahead of the Fed decision on Wednesday which favours the USD.
On Tuesday, the USD/CHF extended its gains and rose to its highest level since mid-month, above 0.9100 and now trades above its primary 20,100 and 200-day Simple Moving Averages (SMAs). Daily market movers for the pair included mid-tier housing, consumer confidence and economic activity figures from the US but the Greenback is strengthening ahead of the Federal Reserve (Fed) decision on Wednesday.
On the data front, the House Price Index from August came in at 0.6% MoM, beating the expected 0.5% but declining from its previous reading of 0.8%. Furthermore, the S&P/Case-Shiller Home Price from August came in at 2.2% YoY, higher than the expected 1.6% and accelerated regarding its last reading of 0.2%. In addition, the CB Consumer Confidence Index from October also beat expectations, coming in at 102.6.
On the negative side, the Institute for Supply Management - Chicago reported that the Chicago PMI from October came in lower than expected at 44 vs the expected 45 and declined from its previous reading of 44.1.
Regarding the Fed’s decision, a pause is priced in, and investors will closely look at the policy statement and Chair Powell’s tone in his presser following the decision. In the last meeting, the bank hinted at a “cautious” stance, pointing out that the decisions will be decided carefully, and Powell left the door open for further tightening if the incoming data justifies it. In line with that, investors seem to be refraining from taking on big positions and instead seeking refuge in the USD, which is pushing the pair to the upside and lowering the demand for riskier assets.
USD/CHF Levels to watchThe technical analysis of USD/CHF highlights a short-term bullish trend. Nevertheless, traders should be mindful of overbought conditions, as these signals may foreshadow an incoming technical correction. The Relative Strength Index (RSI) displays a strong upward momentum in the overbought region, while the Moving Average Convergence (MACD) histogram presents larger green bars. Additionally, the pair is above the 20,100,200-day Simple Moving Average (SMA), indicating that the buyers command the broader perspective.
Resistance levels: 0.9090, 0.9100, 0.9150.
Support levels: 0.9050, 0.9015-0.9000 (20 and 200-day SMA convergence), 0.8970.
USD/CHF Daily Chart
-638343695129449338.png)
-
17:30
NZD/USD falls back towards 0.5800 as Greenback steps up
- The NZD/USD is falling back into near-term congestion as markets pick up the US Dollar.
- Kiwi traders keeping a look out for Tuesday's NZ labor figures.
- Broad markets are looking to Fed's Wednesday showing.
The NZD/USD is falling back towards 0.5800 as investors broadly turn back into the US Dollar (USD) ahead of the Federal Reserve's (Fed) upcoming rate call on Wednesday. Before that, late Tuesday sees the latest labor and unemployment figures for New Zealand, followed by a speech from Reserve Bank of New Zealand (RBNZ) Governor Adrian Orr.
Broad-market sentiment has turned moderately risk-off, sending the USD higher across the board with the Dollar Index (DXY) gaining around a percent from Tuesday's early low, and the Kiwi is getting pushed back into the 0.5800 handle, keeping the NZD/USD pinned in familiar downside with the pair trading into eleven-month lows.
Markets have priced in a hold on Fed rates this Wednesday, but firm US growth figures and inflation that refuses to abate quick enough are pushing up odds of one more rate hike from the Fed in December to close out the year.
New Zealand: More robust than expected labour market to benefit the NZD – Commerzbank
New Zealand's Q3 Unemployment Rate is expected to tick up from 3.6% to 3.9%, with the 3rd quarter's Employment Change expected to climb 0.4%, compared to Q2's 1.0%.
With NZ labor market data expected to decline slightly, ongoing market concerns about China's wobbly economy, and still-high inflation plaguing the New Zealand domestic economy, the Kiwi isn't expected to find much to rally about.
However, a better-than-expected reading for economic activity figures could see the RBNZ given enough room to further tighten monetary policy, which could bolster the NZD.
NZD/USD Technical Outlook
With the Kiwi trading back into 0.8500, downside technical support is thinning quickly, and the levels to watch will be last week's downswing into 0.5772, and a break beyond this level will see the NZD/USD making a run for last October's trading territory, near 0.5700.
Technical resistance is piling up above current bids, with the 50-day Simple Moving AVerage (SMA) pushing down into the 0.5900 major level, a confluence resistance level. Further beyond that, October's swing high into 0.6050 represents the last major ceiling for any bullish recoveries for the NZD/USD.
NZD/USD Daily Chart
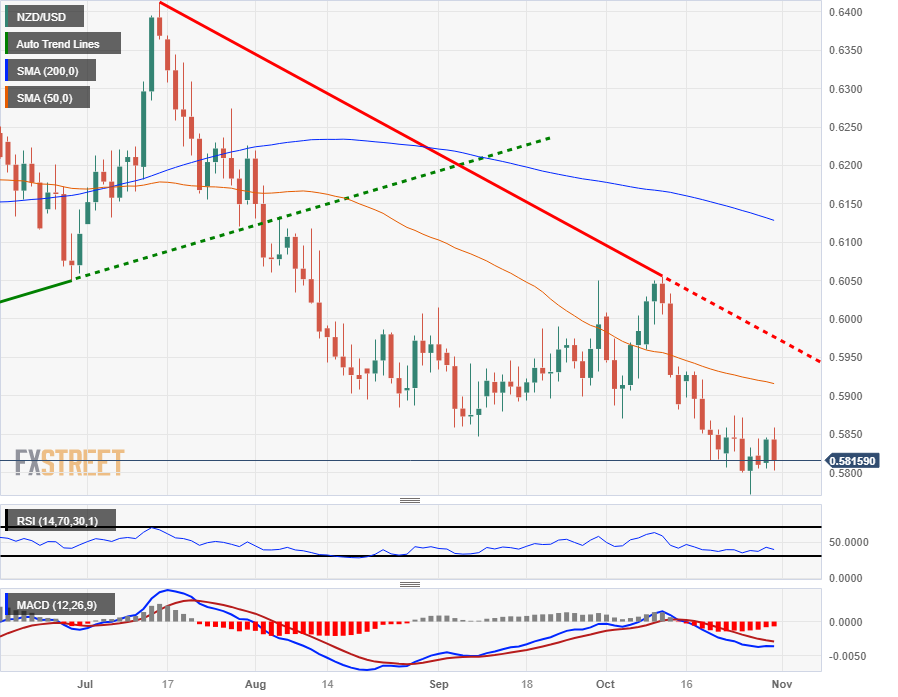
NZD/USD Technical Levels
-
17:23
EUR/GBP retreats from 5-month high as EU economy contracts
- EUR/GBP falls from a 5-month high of 0.8754, currently trading at 0.8705.
- Eurozone inflation drops to 2.9% in October, while GDP for Q3 misses forecasts, contracting by 0.1%.
- The Bank of England is expected to keep rates unchanged at 5.25% on November 2, as traders priced in rate cuts towards the end of 2024.
The EUR/GBP falls from a 5-month high reached earlier in the European session, at 0.8754, but has retreated after the Eurozone’s (EU) economy contracted while inflation cooled. Therefore, speculations are mounting that the European Central Bank (ECB) might finish raising rates. The cross exchanges hands at 0.8705.
Euro loses ground against the British Pound as economic data fuels speculation that the ECB might halt its rate hikes
During the European session, the EU revealed that inflation dipped below the 3% threshold in October, according to Eurostat, with prices rising to 2.9%, below the 3.1% expected and well beneath the September 4.3% jump. Given that data justifies the ECB’s pausing rates last week, money market futures estimate the first rate cut is expected in the first half of 2024.
Nevertheless, not everything is good news for the bloc, as the Gross Domestic Product (GDP) for Q3 missed forecasts of 0%, at -0.1%. despite that, some ECB officials continued to keep the door open for additional tightening, as Joachim Nagel from the Bundesbank noted, “Our tight monetary policy is working, but we must not let up too soon.” He stated that rates need to be at a sufficiently high level for a long time.
On the UK front, the Bank of England is expected to keep rates unchanged at a 15-year high of 5.25% on November 2. Although there are signs the economy is stagnating, inflation remains three times the BoE’s target of 2%. Money markets traders are betting the BoE is done raising rate increases, with rate cuts expected towards the end of 2024.
EUR/GBP Price Analysis: Technical outlook
From a daily chart perspective, the uptrend remains intact despite dipping toward the 0.8700 figure. However, if EUR/GBP sellers drive prices below the 200-day moving average (DMA) at 0.8691, that could pave the way towards a more significant correction, with first support seen at the October 24 low of 0.8682, followed by the August 11 high of 0.8669. On the other hand, if the pair stays above 0.8700, a re-test of 0.8754 is on the cards, followed by the 0.88 handle. Up next would be the May 3 high at 0.8834.
-
16:45
Canadian Dollar reverses course, falls to new twelve-month low as Fed decision looms
- Canadian Dollar falls back as broader markets turn into the US Dollar.
- Canada GDP flattens as economy lags, odds of future rate cuts beginning to rise.
- Fed’s Wednesday rate call has markets twisting, USD is Tuesday’s best performer.
The Canadian Dollar (CAD) has seen a quick end to its almost-rally on Monday, getting pushed back down and tipping into a fresh twelve-and-a-half-month low against the US Dollar (USD).
August’s Canada Gross Domestic Product (GDP) printed flat on Tuesday, missing the forecast of 0.1% and holding flat against July as Canadian economic growth stalls out.
Markets are turning broadly risk-off as investors jump back into the USD ahead of Wednesday’s Federal Reserve (Fed) rate call. While no rate moves are expected from the Fed this week, odds are increasing of one last rate hike in December before 2023 closes out.
Daily Digest Market Movers: Canadian Dollar flubs rally, market sentiment turns to the Greenback
- CAD bulls couldn’t extend Monday’s rebound into a second day as broad market risk appetite evaporates.
- USD is the largest market gainer for Tuesday, Dollar Index (DXY) climbs almost a full percent into 106.80 from Tuesday’s bottom of 105.90.
- Canadian GDP came in flat, missing expectations as Canadian manufacturing sectors chalk in a fifth straight month of growth declines, with notable losses in agriculture due to dry conditions in Western Canada.
- Odds of a rate cut in Q2 next year are rising as the Canadian economy shows deeper cracks.
- Fed’s rate call on Wednesday to be the major market focus mid-week, investors beginning to price in one more 25-basis-point rate hike from the FOMC in December.
- Bank of Canada (BoC) Governor Tiff Macklem will be squeaking in under the radar tomorrow, due to finish out day two of testifying before the Canadian government’s banking and finance oversight committee.
- BoC Governor Macklem day one highlights here.
USD/CAD Technical Analysis: Canadian Dollar can’t find strength to fight off US Dollar
The USD/CAD is heading back toward 1.3900 in Tuesday trading as the US Dollar sees a broad-market resurgence.
The USD/CAD kicked into an intraday low of 1.3813 Tuesday morning before the Greenback came roaring back, sending the USD/CAD into a fresh twelve-and-a-half month high above 1.3880.
The pair is vaulting off the 50-day Simple Moving Average (SMA) lifting into 1.3850, with the 200-day SMA building out a price floor from 1.3770.
Technical resistance to the topside is looking increasingly thin, with the only notable sticking point sitting at 1.3977, 2022’s annual high set back in October of last year.
USD/CAD Daily Chart
Canadian Dollar FAQs
What key factors drive the Canadian Dollar?
The key factors driving the Canadian Dollar (CAD) are the level of interest rates set by the Bank of Canada (BoC), the price of Oil, Canada’s largest export, the health of its economy, inflation and the Trade Balance, which is the difference between the value of Canada’s exports versus its imports. Other factors include market sentiment – whether investors are taking on more risky assets (risk-on) or seeking safe-havens (risk-off) – with risk-on being CAD-positive. As its largest trading partner, the health of the US economy is also a key factor influencing the Canadian Dollar.
How do the decisions of the Bank of Canada impact the Canadian Dollar?
The Bank of Canada (BoC) has a significant influence on the Canadian Dollar by setting the level of interest rates that banks can lend to one another. This influences the level of interest rates for everyone. The main goal of the BoC is to maintain inflation at 1-3% by adjusting interest rates up or down. Relatively higher interest rates tend to be positive for the CAD. The Bank of Canada can also use quantitative easing and tightening to influence credit conditions, with the former CAD-negative and the latter CAD-positive.
How does the price of Oil impact the Canadian Dollar?
The price of Oil is a key factor impacting the value of the Canadian Dollar. Petroleum is Canada’s biggest export, so Oil price tends to have an immediate impact on the CAD value. Generally, if Oil price rises CAD also goes up, as aggregate demand for the currency increases. The opposite is the case if the price of Oil falls. Higher Oil prices also tend to result in a greater likelihood of a positive Trade Balance, which is also supportive of the CAD.
How does inflation data impact the value of the Canadian Dollar?
While inflation had always traditionally been thought of as a negative factor for a currency since it lowers the value of money, the opposite has actually been the case in modern times with the relaxation of cross-border capital controls. Higher inflation tends to lead central banks to put up interest rates which attracts more capital inflows from global investors seeking a lucrative place to keep their money. This increases demand for the local currency, which in Canada’s case is the Canadian Dollar.
How does economic data influence the value of the Canadian Dollar?
Macroeconomic data releases gauge the health of the economy and can have an impact on the Canadian Dollar. Indicators such as GDP, Manufacturing and Services PMIs, employment, and consumer sentiment surveys can all influence the direction of the CAD. A strong economy is good for the Canadian Dollar. Not only does it attract more foreign investment but it may encourage the Bank of Canada to put up interest rates, leading to a stronger currency. If economic data is weak, however, the CAD is likely to fall.
-
16:24
ECB's Nagel: Rates must be sufficiently high for sufficiently long
European Central Bank (ECB) policymaker Joachim Nagel noted on Tuesday that inflation in the Euro area has fallen significantly but added that it was still too high, per Reuters.
Key quotes
"We must not let up too soon, rates must be sufficiently high for sufficiently long."
"It is not yet possible to say whether interest rates have already reached their peak."
"There are several upside risks to inflation; geopolitical tensions in the Middle East could drive up energy prices."
"Inflation has proven stubborn and has not yet been defeated."
Market reaction
EUR/USD stays under bearish pressure despite these hawkish comments and was last seen losing 0.45% on the day at 1.0565.
-
16:22
AUD/USD drops amid mixed sentiment, weak Chinese data
- AUD/USD drops more than 0.80%, trading at 0.6328 after hitting a daily high of 0.6376.
- US employment costs rise by 1.1%, above estimates, and Consumer Confidence deteriorates for a third straight month.
- The US Federal Reserve commences its two-day meeting, with expectations for rates to remain unchanged.
- The Reserve Bank of Australia faces pressure due to high inflation and strong consumer demand, with a 60% chance of a rate hike on November 7.
AUD/USD reversed its course during the North American session, dropping more than 0.80% due to a mixed market sentiment sponsored by weak economic data from China, alongside geopolitical risks attributed to the Middle East conflict. The pair is trading at 0.6328 after hitting a daily high of 0.6376.
Australian Dollar loses ground against the US Dollar as geopolitical risks and weak economic data from China weigh on the pair
Wall Street remains mixed, with the Dow Jones and the S&P 500 registering gains, except the Nasdaq Composite. The latest round of economic data from the United States (US) showed the employment costs are rising, according to the US Department of Labor. Employment Cost Index rose 1.1%, above estimates of 1%, while the Conference Board (CB) revealed Consumer Confidence is deteriorating for a third straight month.
Meanwhile, the US Federal Reserve (Fed) commenced its two-day meeting today, with officials expected to hold rates unchanged. After that, Fed Chair Jerome Powell would deliver its press conference, which would be interesting to see if he keeps the door open for another hike. Earlier in that day, the ADP Employment Change, along with PMIs, revealed by S&P Global and ISM, could stir the boat ahead of the Fed’s decision.
On Australia’s front, the Reserve Bank of Australia (RBA) remains under pressure due to high inflation and strong consumer demand. The swaps market implies around a 60% chance the RBA could hike rates from 4.1% by a quarter or percentage point on the November 7 meeting.
In the meantime, the Australian Dollar's (AUD) current leg down vs. the US Dollar (USD) was courtesy of China’s reporting October PMIs, which came weaker, with Services barely missing contractionary territory, while Manufacturing dropped below the 50 contraction/expansion level. Although it was an official statistic, traders will watch Caixin's release on Wednesday.
AUD/USD Technical Levels
-
16:19
Mexican Peso trades sideways despite Mexico’s upbeat data, ahead of Fed’s decision
- Mexican Peso remains unable to print a daily close below the 18.00 mark.
- Mexico's economy shows resilience as Gross Domestic Product expands for an eighth straight quarter.
- USD/MXN continues to exchange hands above the crucial 18.00 level, with geopolitical risks and month-end flows impacting the pair.
Mexican Peso (MXN) trades almost sideways against the US Dollar (USD) early morning during Tuesday’s North American session amid month-end flows and despite good economic data from Mexico. In addition, geopolitical risks remain as Israel disregards a cease-fire in Gaza, deteriorating investors' sentiment. Consequently, the USD/MXN continues to exchange hands above the 18.00 figure, seen as a crucial level for buyers and sellers, as they brace for the US Federal Reserve (Fed) monetary policy meeting.
Mexico’s National Statistics Agency (INEGI) revealed the country grew more than expected in the quarter and annually, extending its trend to eight consecutive quarters, posting solid growth and portraying a resilient economy. The annual growth rate slowed down compared to the previous quarter's reading. Jason Tuvey, deputy chief emerging markets economist at Capital Economics, said a “slowdown is on the cards,” adding that restrictive monetary policy takes a heavier toll, and weaker growth in the US weighs on Mexico’s external sector.
Meanwhile, the office of the finance minister in Mexico expressed that it’s too soon to assess the overall economic impact of Hurricane Otis.
In the meantime, Israel continues its ground offensive in Gaza. In addition to Middle East conflict, the Fed begins its two-day monetary policy meeting, in which officials are expected to keep rates unchanged at the 5.25% - 5.50% range, justifying that long-term bond yields remain higher. Besides that, traders would be looking for clues as Fed Chairman Jerome Powell would take the stand.
Daily digest movers: Mexican Peso hovers around 18.00, despite solid economic growth, awaits Fed's decision
- Mexico’s Gross Domestic Product grew by 0.9% QoQ in the third quarter on its preliminary reading, above the previous quarter and estimates of 0.8%.
- On a yearly basis, Mexico’s GDP for Q3 expanded 3.3%, above forecasts of 3.2%, but trailed the previous 3.6%.
- First estimates of Hurricane Otis damages stand at around $10 to 15 billion dollars, according to Enki Research, a firm specializing in natural disasters.
- Mexican authorities reported that around 270,000 houses in Acapulco were affected or destroyed, while 80% of hotels were severely damaged.
- The latest release of US economic data shows the economy remains resilient due to strong jobs market, as well as the preliminary release of Q3 GDP figures. USD/MXN traders should be aware of further economic data that could underpin or weigh on the Greenback.
- The US Dollar Index, which tracks the performance of the Greenback against six currencies, slides 0.40%, down at 106.15.
- Mexico’s economic docket will feature the release of , S&P Global Manufacturing PMIs, Foreign Exchange Reserves, and Gross Fixed Investment.
- The US agenda will feature the Fed’s decision, Fed Powell’s press conference, Nonfarm Payrolls employment data, and S&P Global and ISM Manufacturing PMIs.
- On October 24, Mexico's National Statistics Agency INEGI reported annual headline inflation hit 4.27%, down from 4.45% at the end of September, below forecasts of 4.38%.
- Mexico’s core inflation rate YoY was 5.54%, beneath forecasts of 5.60%.
- The Bank of Mexico (Banxico) held rates at 11.25% in September and revised its inflation projections from 3.50% to 3.87% for 2024, above the central bank’s 3.00% target (plus or minus 1%). Next decision will be announced on November 9.
Technical Analysis: Mexican Peso buyers target the 200-day Simple Moving Average
The USD/MXN uptrend remains intact despite Friday’s dip below the 18.00 figure, which puts the 20-day Simple Moving Average (SMA) at 18.10 at risk of being decisively broken to the downside. A daily close below the latter would keep sellers hopeful of driving price action towards the 200-day SMA at 17.72. A breach of the last and the subsequent support would be the 50-day SMA at 17.58. On the flip side, if the exotic pair remains above the 20-day SMA, the next resistance will emerge at the October 26 high at 18.42 before challenging last week’s high at 18.46, ahead of the 18.50 figure.
Mexican Peso FAQs
What key factors drive the Mexican Peso?
The Mexican Peso (MXN) is the most traded currency among its Latin American peers. Its value is broadly determined by the performance of the Mexican economy, the country’s central bank’s policy, the amount of foreign investment in the country and even the levels of remittances sent by Mexicans who live abroad, particularly in the United States. Geopolitical trends can also move MXN: for example, the process of nearshoring – or the decision by some firms to relocate manufacturing capacity and supply chains closer to their home countries – is also seen as a catalyst for the Mexican currency as the country is considered a key manufacturing hub in the American continent. Another catalyst for MXN is Oil prices as Mexico is a key exporter of the commodity.
How do decisions of the Banxico impact the Mexican Peso?
The main objective of Mexico’s central bank, also known as Banxico, is to maintain inflation at low and stable levels (at or close to its target of 3%, the midpoint in a tolerance band of between 2% and 4%). To this end, the bank sets an appropriate level of interest rates. When inflation is too high, Banxico will attempt to tame it by raising interest rates, making it more expensive for households and businesses to borrow money, thus cooling demand and the overall economy. Higher interest rates are generally positive for the Mexican Peso (MXN) as they lead to higher yields, making the country a more attractive place for investors. On the contrary, lower interest rates tend to weaken MXN.
How does economic data influence the value of the Mexican Peso?
Macroeconomic data releases are key to assess the state of the economy and can have an impact on the Mexican Peso (MXN) valuation. A strong Mexican economy, based on high economic growth, low unemployment and high confidence is good for MXN. Not only does it attract more foreign investment but it may encourage the Bank of Mexico (Banxico) to increase interest rates, particularly if this strength comes together with elevated inflation. However, if economic data is weak, MXN is likely to depreciate.
How does broader risk sentiment impact the Mexican Peso?
As an emerging-market currency, the Mexican Peso (MXN) tends to strive during risk-on periods, or when investors perceive that broader market risks are low and thus are eager to engage with investments that carry a higher risk. Conversely, MXN tends to weaken at times of market turbulence or economic uncertainty as investors tend to sell higher-risk assets and flee to the more-stable safe havens.
-
16:06
US Dollar gains momentum as Fed meeting gets underway
- US Dollar is gaining traction, DXY index surged to 106.70.
- The two-day Fed meeting ends on Wednesday with a monetary policy decision.
- Mid-tier economic figures from the US came in mixed.
- US Treasury yields retreat, which may limit the USD’s momentum.
The US Dollar (USD) is up on Tuesday, with the DXY index rising to 106.70 on the back of a cautious market mood ahead of the Federal Reserve (Fed) Interest Rate Decision on Wednesday. In addition, the US reported strong Housing and Confidence data, while Chicago’s PMI from October came in lower than expected.In defiance of the Federal Reserve’s (Fed) tightening measures, the United States economy showed remarkable resilience, which allowed the Greenback to gain traction. Despite this, the possibility of a 25-basis-point hike in December, as per the CME FedWatch Tool, continues to be low, limiting any upward movement of the USD. That being said, the policy statement and Fed Chair Jerome Powell’s words may provide further clues on forward guidance for investors to continue modeling their expectations for the next meeting.
Daily Digest Market Movers: US Dollar gained traction amid positive Housing and Confidence data, eyes on Fed- The US DXY Index jumped to 106.70, after bottoming below 106.00.
- The US Conference Board Consumer Confidence Index from October beat expectations, coming in at 102.6 vs the 100.5 expected.
- The S&P Dow Jones Indices reported that the S&P/Case-Shiller Home Price from August exceeded expectations. It came in at 2.2% YoY vs the expected 1.6% and increased in relation to its last reading of 0.2%.
- On the negative side, the Chicago PMI from October came in at 44, below the expected 45 consensus and declined from its previous reading of 44.1.
- Meanwhile, US government bond yields are mixed with the 2, 5 and 10-year yields standing at 5.07%,4.81% and 4.86%, respectively, which could limit the USD’s momentum.
- For Wednesday, according to the CME FedWatch Tool, a pause in November is nearly priced in, while the odds of a 25-basis-point hike in December are still low near 20%.
Technical Analysis: US Dollar Index jumps back above 20-day SMA, momentum still limited
According to the daily chart, the technical outlook for the DXY Index remains neutral to bearish as the bulls show signs of exhaustion. The Relative Strength Index (RSI) points toward a potential reversal, as its positive slope above the midline weakens, while the Moving Average Convergence Divergence (MACD) histogram presents red bars.
As long as the index remains above the 20, 100 and 200-day Simple Moving Averages (SMAs), the outlook on the broader scale will favour bulls, but buyers will probably have a hard time defending the 20-day SMA as momentum weakens.
Supports: 106.30 (20-day SMA), 106.00, 105.70.
Resistances: 106.80, 107.00, 107.30.US Dollar FAQs
What is the US Dollar?
The US Dollar (USD) is the official currency of the United States of America, and the ‘de facto’ currency of a significant number of other countries where it is found in circulation alongside local notes. It is the most heavily traded currency in the world, accounting for over 88% of all global foreign exchange turnover, or an average of $6.6 trillion in transactions per day, according to data from 2022.
Following the second world war, the USD took over from the British Pound as the world’s reserve currency. For most of its history, the US Dollar was backed by Gold, until the Bretton Woods Agreement in 1971 when the Gold Standard went away.How do the decisions of the Federal Reserve impact the US Dollar?
The most important single factor impacting on the value of the US Dollar is monetary policy, which is shaped by the Federal Reserve (Fed). The Fed has two mandates: to achieve price stability (control inflation) and foster full employment. Its primary tool to achieve these two goals is by adjusting interest rates.
When prices are rising too quickly and inflation is above the Fed’s 2% target, the Fed will raise rates, which helps the USD value. When inflation falls below 2% or the Unemployment Rate is too high, the Fed may lower interest rates, which weighs on the Greenback.What is Quantitative Easing and how does it influence the US Dollar?
In extreme situations, the Federal Reserve can also print more Dollars and enact quantitative easing (QE). QE is the process by which the Fed substantially increases the flow of credit in a stuck financial system.
It is a non-standard policy measure used when credit has dried up because banks will not lend to each other (out of the fear of counterparty default). It is a last resort when simply lowering interest rates is unlikely to achieve the necessary result. It was the Fed’s weapon of choice to combat the credit crunch that occurred during the Great Financial Crisis in 2008. It involves the Fed printing more Dollars and using them to buy US government bonds predominantly from financial institutions. QE usually leads to a weaker US Dollar.What is Quantitative Tightening and how does it influence the US Dollar?
Quantitative tightening (QT) is the reverse process whereby the Federal Reserve stops buying bonds from financial institutions and does not reinvest the principal from the bonds it holds maturing in new purchases. It is usually positive for the US Dollar.
-
15:59
Fed Preview: Forecasts from 14 major banks, preserving the option of hiking once more
The US Federal Reserve will announce its Interest Rate Decision on Wednesday, November 1 at 18:00 GMT and as we get closer to the release time, here are the expectations as forecast by analysts and researchers of 14 major banks.
The Fed is set to leave rates unchanged for a second consecutive meeting but Fed Chair Jerome Powell is expected to keep door open to more hikes. Update macro forecasts and Dot Plots will not come until the December meeting.
Danske Bank
We expect the Fed to remain on hold in the November meeting, in line with consensus and market pricing. As financial conditions have tightened significantly, we doubt the Fed will opt for hikes at a later stage either. Rise in term premium suggests higher yields are driven by other factors than the Fed’s forward guidance, which could spark more cautious tone from Powell.
ANZ
We expect the FOMC to leave rates on hold and that its attention in coming months will evolve to focus on how long rates will need to stay at peak levels. We are of the view that recent developments in core inflation and the labour market support our analysis that rates have peaked. However, the risk that growth momentum remains strong in coming months is a wild card that needs to be acknowledged. We therefore remain focused on incoming economic data.
Commerzbank
The Fed is likely to leave the target range for the fed funds at 5.25%-5.50%. Only if the recent very high pace of growth does not weaken is a further rate hike to be expected – but not before December at the earliest.
Nordea
Fed meeting will likely be a rather uneventful event. The Fed will keep rates unchanged at 5.25% to 5.5%. With no new forecasts, Powell’s press conference will be most important for investors. We don’t think the Fed has been convinced that a new hike is needed still, even with strong macro data from the US over the last week. That does not mean that rate cuts are on the horizon either. The Fed will still put emphasis on upside risks for inflation and for the need for high rates for longer.
ING
We don’t expect any change to policy rates after the recent spike in Treasury yields prompted a tightening of financial conditions throughout the economy. The market seems to be doing the heavy lifting, so there isn't any need for the Fed to do much more – despite growth and the jobs market remaining hot and inflation still well above target. Fed Chair Jerome Powell has also acknowledged that long and variable lags between the implementation of rate hikes and the real-world impact point to the possibility that the full impact of policy tightening could still be yet to take full effect.
Deutsche Bank
We expect the Fed to stay on hold and see future hikes as a function of financial conditions and the path of the economy. While our baseline is for rates to stay at 5.3% through year-end, we see an increasing risk of a hike in December or Q1.
TDS
The FOMC is widely expected to extend a pause to rate increases again, keeping the Fed funds target range unchanged at 5.25%-5.50% for a second consecutive meeting. We expect the Fed to maintain its broadly hawkish policy tilt as it stays consistent with its signaling of an additional rate increase through the dot plot. However, the Fed will reiterate that it aims to ‘proceed carefully’ as it formulates the next policy steps.
Rabobank
We expect the FOMC to remain on hold, stress its data dependence and intention to proceed carefully. During the press conference, we expect Powell to keep the door open to a rate hike in December. However, for the remainder of the year, we expect the bond market to do the Fed’s work, making further policy rate hikes redundant. Meanwhile, the focus of the FOMC may be shifting from how high to raise the policy rate to how long to hold the policy rate at restrictive levels.
NBF
The FOMC is poised to leave the target range for the federal funds rate unchanged at 5.25% to 5.50%. Chair Powell has said that policymakers can proceed carefully ‘given the uncertainties and risks, and how far we have come’. Moreover, a number of FOMC participants have suggested the run-up in longer-term interest rates might substitute for additional policy rate increases.
RBC Economics
The Fed is widely expected to hold interest rates unchanged again in October after skipping a hike in September. US economic growth numbers have remained exceptionally resilient, but inflation pressures moderated over the summer and that is allowing the Fed room to be patient as they wait for already high interest rates to slow growth with a lag.
SocGen
Inflation has fallen back from its highs, but core inflation of just under 4% remains well above target. We see a need for the Fed to remain on hold. We see the prevailing FFR of 5.25-5.50% as appropriately restrictive given current inflation and growth, but the rate becomes increasingly restrictive if inflation subsides as expected. Fed officials have signalled they want additional information on how the economy has responded to yield increases before taking additional steps. We expect that by early next year, inflation pressures can subside and growth moderate to paces that allow the Fed to stay on hold. Rate cuts are our view of the next fed funds rate change, but employment weakness, which we expect near mid-2024, needs to be the trigger for such action.
BMO
We look for no change in Fed policy. A prolonged pause could be unfolding, but it’s still premature to rule out another rate hike on December 13 or at the end of January. We’re expecting the economic indicators to weaken meaningfully in the month or two ahead, sufficient to forestall further rate rises. Amid the lagged impact of policy rate hikes along with dwindling excess savings and tightening credit conditions, we reckon the headwinds from higher bond yields, the resumption of student loan payments and the autoworkers’ strike should do the trick. Then there are the risks posed by a potential government shutdown (after November 17) and a potential spike in oil prices owing to geopolitical developments. However, our expectation for the indicators could turn out to be incorrect; and if it is, so too will be our call for the current fed funds target range (5.25%-to-5.50%) marking the rate apex this tightening cycle.
Citi
We expect the Fed not to hike. However, given strong economic data and stronger September core CPI and PCE prints the Fed and Chair Powell will likely want to keep optionality in their language. It would also not be surprising were the Fed to add some language on determining how long to keep policy rates at restrictive levels. Chair Powell will once again try to walk a tightrope during the press conference emphasizing that at this juncture the FOMC ought to move cautiously in coming meetings. He will likely explicitly link caution in proceeding with rate hikes to the rapid rise of longer-term yields, as he did in a recent speech. He may also recognize that the resiliency of the economy so far and remaining upside risks to inflation likely imply that the policy rate needs to stay elevated for some time.
Wells Fargo
We expect the FOMC to leave the target range for the FFR unchanged at 5.25%-5.50%. While inflation is moving back toward the FOMC's 2% target, there is further progress to be made. We believe the FOMC will want to keep its options open for further tightening, and thus think the post-meeting statement will maintain the language that signals some additional policy tightening may be appropriate. We continue to anticipate the terminal rate of this cycle has been reached, though we acknowledge it is possible the FOMC will hike rates an additional 25 bps before the end of the year.
-
15:51
The bar is higher for the Fed to actually move the market – TDS
The focus this week turns to the Fed. Economists at TD Securities see the bar rising for the Fed to generate a hawkish market reaction.
Fed to deliver more of the same
We expect the Fed to maintain a tightening bias, likely aiming to show the market that policy could be tightened further if needed.
The market is trying to unpack the nuances between the Fed’s rhetoric, data trends and surprises, and the aggressive tightening of financial conditions. There is a bit of a tug and war between these indicators, especially as some of the recent sell-off in longer-dated USTs doesn’t jibe with the data, Fed repricing or macro setup. Instead, it likely reflects a mismatch of supply and demand. That’s not fundamentally supportive of the USD, especially if breaks the growth cycle.
While we expect the Fed to deliver more of the same, it’s unclear how much further gains the USD will achieve unless the Fed appears more willing to open the door to more hikes.
-
15:34
Gold Price Forecast: XAU/USD’s upswing may not continue – Commerzbank
Gold price exceeded the $2,000 mark again for the first time in five months and a half on Friday. Economists at Commerzbank analyze the yellow metal’s outlook.
Gold to lose momentum if the tailwind lent by buying by speculative investors abates
The increase in the Gold price is likely to lose momentum if the tailwind lent by buying by speculative investors abates. Furthermore, it is possible that the Fed might have to raise its key rate again after all, contrary to what the market currently expects.
The US economy saw third-quarter growth of nearly 5% in annualised terms – the strongest growth rate in seven quarters. At the press conference following the Fed meeting, Fed Chair Powell will probably leave the door open to another rate hike in December. What is more, it remains to be seen whether Friday’s data will indicate the cooling that is hoped for in the US labour market. If this fails to materialise yet again, a Fed rate hike in December could become more likely again.
It is true that interest rate expectations have had less of an influence on the Gold price of late, but that doesn’t necessarily mean that this will continue to apply in the coming weeks.
We would warn against assuming that the upswing in Gold that we have seen in recent weeks will simply continue, as it has been due to exceptional circumstances.
-
15:32
United States 52-Week Bill Auction declined to 5.135% from previous 5.185%
-
15:22
USD/JPY: A reversal of widening yield differentials with the US should support the Yen – Standard Chartered
The Bank of Japan (BoJ) tweaked its yield curve control policy (YCC). USD/JPY rallied after the BoJ’s policy announcement. Economists at Standard Chartered analyze Yen’s outlook.
Bout of JPY weakness between now and the next meeting in December should be fleeting
The likely bout of JPY weakness between now and the next meeting in December should be fleeting, especially if the authorities formalise the removal of YCC by then and start contemplating the end of NIRP in 2024. Said differently, a reversal of widening yield differentials with the US should support the JPY, although timing it remains tricky.
The BoJ’s forecasts paint a more nuanced picture for the economy. While it lifted growth and core-core inflation forecasts for FY23, it downgraded its FY24 growth forecast to 1% (July estimate: 1.2%) and raised the core-core forecast marginally to 1.9% (1.7%). That the core-core inflation forecast is just shy of 2% suggests that the BoJ needs a tad more convincing of progress on ending the multi-decade deflationary woes.
Going forward, we would watch for verbal messaging from the BoJ on growth and inflation prospects as a prelude to further policy normalisation down the line.
-
15:09
EUR/USD: Fundamental factors suggest that the Euro’s tenacity will be brief – Rabobank
EUR/USD has pushed higher this week. Economists at Rabobank analyze the pair’s outlook.
EUR/USD seen at 1.02 on a three-month view
Since fundamentals do not appear to justify the current buoyancy of the EUR, we expect that it is a function of position adjustment related to the strong sell-off in EUR/USD in recent months.
The current shake out in EUR/USD may be necessary but, in view of the softness of German economic numbers, we expect another move lower in the EUR on a three-month view.
We maintain a three-month forecast of EUR/USD 1.02.
-
15:05
Colombia National Jobless Rate in line with expectations (9.3%) in September
-
14:59
The earnings rebound may take time to revive the fortunes of the equity market – UBS
US earnings revival looks unlikely to lead to equity rebound yet, economists at UBS report.
Earnings are set to return to growth
The percentage of companies beating earnings estimates is in line with historical averages (around 73%), and earnings are beating forecasts, in aggregate, by nearly 8%. We continue to expect S&P 500 EPS growth of 3-4% in the third quarter.
Our 2023 and 2024 S&P 500 earnings per share estimates are $220 (0% year-over-year growth) and $240 (9% YoY growth), respectively.
The earnings rebound may take time to revive the fortunes of the equity market, especially against a backdrop of elevated valuations. Rising yields have caused a further deterioration in the equity risk premium – making stocks look less attractive relative to high quality fixed income.
We still expect the improving outlook for earnings to boost stocks over the coming year, with our base case for the S&P 500 to reach 4,700 by the end of 2024.
-
14:46
EUR/USD: The growth/inflation mix is a key headache for the Euro – HSBC
The Euro could face the double whammy of stagflation fears against a “safe-haven” USD over the near term, economists at HSBC report.
Not all fundamentals are against the EUR
The main headache for the EUR is the unpleasant growth/inflation mix, that the Eurozone economy faces.
The Eurozone activity data disappointments continue to mount, while US activity data still surprise on the upside. We think that stagflation fears in the Eurozone vs growth resilience in the US would probably point to lower EUR/USD over the near term.
If geopolitical tensions rise further in the Middle East, the EUR could also face downward pressure against a ‘safe-haven’ USD.
On a positive note, the EUR’s structural allure is supported by the improvement in the Eurozone’s current account, together with supportive financial flows, compared to the US’s sizeable twin deficits.
-
14:34
USD/CAD approaches 1.3900 as investors turn cautious ahead of Fed policy
- USD/CAD advances toward 1.3900 amid caution ahead of Fed policy.
- Fed policymakers believe that higher US Treasury yields are slowing overall spending and investment.
- BoC Macklem said that the central bank is prepared to raise rates if necessary.
The USD/CAD pair marches swiftly towards the round-level resistance of 1.3900 in the early New York session. The Loonie asset strengthens as investors have turned cautious ahead of the interest rate decision by the Federal Reserve (Fed), which will be announced on Wednesday.
The S&P500 opened with some losses amid anxiety among investors ahead of the Fed policy. The US Dollar Index (DXY) recovers strongly after discovering buying interest near 106.00 on expectations that the Fed will advocate for keeping interest rates higher for a longer period. An unchanged interest rate decision from the Fed is widely anticipated due to higher long-term bond yields.
Fed policymakers believe that higher US Treasury yields would perform the central bank’ job of slowing spending and investment effectively. The US Bureau of Economic Analysis (BEA) reported last week that business investment contracted for the first time in the Q3 of 2023 since Covid-era as firms postponed their expansion plans to avoid higher borrowing rates.
Apart from the Fed policy, investors will keenly watch private payrolls and the ISM Manufacturing PMI data for October. As per the estimates, 150K fresh private jobs were added against 89K added in September. The Manufacturing PMI is seen steady at 49.0, below the 50.0 threshold for the 12th month in a row.
On the Canadian Dollar front, Bank of Canada (BoC) Governor Tiff Macklem emphasized on protecting Canada’s good fiscal position in his speech on Monday. Macklem further added the central continues to assess whether monetary policy is sufficiently restrictive and is ready to do whatever is required to restore price stability.
-
14:33
New Zealand: More robust than expected labour market to benefit the NZD – Commerzbank
The New Zealand labour market report for the third quarter is due at 21:45 GMT. Economists at Commerzbank analyze Kiwi’s outlook ahead of employment data.
Will New Zealand's labour market remain robust?
If the labour market weakens more than expected, this should confirm the NZD sceptics. After all, the interest rate hikes are then slowly taking effect, but inflation remains (still) clearly too high. Add in concerns about the Chinese economy and things don't look so good for the New Zealand Dollar.
However, if the labour market proves to be somewhat more robust than expected – as in recent quarters – the RBNZ would certainly have more scope for further tightening. This in turn should benefit the NZD.
-
14:26
EUR/USD Price Analysis: Immediately to the upside aligns 1.0700
- EUR/USD advances further and retests the 1.0670/75 band.
- Further gains could see the 1.0700 region revisited in the near term.
EUR/USD comes under some pressure soon after hitting multi-day highs around 1.0675 on Tuesday, a region where the interim 55-day SMA also sits.
In case bulls push harder, the pair should meet the next hurdle at the monthly high of 1.0694 (October 24), which comes just ahead of the round level of 1.0700 and prior to the weekly peaks of 1.0736 (September 20) and 1.0767 (September 12).
In the meantime, while below the 200-day SMA at 1.0809, the pair’s outlook should remain negative.
EUR/USD daily chart
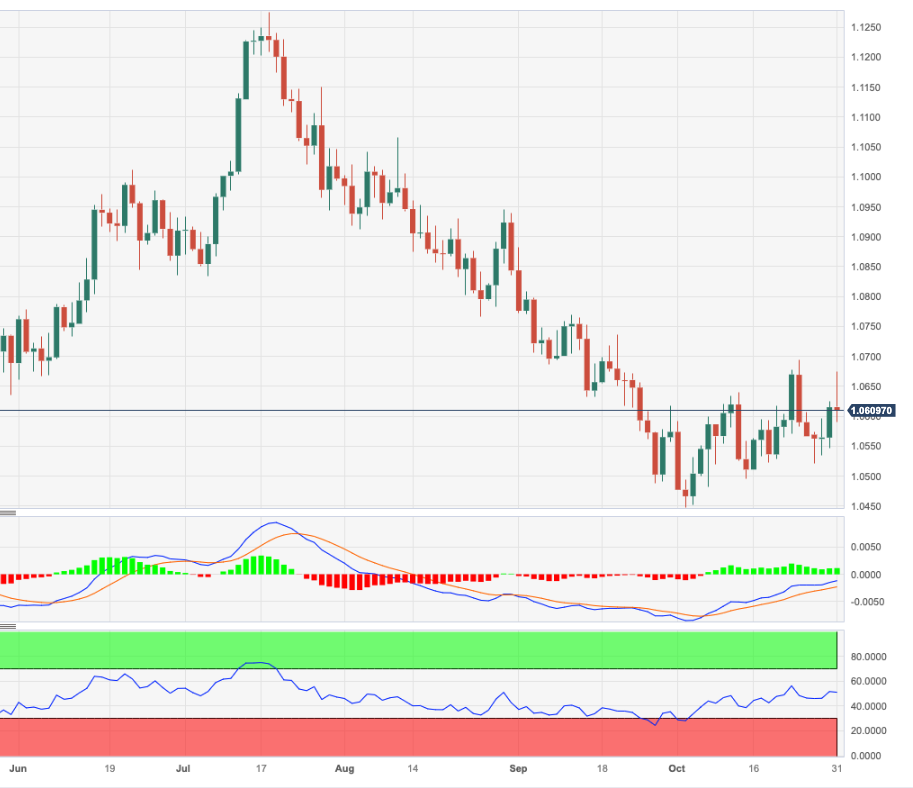
-
14:17
Fed Preview: Three scenarios and their implications for BDXY – TDS
Economists at TD Securities discuss the Federal Reserve Interest Rate Decision and its implications for the Bloomberg Dollar Spot Index.
More hawkish (20%)
Fed delivers a pause while also strongly hinting at the possibility of an additional rate increase before year-end. Chair Jerome Powell emphasizes the strong rebound in output in Q3, while also downplaying the upcoming shocks to the economy in Q4, judging them as temporary. BDXY +0.20%.
Base case (70%)
Fed delivers another hawkish pause after staying on hold in September, with the Committee leaving the door open for an additional rate increase. That said, the FOMC will repeat that it aims to ‘proceed carefully’ as it formulates the next steps for policy, also highlighting its increased data dependence. We expect Chair Powell to underscore that while macro data since the Sep meeting has turned out unambiguously firm, the Fed can afford to be patient as it gathers more data. BDXY +0.10%.
Dovish (10%)
Fed pauses but signals less need for further rate hikes given the recent tightening of financial conditions (and downplays the Sep dot plot). Powell mentions that the best course is to be patient given the totality of policy tightening still in the pipeline, the ongoing reduction of credit supply, and the upcoming shocks that will dent output in Q4. BDXY -0.50%.
-
14:04
US CB Consumer Confidence Index declines to 102.6 in October
- US CB Consumer Confidence Index continued to decline in October.
- US Dollar Index extends daily rebound beyond 106.50.
Consumer sentiment in the US continued to weaken in October, with the Conference Board's Consumer Confidence Index declining to 102.6 from 104.3 in September (revised from 103).
Further details of the publication revealed that the Present Situation Index edged lower to 143.1 from 146.2 and the Consumer Expectations Index fell to 75.6 from 76.4.
Finally, the one-year consumer inflation rate expectation stood at 5.9%.
Market reaction
The US Dollar Index extended its daily rebound after this report and was last seen rising 0.4% on the day at 106.55.
-
14:02
USD/MXN: The hurdle at 18.48/18.60 must be overcome to denote a larger uptrend – SocGen
USD/MXN can see a pullback after approaching trend line near 18.48/18.60, economists at Société Générale report.
Short-term pullback
USD/MXN has experienced a steady rebound after forming a trough near 16.60 earlier this year. It recently overcame the 200-DMA and approached the trend line drawn in November 2021 at 18.48/18.60.
Daily MACD has turned flat and has dipped below its trigger line denoting receding upward momentum.
The hurdle at 18.48/18.60 must be overcome to denote a larger uptrend.
A short-term pullback can’t be ruled out; the MA near 17.70 is likely to be first layer of support.
-
13:45
United States Chicago Purchasing Managers' Index registered at 44, below expectations (45) in October
-
13:40
A Trump-Biden rematch is highly likely in November 2024 presidential election – Standard Chartered
Back to 2020? The presidential election (along with congressional elections) will take place on Tuesday, 5 November 2024. A Trump-Biden rematch seems to be on the cards, strategists at Standard Chartered report.
Electoral College math again plays a crucial role
Next year’s presidential election looks highly likely to be a repeat of the BidenTrump match-up of 2020. Polls show another very tight contest and are inconclusive on who currently has the advantage.
Electoral College math, centred on a few swing states, is again set to play a crucial role in determining the next president. Biden would likely need to have a strong advantage in the popular vote to win the Electoral College.
State-level polls should start to give a clearer picture after the ‘Super Tuesday’ primaries on 5 March.
-
13:18
US Housing Price Index rises 0.6% in August
- House prices in the US continued to rise in August.
- US Dollar Index clings to modest gains below 106.50.
House prices in the US rose by 0.6% on a monthly basis in August, the monthly data published by the US Federal Housing Finance Agency showed on Tuesday. This reading followed the 0.8% increase posted in July.
Meanwhile, the S&P/Case-Shiller Home Price Index increased by 2.2% on a yearly basis in August, at a stronger pace than the 0.2% rise recorded in July.
Market reaction
The US Dollar Index showed no immediate reaction to these data and was last seen trading modestly higher on the day at 106.40.
-
13:15
EUR/USD: Failure to reclaim 50-DMA at 1.0660 could mean persistence in decline – SocGen
EUR/USD advances for third day. Economists at Société Générale analyze the pair’s outlook.
Crossover beyond 1.0660 essential to affirm broader bounce
EUR/USD crossed above the upper band of descending channel since July however it has struggled to reclaim the 50-DMA near 1.0700/1.0735 (now at 1.0660) and has started retracting recent gains.
It would be interesting to see if the pair can carve out a higher trough as compared to the one formed earlier this month near 1.0448 and reclaim 50-DMA near 1.0660. Failure could mean persistence in decline towards 1.0400, the 50% retracement from September 2022 and 1.0305.
-
13:03
GBP/USD: Daily close above 1.2180 would add to momentum for deeper push above 1.22 – Scotiabank
GBP/USD trades firmer near 1.22. Economists at Scotiabank analyze Sterling’s outlook.
EUR/GBP gains above 0.87 suggest a new, higher trading range between 0.87 and 0.89
Sterling is firm but GBP/USD gains are struggling against 1.22, trend resistance off the July high. The market pushed through this trend briefly earlier in October but needs to make clearer progress above the figure to extend.
A daily close above 1.2180 (21-DMA) would be a modest positive and add to momentum for deeper push above 1.22 towards the 40-DMA at 1.2254 currently.
EUR/GBP gains above 0.87 are slowly developing and suggest a new, higher trading range for the cross between 0.87 as the base and 0.89 as a medium-term bull target over the next three-six months.
-
13:00
United States Housing Price Index (MoM) down to 0.6% in August from previous 0.8%
-
13:00
United States S&P/Case-Shiller Home Price Indices (YoY) came in at 2.2%, above forecasts (1.6%) in August
-
12:55
United States Redbook Index (YoY): 5.3% (October 27) vs 5%
-
12:49
USD Index Price Analysis: No changes to the range bound trade
- DXY comes under further downside pressure and confronts 106.00.
- The lower end of the range appears near 105.40.
DXY drops for the third session in a row and puts the 106.00 support to the test on Tuesday.So far, extra side-lined trade looks the most likely scenario for the index for the time being. The breakout of this theme exposes a potential move to the weekly top at 106.89 (October 26), prior to the round level at 107.00 and just ahead of the 2023 high of 107.34 (October 3).
Further weakness, on the other hand, could leave the index vulnerable to a probable drop to the October low of 105.36 (October 24).
So far, while above the key 200-day SMA, today at 103.43, the outlook for the index is expected to remain constructive.
DXY daily chart
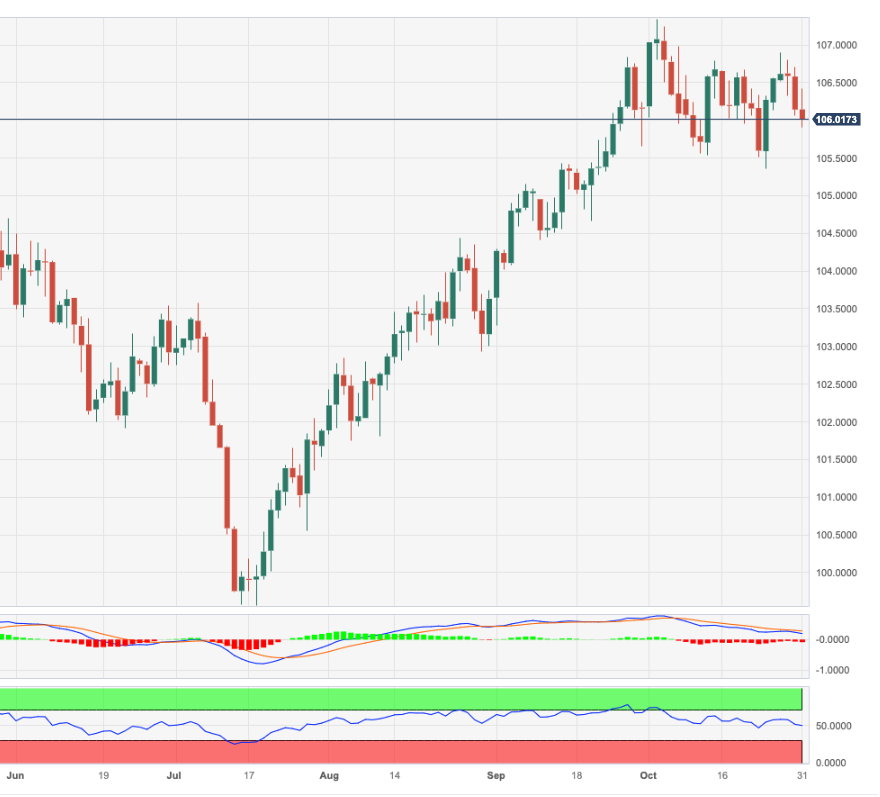
-
12:40
USD/CAD: Losses appear reluctant to extend much below 1.3810/1.3820 – Scotiabank
USD/CAD holds in low 1.38s. Economists at Scotiabank analyze the pair’s outlook.
Loonie needs to regain 1.3780/1.3785 to challenge the base of the USD’s short-term bull channel
The basics of the intraday and daily chart – trend and trend momentum – are still aligned bullishly for the USD.
The CAD needs to regain 1.3780/1.3785 to challenge the base of the USD’s short-term bull channel but USD losses appear reluctant to extend much below 1.3810/1.3820 so far in the session.
Resistance is 1.3855 and 1.3880.
-
12:30
Canada Gross Domestic Product (MoM) registered at 0%, below expectations (0.1%) in August
-
12:30
United States Employment Cost Index came in at 1.1%, above forecasts (1%) in 3Q
-
12:26
Japanese Yen drops over 1% after BoJ meeting
- Japanese Yen weakens substantially following the Bank of Japan meeting early on Tuesday.
- The Yen returns to last week’s lows after Governor Ueda played down inflationary effects.
- USD/JPY returns to the 150s on the news.
The Japanese Yen (JPY) is bleeding lower on Tuesday in the wake of the Bank of Japan (BoJ) policy meeting. The currency came under heavy pressure after Bank of Japan president Katsuo Ueda said inflation had mainly been caused by rising commodity prices, not secondary “demand-driven” factors. His remarks suggested the bank would retain an easy monetary policy as inflation had not become embedded enough to require tightening.
The BoJ did nonetheless take the step of loosening its Yield Curve Control (YCC) mechanism – a move normally interpreted as hawkish. The YCC keeps the yield on the 10-year Japanese Government Bond (JGB) between 0.0% and 1.0%. On Tuesday, the BoJ redefined the ceiling as a “loose upper bound” rather than a “rigid cap”. The yield on the 10-year JGB is currently at 0.947%, having risen 0.055% due to the news.
Daily digest market movers: Yen falls after Ueda plays down inflationary risks
- The Yen declines despite the BoJ deciding to tweak its YCC to allow greater flexibility.
- The BoJ raises its inflation forecast to 2.8% in 2023, the same in 2024 and only a reduction to 1.7% in 2025.
- The bank’s previous forecast had been for 2.5% inflation in 2023, 1.9% in 2024 and 1.6% in 2025.
- Despite upgrading its inflation expectations, the BoJ stressed price increases were more due to higher input costs and rising Oil prices rather than increased demand. This may explain why the Yen weakened rather than rose on the announcement.
- The Fed’s November 1 policy meeting will be another key event for USD/JPY. The Fed is unlikely to change interest rates – there is now zero chance of a raise and only a 1.8% chance of a rate cut of 0.25%, according to the CME Fedwatch tool, which uses Fed Funds Futures as a gauge of market expectations.
- Investor’s focus is instead likely to be on what Federal Reserve Chairman Jerome Powell says in his press conference after the delivery of the official announcement.
- If Powell emphasizes the likelihood that the policy rate could rise in the future or remain ‘higher for longer’ the market may buy the US Dollar, pushing USD/JPY back up.
- If he emphasizes peak rate has been reached and the Fed is unlikely to raise at all during this cycle, then the opposite may be the case.
- Inflation pressures may be easing more than the data reflects, according to Stephen Schwarzman, the CEO and co-founder of investment fund Blackstone, who argues he has seen input costs in the companies in his portfolio increase 0% in Q3. This runs counter to the ‘hot inflation' argument propounded by some in the market.
- Schwarzman added companies are making more profits off lower sales for lower base costs.
- He added that “A third of CPI is shelter. A year ago, that was running at 12-13%, now it’s 1% – but the Fed averages the numbers so it isn’t showing yet…Inflation is actually lower than the numbers are saying.”
Japanese Yen technical analysis: Decline reaches key trendline
USD/JPY executes an astounding volte-face and returns to its 12-month highs in the 150.70s, where it trades at the time of writing.
The bias remains to the upside, with the next major target at the 152.00 highs achieved in October 2022. A re-break above last Thursday’s highs of 150.80 would provide fresh confirmation of a continued advance.
-638343516842120322.png)
US Dollar vs Japanese Yen: Daily Chart
Despite strong indications of a bearish technical reversal of the short-term trend and channel breakout on the 4-hour chart, just prior to the BoJ meeting, USD/JPY pivoted sharply and rose back up into its channel as a short-squeeze propelled prices higher.
-638343517339754343.png)
US Dollar vs Japanese Yen: 4-hour Chart
The Moving Average Convergence Divergence (MACD) indicator on the 4-hour chart crossed its signal line whilst below the zero line, giving a buy signal in line with the broader uptrend. This was a sign the recovery was underway.
The medium-term and primary trends remain bullish, suggesting the odds favor higher highs and a continuation upwards.
Japanese Yen FAQs
What key factors drive the Japanese Yen?
The Japanese Yen (JPY) is one of the world’s most traded currencies. Its value is broadly determined by the performance of the Japanese economy, but more specifically by the Bank of Japan’s policy, the differential between Japanese and US bond yields, or risk sentiment among traders, among other factors.
How do the decisions of the Bank of Japan impact the Japanese Yen?
One of the Bank of Japan’s mandates is currency control, so its moves are key for the Yen. The BoJ has directly intervened in currency markets sometimes, generally to lower the value of the Yen, although it refrains from doing it often due to political concerns of its main trading partners. The current BoJ ultra-loose monetary policy, based on massive stimulus to the economy, has caused the Yen to depreciate against its main currency peers. This process has exacerbated more recently due to an increasing policy divergence between the Bank of Japan and other main central banks, which have opted to increase interest rates sharply to fight decades-high levels of inflation.
How does the differential between Japanese and US bond yields impact the Japanese Yen?
The BoJ’s stance of sticking to ultra-loose monetary policy has led to a widening policy divergence with other central banks, particularly with the US Federal Reserve. This supports a widening of the differential between the 10-year US and Japanese bonds, which favors the US Dollar against the Japanese Yen.
How does broader risk sentiment impact the Japanese Yen?
The Japanese Yen is often seen as a safe-haven investment. This means that in times of market stress, investors are more likely to put their money in the Japanese currency due to its supposed reliability and stability. Turbulent times are likely to strengthen the Yen’s value against other currencies seen as more risky to invest in.
-
12:20
Silver tends to perform less well than Gold at times of increased risk aversion – Commerzbank
Silver has been underperforming Gold in the past three weeks. Economists at Commerzbank analyze the precious metal’s outlook.
Silver is not profiting from the demand for safe havens to the same extent as Gold
Clearly Silver is not profiting from the demand for safe havens to the same extent as Gold.
Like Gold, Silver has also seen speculative market positioning switch from net short to net long in the last two reporting weeks, yet the swing was noticeably less pronounced.
Silver is a precious metal that is widely used in industrial applications. Industrial use accounts for somewhat more than 50% of total Silver demand. As a result, the Silver price tends to perform less well than the Gold price at times of increased risk aversion and associated economic concerns.
-
12:11
EUR/JPY Price Analysis: Next on the upside comes 170.00
- EUR/JPY jumps to new 2023 highs past 160.00.
- The next hurdle of note comes at the 2008 high near 170.00.
EUR/JPY jumps to new YTD peaks well north of the 160.00 hurdle on Tuesday, an area last traded in late August 2008.
Further upside appears well on the cards for the cross in the short-term horizon. Against that, the surpass of the 2023 high of 160.84 (October 31) should face the next significant resistance level not before the 2008 top of 169.96 (July 23)
So far, the longer term positive outlook for the cross appears favoured while above the 200-day SMA, today at 151.35.
EUR/JPY daily chart
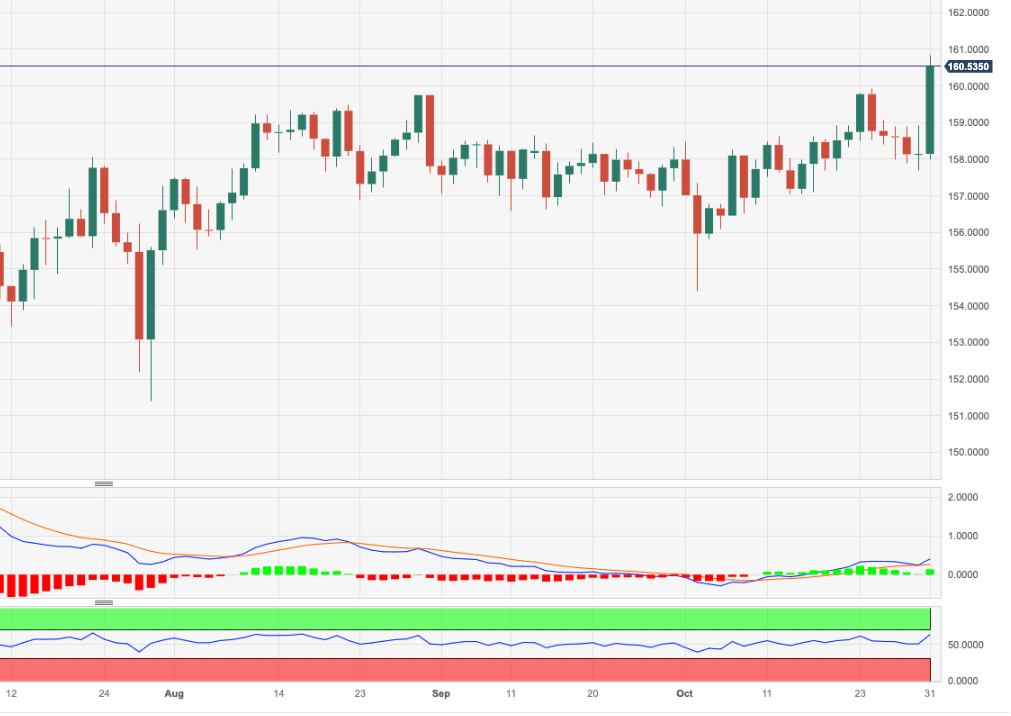
-
12:09
EUR/USD: A push above 1.07 should bolster the Euro’s undertone a little more – Scotiabank
EUR/USD pushes higher to upper 1.06s. Economists at Scotiabank analyze the pair’s outlook.
Short-term trend dynamics are tilting a bit more EUR-bullish
Short-term trend dynamics are tilting a bit more EUR-bullish.
EUR/USD gains are closing on the 1.07 level again and a push above the figure should bolster the EUR’s undertone a little more for a push on to the 1.0750 range in the short run.
Support is 1.0600/1.0620.
See – EUR/USD: Breaking below the bottom of this year’s 1.05-1.10 range will be a tough nut to crack – MUFG
-
12:01
Chile Industrial Production (YoY): 1.5% (September) vs 0.3%
-
12:00
Chile Unemployment rate came in at 8.9% below forecasts (9.1%) in September
-
12:00
South Africa Trade Balance (in Rands) above forecasts (12B) in September: Actual (13.14B)
-
12:00
Brazil Unemployment Rate in line with expectations (7.7%) in September
-
11:52
EUR/USD: Breaking below the bottom of this year’s 1.05-1.10 range will be a tough nut to crack – MUFG
The recent resilient performance of the Euro has continued at the start of this week with EUR/USD rising back above the 1.0600 level. Economists at MUFG Bank analyze the pair’s outlook.
One potential trigger for a break below the bottom of the range would be if the conflict in the Middle East broadened out
The price action highlights that breaking below the bottom of this year’s tight trading range between 1.0500 and 1.1000 will be a tough nut to crack.
One potential trigger for EUR/USD to break below the bottom of the range and retest parity would be if the conflict in the Middle East broadened out, and triggered a sharper adjustment higher in energy prices that hurts European economies’ terms of terms. However, market participants remain comfortable to price in a more contained conflict.
-
11:38
BoJ: Another disappointment for JPY bulls – TDS
BoJ delivers yield curve control (YCC) tweak. Economists at TD Securities analyze Yen’s outlook after BoJ’s Monetary Policy Statement.
JPY's fate lies in the hands of the USD and yield differentials once again
The BoJ did tweak YCC by scraping the reference to the daily fixed rate buying operations, now viewing the 1% upper band not as a strict ceiling but as a reference point. Despite the tweak, the BoJ maintained the monthly purchase amount and frequency for Nov of its usual bond program.
On CPI ex fresh food, the BoJ upgraded its forecasts with the biggest upgrade to FY24; 2023 inflation at 2.8% (prior: 2.5%), 2024 at 2.8% (prior 1.9%) and 2025 at 1.7% (prior: 1.6%). There was no change to other policy settings and it maintained its forward guidance that it will ‘add to easing without hesitation if needed’.
At the press conference, Governor Ueda struck a dovish tone again, adding that he can't see inflation reaching target with certainty and that there's still some distance until positive cycle in prices is seen.
Today's meeting is another disappointment for JPY bulls and JPY's fate lies in the hands of the USD and yield differentials once again.
-
11:34
India Infrastructure Output (YoY): 8.1% (September) vs previous 12.1%
-
11:26
S&P 500 Index: Inability to cross 4200/4260 could mean persistence in downtrend – SocGen
The S&P 500 fell 2.5% last week. Economists at Société Générale analyze the index outlook.
Threat of deeper decline if 4200/4260 is not overcome
S&P 500 has recently broken below the lower limit of the channel since October 2022 and has also given up the 200-DMA. It has breached the graphical levels at 4200/4260.
The index is now probing the lower end of the descending channel drawn since August; an initial bounce is likely however the 200-DMA near 4200/4260 must be overcome to affirm a meaningful up move.
Inability to cross 4200/4260 could mean persistence in downtrend. Next potential supports are located at 4050 and projections of 3915.
-
11:08
EUR/JPY prints a fresh 15-year high near 161.00 on easy BoJ policy and weak Eurozone GDP
- EUR/JPY registers a fresh 15-year at 161.00 as Eurozone GDP contracts and inflation softened in October.
- The Eurozone economy contracted by 0.1% in Q3 against a stagnant performance.
- The BoJ maintained a dovish stance but widened bond yields.
The EUR/JPY pair capitalizes on the expansionary monetary policy stance of the Bank of Japan (BoJ) and the Eurozone data. The cross extended gains to near 161.00 after the Eurostat reported that the preliminary Harmonized Index of Consumer Prices (HICP) for October softened more than expected.
Monthly headline inflation grew nominally by 0.1% against 0.3% growth in September. The annual headline HICP softened significantly to 2.9% against expectations of 3.1% and the former release of 4.3%. The energy prices in the trading bloc softened by more than 11%, compared with a 4.6% decline in September.
The monthly core HICP that doesn’t include food and energy prices grew at a steady pace of 0.2%. Annually, the core HICP dropped 4.2% YoY in October, compared with September’s 4.5% uptick. The market consensus was for 4.2% acceleration.
On the GDP front, the Eurozone economy registered a de-growth of 0.1% in the July-September quarter against 0.1% growth in the Q2 of 2023. Investors forecasted a stagnant performance amid a deteriorating demand environment due to the inability of the economy to absorb the consequences of higher interest rates by the European Central Bank (ECB).
The Japanese Yen witnessed a sharp fall as the Bank of Japan (BoJ) kept interest rates unchanged negatively at 0.1%. However, the BoJ tweaked its Yield Curve Control (YCC) by redefining 1.0% as an "upper bound" in order to provide more room for flexibility. BoJ Ueda commented that an improvement in the YCC flexibility was appropriate. The BoJ is expected to keep monetary policy easy for longer to ensure inflation above 2% should be supported by decent wage growth.
-
11:04
Eurozone: Another modest decline in GDP in Q4 followed by a slow recovery – Rabobank
In the third quarter, the Eurozone economy contracted by 0.1% compared to the second quarter. Economists at Rabobank expect that the Eurozone will enter a mild recession, followed by a period of sluggish growth.
The start of a recession?
The Eurozone economy contracted by 0.1% in the second quarter, with a wide variation among member states.
A sizeable share of companies still indicates that the tight labour market hinders their production. On balance, companies don’t expect their headcount to shrink soon.
We expect some loosening of the labour market going forward but don’t expect a steep rise in unemployment. This will put a floor under the economic contraction, especially since we expect real wages to rise soon, but will also continue to hinder activity in several sectors.
We expect another modest decline in GDP in Q4 followed by a slow recovery. The war in the Middle East is a clear downside risk to our outlook, however.
-
11:04
Italy Producer Price Index (YoY) down to -14.1% in September from previous -12.2%
-
11:04
Italy Producer Price Index (MoM) registered at 0.6% above expectations (0.3%) in September
-
10:56
EUR/USD seen navigating a broad 1.0450-1.0730 near term – UOB
UOB Group’s Markets Strategist Quek Ser Leang suggests EUR/USD could trade within the 1.0450-1.0730 range in the next couple of months.
Key Quotes
In early October, EUR/USD broke below 1.0515 and dropped to a low of 1.0447 before rebounding. The rebound took out both the declining trendline resistance and the 55-day exponential moving average. The breach of these strong resistance levels suggests that the weakness in EUR/USD from July has stabilised. However, it is too early to expect a sustained recovery. The current price movements are likely part of a consolidation phase, and EUR/USD is likely to trade in a range between 1.0450 and 1.0730 for the next couple of months.
Looking ahead, as long as EUR/USD does not break clearly above 1.0730, there is still a chance, albeit not a high one, for EUR/USD to dip below 1.0400 before the risk of a more sustained and pronounced recovery is likely. At this stage, EUR/USD does not appear to have enough momentum to break clearly below 1.0315.
-
10:52
EUR/USD can still move closer to parity – SocGen
The Eurozone economy shrinks slightly. However, the Euro is rising. Kit Juckes, Chief Global FX Strategist at Société Générale, analyzes EUR outlook.
Even the UK is doing a bit better than the Eurozone and Japan is catching up
Today’s release of Eurozone GDP data, and the (lack of) market reaction, may tell us something about how hard it is for the Euro to fall all that far from here.
Eurozone GDP fell by 0.1% in Q3, which leaves it up 0.1% compared to Q3 2022. The US Q3 GDP increase was 1.2%, QoQ, 2.9% YoY. Even the UK is, for now, doing a bit better than the Eurozone and Japan is catching up. That this news hasn’t hurt the Euro, however, is a reminder that a lack of growth is priced in already. That doesn’t mean the Euro is safe, however.
The risk is that we continue to see (as has been the case for the last few weeks) ECB cut expectations grow for mid-2023, while Fed expectations stick to the ‘high for longer’ mantra. That can still take EUR/USD closer to parity.
-
10:41
Germany 30-y Bond Auction: 3.04% vs 2.89%
-
10:40
EUR/GBP refreshes five-month high at 0.8750 on soft Eurozone inflation report
- EUR/GBP climbs to near 0.8750 as Eurozone inflation softened in October.
- The Eurozone economy reported de-growth by 0.1% in the Q3 GDP.
- A steady interest rate policy from the BoE is widely anticipated.
The EUR/GBP pair prints a fresh five-month high at 0.8750 as Eurozone headline inflation remained softer-than-anticipated in October. The Eurostat reported that the monthly preliminary headline Harmonized Index of Consumer Prices (HICP) grew marginally by 0.1% against a 0.3% acceleration in September.
Annual headline HICP decelerated significantly to 2.9% against expectations of 3.1% and 4.3% reading from September. The core HICP that excludes volatile oil and food prices grew at a steady pace of 0.2% on a monthly basis. The annual core HICP softened to 4.25 as expected from a 4.5% reading in September. Consistently easing consumer inflation would allow European Central Bank (ECB) policymakers to continue to deliver neutral interest rate guidance.
Apart from the inflation data, Eurostat reported that the trading bloc contracted by 0.1% in the July-September quarter while investors forecasted a stagnant performance. In the April-June quarter, the economy grew by 0.1%. The economic activities in the old continent remained weak as it is struggling to absorb the consequences of higher interest rates by the ECB.
On the Pound Sterling front, investors await the interest rate decision by the Bank of England (BoE), which will be announced on Thursday. In spite of the fact that the consumer inflation in the UK economy is highest among G7 economies, a steady interest rate decision is widely anticipated from BoE Governor Andrew Bailey.
The United Kingdom economy has been exposed to a recession due to weak labor demand, poor consumer spending and deepening Middle East tensions. More rate hikes from the BoE would deepen recession fears.
-
10:33
USD Index to continue trading in the middle of a 105.35-107.35 range – ING
The Dollar continues to trade on the firm side. Economists at ING analyze USD outlook.
Steady near the highs
For today, the US calendar contains the third-quarter Employment Cost Index (ECI). Consensus expects a modest 1.0% quarter-on-quarter. Any upside surprise would add to the Fed's current hawkish stance and the higher-for-longer narrative – a Dollar positive.
We will also see the Conference Board's measure of consumer confidence for October. This is expected to dip as presumably higher interest rates and the repaying of student loans start to weigh. Let's see whether investors want to laser-focus on consumer data since this community has driven the incredible third-quarter GDP figures.
Expect DXY to continue trading in the middle of a 105.35-107.35 range – with upside risks from the ECI data and downside risks from the confidence data.
-
10:32
India Federal Fiscal Deficit, INR increased to 7018.61B in September from previous 6428.26B
-
10:31
Italy 10-y Bond Auction dipped from previous 4.93% to 4.76%
-
10:31
Italy 5-y Bond Auction dipped from previous 4.41% to 4.12%
-
10:26
USD/CNH: Further side-lined trade remains on the table – UOB
USD/CNH is expected to keep the current consolidative mood for the time being, note Economist Lee Sue Ann and Markets Strategist Quek Ser at UOB Group.
Key Quotes
24-hour view: We expected USD to trade in a range between 7.3170 and 7.3380 yesterday. However, USD traded in a much narrower range of 7.3201/7.3318. The price action still appears to be consolidative. Today, we expect USD to trade in a range of 7.3150/7.3350.
Next 1-3 weeks: Our latest narrative was from last Thursday (26 Oct, spot at 7.3260), wherein the recent buildup in downward momentum has faded, and USD is likely to trade in a range between 7.3050 and 7.3470 the time being. There is on change in our view.
-
10:13
USD/JPY: Next hurdles located at 151.25 and last year high of 152/152.80 – SocGen
USD/JPY rebounds above 150. Economists at Société Générale analyze the pair’s outlook.
148.85 must be breached to affirm a short-term decline
It is worth noting that daily MACD has been posting negative divergence since July denoting receding upward momentum however, signals of price break have not yet developed.
The recent pivot low of 148.85 is a crucial support. This must be breached to affirm a short-term decline.
The next potential hurdles are located at projections of 151.25 and last year high of 152/152.80.
-
10:09
Gold price strives for a direction ahead of Fed policy, Israel’s ground assault in Gaza
- Gold price looks for a direction as the focus shifts to Fed policy.
- A no-change interest rate decision from the Fed is widely expected but with the possibility of further rate hikes ahead.
- The Israeli defense forces gradually in Gaza to demolish Hamas.
Gold price (XAU/USD) struggles for direction as market participants eye the interest rate decision by the Federal Reserve (Fed) and further developments in the Israel-Palestine war. The near-term demand for the precious metal is bullish as Middle East tensions are seen escalating further. The Israeli military troops are gradually entering Gaza for the ground assault to root out Hamas.
In addition to Middle East tensions, higher expectations of a steady monetary policy from the Fed on Wednesday are consistently supporting the Gold price. Fed policymakers have been supporting keeping interest rates unchanged in the range of 5.25-5.50% due to higher US long-term bond yields and consistently easing price pressures. The Fed is expected to advocate for keeping interest rates higher for a longer period as strong consumer spending and tight employment conditions could keep the inflation outlook stubborn.
Daily Digest Market Movers: Gold price consolidates ahead of Fed policy
- Gold price trades directionless below the psychological resistance of $2,000 as investors await further development on the Israel-Palestine war and the Fed’s monetary policy decision.
- The precious metal struggles to come out of the woods but a volatile action is widely anticipated after the announcement of the interest rate decision by the Fed on Wednesday.
- Investors hope that easing price pressures and higher US long-term bond yields would allow Fed policymakers to advocate a steady monetary policy decision.
- Fed Chair Jerome Powell and his colleagues are expected to keep doors open for further policy tightening as robust consumer spending and tight labor market conditions could make consumer inflation stubborn.
- 10-year US Treasury yields have eased to 4.84% ahead of the Fed policy announcement but are extremely high and significantly impacting financial conditions in the US economy.
- Cleveland Fed Bank President Loretta Mester said ahead of November's monetary policy that higher bond yields are equivalent to one interest rate hike of 25 basis points (bps). The Fed could use higher Treasury yields as a substitute for further policy tightening.
- The majority of Fed policymakers hope for a ‘soft landing’ from the Fed as price pressures are consistently easing and the US economy is resilient.
- The US Dollar Index (DXY) retreats from 106.40 (supporting Gold) ahead of the Fed’s monetary policy and crucial economic indicators such as private payrolls and the ISM Manufacturing PMI data for October.
- As per the estimates, 150K fresh private jobs were added against 89K added in September. The Manufacturing PMI is seen steady at 49.0, below the 50.0 threshold for the 12th month in a row.
- Investors should note that the survey done by S&P Global on private factories for October showed that private Manufacturing PMI met the 50.0 threshold. US firms remain optimistic that the Fed is done with hiking interest rates.
- The US manufacturing and service sector is recovering faster due to a strong growth outlook amid robust spending by households. Meanwhile, Goldman Sachs hiked their GDP growth projections for the fourth quarter of 2023 and the first quarter of 2024 to 1.6% and 1.7% respectively.
- The near-term appeal for the Gold price remains upbeat as Israeli defense forces (IDF) prepare for a ground assault in Gaza to dismantle Palestine military troops in retaliation for airstrikes from Hamas.
- The IDR moves gradually in Gaza to keep hopes of the release of more than 200 hostages alive.
- Meanwhile, the World Gold Council (WGC) reported that gold demand by Indian jewelers fell annually due to higher prices. The WGC said that global gold demand excluding over-the-counter (OTC) trading slipped 6% in the third quarter, Reuters reported. The WGC hopes that the Gold buying from central banks could reach a new record in 2023.
Technical Analysis: Gold price struck in a tight range below $2,000
Gold price trades in a limited range around $1,995 as investors await the Fed’s monetary policy. The precious metal delivered a time-corrective move after facing barricades near a five-month high of $2,009. The broader Gold price outlook remains bullish as the 20-day Exponential Moving Average (EMA) has delivered a bullish crossover above the 50 and 200-day EMAs. Momentum indicators oscillate in the bullish range, warranting more upside.
Gold FAQs
Why do people invest in Gold?
Gold has played a key role in human’s history as it has been widely used as a store of value and medium of exchange. Currently, apart from its shine and usage for jewelry, the precious metal is widely seen as a safe-haven asset, meaning that it is considered a good investment during turbulent times. Gold is also widely seen as a hedge against inflation and against depreciating currencies as it doesn’t rely on any specific issuer or government.
Who buys the most Gold?
Central banks are the biggest Gold holders. In their aim to support their currencies in turbulent times, central banks tend to diversify their reserves and buy Gold to improve the perceived strength of the economy and the currency. High Gold reserves can be a source of trust for a country’s solvency. Central banks added 1,136 tonnes of Gold worth around $70 billion to their reserves in 2022, according to data from the World Gold Council. This is the highest yearly purchase since records began. Central banks from emerging economies such as China, India and Turkey are quickly increasing their Gold reserves.
How is Gold correlated with other assets?
Gold has an inverse correlation with the US Dollar and US Treasuries, which are both major reserve and safe-haven assets. When the Dollar depreciates, Gold tends to rise, enabling investors and central banks to diversify their assets in turbulent times. Gold is also inversely correlated with risk assets. A rally in the stock market tends to weaken Gold price, while sell-offs in riskier markets tend to favor the precious metal.
What does the price of Gold depend on?
The price can move due to a wide range of factors. Geopolitical instability or fears of a deep recession can quickly make Gold price escalate due to its safe-haven status. As a yield-less asset, Gold tends to rise with lower interest rates, while higher cost of money usually weighs down on the yellow metal. Still, most moves depend on how the US Dollar (USD) behaves as the asset is priced in dollars (XAU/USD). A strong Dollar tends to keep the price of Gold controlled, whereas a weaker Dollar is likely to push Gold prices up.
-
10:04
Eurozone Preliminary GDP drops by 0.1% QoQ in Q3 vs. 0% expected
The Eurozone economy contracted by 0.1%, on a quarterly basis, in the three months to September of 2023, missing the 0% estimates and slowing down from the pace of 0.1% seen in the first quarter of 2023, the preliminary estimate released by Eurostat showed Tuesday.
The old continent’s GDP grew by an annual rate of 0.1% in Q3 vs. a 0.5% expansion in Q2 while meeting 0.2% expectations.
EUR/USD reaction to the Eurozone GDP data
EUR/USD was last seen trading at 1.0654, up 0.41% on the day. Disappointing Eurozone GDP and inflation data checked the Euro recovery against the US Dollar.
Euro price today
The table below shows the percentage change of Euro (EUR) against listed major currencies today. Euro was the weakest against the Pound Sterling.
USD EUR GBP CAD AUD JPY NZD CHF USD -0.37% -0.17% -0.09% 0.05% 1.05% -0.13% -0.05% EUR 0.36% 0.20% 0.31% 0.42% 1.45% 0.24% 0.33% GBP 0.17% -0.21% 0.11% 0.21% 1.21% 0.06% 0.13% CAD 0.08% -0.27% -0.09% 0.15% 1.14% -0.03% 0.05% AUD -0.07% -0.43% -0.21% -0.12% 0.99% -0.18% -0.11% JPY -1.06% -1.40% -1.21% -1.16% -0.99% -1.16% -1.09% NZD 0.13% -0.25% -0.05% 0.06% 0.16% 1.16% 0.06% CHF 0.03% -0.34% -0.13% -0.05% 0.07% 1.09% -0.09% The heat map shows percentage changes of major currencies against each other. The base currency is picked from the left column, while the quote currency is picked from the top row. For example, if you pick the Euro from the left column and move along the horizontal line to the Japanese Yen, the percentage change displayed in the box will represent EUR (base)/JPY (quote).
About Eurozone Preliminary GDP
The Gross Domestic Product released by Eurostat is a measure of the total value of all goods and services produced by the Eurozone. The GDP is considered as a broad measure of the Eurozone's economic activity and health. Usually, a rising trend has a positive effect on the EUR, while a falling trend is seen as negative (or bearish).
-
10:01
European Monetary Union Core Harmonized Index of Consumer Prices (MoM) unchanged at 0.2% in October
-
10:01
European Monetary Union Harmonized Index of Consumer Prices (MoM) declined to 0.1% in October from previous 0.3%
-
10:01
Breaking: Eurozone Preliminary HICP inflation declines to 2.9% YoY in October vs. 3.1% expected
The Eurozone Harmonised Index of Consumer Prices (HICP) rose at an annual pace of 2.9% in October, as against a 4.3% increase in September, the official data published by Eurostat showed on Tuesday. The HICP inflation print was anticipated at 3.1% in the reported period.
The Core HICP inflation dropped 4.2% YoY in October, compared with September’s 4.5% uptick. The market consensus was for a 4.2% acceleration.
On a monthly basis, the bloc’s HICP rose 0.1% in October vs. a 0.3% rise registered in September. The core HICP inflation came in at 0.2% in the reported month, rising at the same pace as seen in September.
The European Central Bank’s (ECB) inflation target is 2.0%.
The old continent’s HICP inflation data have a significant impact on the market’s pricing of the ECB policy outlook. Markets are currently wagering that the ECB is almost at the end of its tightening cycle.
Key details from the Eurozone inflation report (via Eurostat)
“Looking at the main components of euro area inflation, food, alcohol & tobacco is expected to have the highest annual rate in October (7.5%, compared with 8.8% in September), followed by services (4.6%, compared with 4.7% in September), non-energy industrial goods (3.5%, compared with 4.1% in September) and energy (-11.1%, compared with -4.6% in September).”
EUR/USD reaction to the Eurozone inflation report
The Euro is feeling the pull of gravity on softer Eurozone inflation data. EUR/USD is reversing from intraday highs of 1.0675 to trade at 1.0655, as of writing. The pair is still up 0.40% on the day.
Euro price today
The table below shows the percentage change of Euro (EUR) against listed major currencies today. Euro was the strongest against the Japanese Yen.
USD EUR GBP CAD AUD JPY NZD CHF USD -0.36% -0.16% -0.10% 0.03% 1.06% -0.15% -0.07% EUR 0.37% 0.22% 0.29% 0.40% 1.43% 0.22% 0.31% GBP 0.16% -0.23% 0.09% 0.19% 1.22% 0.02% 0.10% CAD 0.08% -0.28% -0.07% 0.14% 1.17% -0.05% 0.04% AUD -0.05% -0.40% -0.19% -0.11% 1.01% -0.17% -0.09% JPY -1.05% -1.46% -1.23% -1.19% -1.04% -1.22% -1.13% NZD 0.15% -0.23% -0.02% 0.09% 0.17% 1.21% 0.07% CHF 0.05% -0.31% -0.10% -0.04% 0.07% 1.11% -0.10% The heat map shows percentage changes of major currencies against each other. The base currency is picked from the left column, while the quote currency is picked from the top row. For example, if you pick the Euro from the left column and move along the horizontal line to the Japanese Yen, the percentage change displayed in the box will represent EUR (base)/JPY (quote).
-
10:00
European Monetary Union Harmonized Index of Consumer Prices (YoY) registered at 2.9%, below expectations (3.1%) in October
-
10:00
Greece Retail Sales (YoY) dipped from previous -3.4% to -3.6% in August
-
10:00
European Monetary Union Gross Domestic Product s.a. (YoY) registered at 0.1%, below expectations (0.2%) in 3Q
-
10:00
Italy Consumer Price Index (EU Norm) (YoY) below forecasts (2.3%) in October: Actual (1.9%)
-
10:00
European Monetary Union Core Harmonized Index of Consumer Prices (YoY) meets forecasts (4.2%) in October
-
10:00
European Monetary Union Gross Domestic Product s.a. (QoQ) below forecasts (0%) in 3Q: Actual (-0.1%)
-
10:00
Italy Consumer Price Index (MoM) came in at -0.1%, below expectations (0.2%) in October
-
10:00
Italy Consumer Price Index (YoY) below forecasts (2.3%) in October: Actual (1.8%)
-
10:00
Italy Consumer Price Index (EU Norm) (MoM) registered at 0.2%, below expectations (0.5%) in October
-
09:48
Gold Price Forecast: XAU/USD appears to be consolidating and building a base for further gains – ANZ
Gold remains capped below the $2,000 barrier after surging above this level on Friday amid current Israel-Hamas conflict concerns. Strategists at ANZ Bank analyze the yellow metal’s outlook.
Israel’s limited ground offensive in Gaza saw haven demand soften
Israel’s limited ground offensive in Gaza saw haven demand soften.
Gold had pushed above $2,000 on Friday, but it was not able to hold those gains on Monday.
Nevertheless, Gold does appear to be consolidating and building a base for further gains.
See – Gold Price Forecast: XAU/USD to move sustainably into $2,100 territory – TDS
-
09:41
USD/CAD flirts with daily low, manages to hold above 1.3800 ahead of US macro data
- USD/CAD attracts some intraday selling on Tuesday, though the downside remains limited.
- An uptick in Oil prices underpins the Loonie and exerts pressure amid renewed USD selling.
- Hawkish Fed expectations warrant caution before positioning for any meaningful decline.
The USD/CAD pair attracts fresh sellers following an intraday uptick to mid-1.3800s and drops to a fresh daily low during the first half of the European session. Spot prices, however, manage to hold above the 1.3800 round figure and seem poised to prolong over a three-week-old uptrend.
A modest uptick in Crude Oil prices is seen underpinning the commodity-linked Loonie. Apart from this, a generally positive tone around the equity markets drags the safe-haven US Dollar (USD) to a one-week low, which, in turn, is seen exerting some pressure on the USD/CAD pair. Any meaningful corrective decline, however, still seems elusive ahead of the key central bank event risk – the outcome of the highly-anticipated two-day FOMC monetary policy meeting starting this Tuesday.
The Federal Reserve (Fed) is scheduled to announce its decision on Wednesday and is widely anticipated to keep its benchmark interest rate steady in the range of 5.25%-5.50%, or the highest in 22 years. That said, the US economic resilience, along with still sticky inflation, should allow the US central bank to keep the door open for one more rate hike in 2023. The hawkish outlook remains supportive of elevated US Treasury bond yields, which should lend support to the buck and the USD/CAD pair.
Furthermore, investors remain concerned about the worsening economic conditions in China – the world's top oil importer. This, along with worries that headwinds stemming from rapidly rising borrowing costs could dent fuel demand, keeps a lid on any meaningful upside for Crude Oil prices. Apart from this, the Bank of Canada (BoC) Governor Tiff Macklem's dovish signal last week, indicating that interest rates may have peaked, should contribute to limiting the downside for the USD/CAD pair.
Next on tap is the US economic docket – featuring the release of the Chicago PMI and the Conference Board's Consumer Confidence Index later during the early North American session. Apart from this, the US bond yields will drive the USD demand, which, along with Oil price dynamics, should provide some impetus to the USD/CAD pair. Nevertheless, the aforementioned fundamental backdrop suggests that the path of least resistance for spot prices is to the upside.
Technical levels to watch
-
09:33
Portugal Gross Domestic Product (QoQ) below expectations (0.1%) in 3Q: Actual (-0.2%)
-
09:31
Portugal Consumer Price Index (MoM): -0.2% (October) vs previous 1.1%
-
09:31
Euro climbs to multi-day highs near 1.0650 ahead of Eurozone GDP, inflation data
- The Euro extends the upside momentum against the US Dollar.
- European stocks open Tuesday’s session with decent gains.
- Eurozone flash GDP Growth Rate, Inflation Rate next on tap.
The Euro (EUR) keeps the optimism well and sound in the first half of the week against the US Dollar (USD), lifting EUR/USD to new multi-day highs in the proximity of 1.0650 on Tuesday.
On the other side of the equation, the Greenback comes under extra downside pressure and forces the USD Index (DXY) to flirt with the key support at 106.00 amidst a broad-based improvement in the risk appetite. The persistent decline in the Greenback comes in tandem with an equally weak tone in US yields across the curve.
In the context of monetary policy, there is a growing agreement among market participants that the Federal Reserve (Fed) is likely to maintain its current position of keeping interest rates unchanged at Wednesday's meeting. Nonetheless, there is a possibility of a rate adjustment in December, which appears to be supported by the continued strength of the US economy and still-high inflation levels.
In the domestic calendar, Retail Sales in Germany contracted 4.3% in the year to September. Later in the session, all the attention will be on the publication of the advanced Inflation Rate for October and Q3 Gross Domestic Product (GDP) Growth Rate for the broader Eurozone.
In the US data space, the Employment Cost index is due, seconded by the FHFA House Price Index and the key Consumer Confidence measured by The Conference Board.
Daily digest market movers: Euro picks up pace as risk appetite improves
- The EUR trades with decent gains against the USD.
- US and German yields are poised to resume the downside.
- The Fed could still hike rates by 25 bps in December.
- The ECB is expected to maintain its monetary policy impasse until H2 2024.
- Geopolitical concerns in the Middle East remain unabated.
- The BoJ tweaked its YCC programme at its meeting earlier on Tuesday.
- Chinese PMIs surprised to the downside in October.
Technical Analysis: Euro looks at 1.0694
EUR/USD extends the positive price action further north of the 1.0600 hurdle on Tuesday.
Next on the upside for EUR/USD comes the interim 55-day Simple Moving Average (SMA) at 1.0669 prior to the October peak of 1.0694 (October 24). The breakout of this level exposes the weekly top of 1.0767 (September 12) ahead of the crucial 200-day SMA at 1.0809, while another weekly high of 1.0945 (August 30) comes before the psychological barrier of 1.1000. Beyond this region, the pair may encounter resistance at the August peak of 1.1064 (August 10), ahead of the weekly top of 1.1149 (July 27) and the 2023 high of 1.1275 (July 18).
The resumption of the bearish mood could drag the pair to the weekly low of 1.0495 (October 13), ahead of the lowest level in 2023 at 1.0448 (October 15), and the round number of 1.0400.
The pair's outlook is predicted to continue bearish as long as it remains below the crucial 200-day SMA.
Euro FAQs
What is the Euro?
The Euro is the currency for the 20 European Union countries that belong to the Eurozone. It is the second most heavily traded currency in the world behind the US Dollar. In 2022, it accounted for 31% of all foreign exchange transactions, with an average daily turnover of over $2.2 trillion a day.
EUR/USD is the most heavily traded currency pair in the world, accounting for an estimated 30% off all transactions, followed by EUR/JPY (4%), EUR/GBP (3%) and EUR/AUD (2%).What is the ECB and how does it impact the Euro?
The European Central Bank (ECB) in Frankfurt, Germany, is the reserve bank for the Eurozone. The ECB sets interest rates and manages monetary policy.
The ECB’s primary mandate is to maintain price stability, which means either controlling inflation or stimulating growth. Its primary tool is the raising or lowering of interest rates. Relatively high interest rates – or the expectation of higher rates – will usually benefit the Euro and vice versa.
The ECB Governing Council makes monetary policy decisions at meetings held eight times a year. Decisions are made by heads of the Eurozone national banks and six permanent members, including the President of the ECB, Christine Lagarde.How does inflation data impact the value of the Euro?
Eurozone inflation data, measured by the Harmonized Index of Consumer Prices (HICP), is an important econometric for the Euro. If inflation rises more than expected, especially if above the ECB’s 2% target, it obliges the ECB to raise interest rates to bring it back under control.
Relatively high interest rates compared to its counterparts will usually benefit the Euro, as it makes the region more attractive as a place for global investors to park their money.How does economic data influence the value of the Euro?
Data releases gauge the health of the economy and can impact on the Euro. Indicators such as GDP, Manufacturing and Services PMIs, employment, and consumer sentiment surveys can all influence the direction of the single currency.
A strong economy is good for the Euro. Not only does it attract more foreign investment but it may encourage the ECB to put up interest rates, which will directly strengthen the Euro. Otherwise, if economic data is weak, the Euro is likely to fall.
Economic data for the four largest economies in the euro area (Germany, France, Italy and Spain) are especially significant, as they account for 75% of the Eurozone’s economy.How does the Trade Balance impact the Euro?
Another significant data release for the Euro is the Trade Balance. This indicator measures the difference between what a country earns from its exports and what it spends on imports over a given period.
If a country produces highly sought after exports then its currency will gain in value purely from the extra demand created from foreign buyers seeking to purchase these goods. Therefore, a positive net Trade Balance strengthens a currency and vice versa for a negative balance. -
09:30
Portugal Gross Domestic Product (QoQ) registered at 0.2% above expectations (0.1%) in 3Q
-
09:30
Portugal Consumer Price Index (YoY) fell from previous 3.6% to 2.1% in October
-
09:30
Portugal Gross Domestic Product (YoY) down to 1.9% in 3Q from previous 2.3%
-
09:23
EUR/USD: Unlikely to trade above resistance at 1.0630/1.0640 unless US consumer confidence falls sharply – ING
EUR/USD zig-saws around 1.06. Economists at ING analyze the pair’s outlook.
Softer rate profile weighs
Eurozone two-year swap rates have fallen close to 25 bps over the last couple of weeks as data and dovish commentary feed the narrative that the ECB is done tightening. Today's data should support those themes, where eurozone third-quarter GDP should come in flat quarter-on-quarter and flash October CPIs should show further improvement.
Unless US consumer confidence falls sharply, we doubt investors will want to chase EUR/USD through intraday resistance at 1.0630/1.0640, especially ahead of Wednesday's FOMC meeting.
-
09:08
WTI Price Analysis: Sticks to modest gains around mid-$82.00s, upside potential seems limited
- WTI gains some positive traction on Tuesday and recovers a part of the precious day’s slide.
- The technical setup favours bearish traders and supports prospects for a further downfall.
- Any positive move back above the $83.00 mark is likely to get sold into and remain capped.
West Texas Intermediate (WTI) Crude Oil prices attract some buying on Tuesday and move away from a near three-week low, around the $81.55 region touched the previous day. The commodity sticks to its modest intraday gains through the first half of the European session and currently trades around mid-$82.00s, up 0.25% for the day.
Worries that a further escalation in the Israel-Hamas conflict could disrupt oil supplies from the Middle East turn out to be a key factor lending some support to the black liquid. The upside, however, remains capped in the wake of the worsening economic conditions in China – the world's top oil importer – and headwinds stemming from rapidly rising borrowing costs, which could dent fuel demand.
From a technical perspective, the overnight sharp decline and a close below the $83.50-$83.30 horizontal support could be seen as a fresh trigger for bearish traders. Moreover, oscillators on the daily chart have just started drifting into the negative territory and suggest that the path of least resistance for Oil prices is to the downside. Hence, any subsequent move up is more likely to get sold into.
The $83.00 round figure, followed by the $83.30-$83.50 support breakpoint now seems to act as an immediate strong barrier. A sustained strength beyond, however, could lift Oil prices beyond the $84.00 mark, towards the $84.70 intermediate hurdle en route to the $85.00 psychological mark. The next relevant resistance is pegged near the mid-$85.00s, which if cleared will negate the bearish outlook.
On the flip side, the $82.00 round figure is likely to protect the immediate downside ahead of the overnight swing low, around the $81.55 region. Some follow-through selling will be seen as a fresh trigger for bearish traders and make Oil prices vulnerable to weaken further below the $81.00 mark. The downward trajectory could eventually drag the commodity towards the monthly low, around the $80.65 region.
WTI daily chart
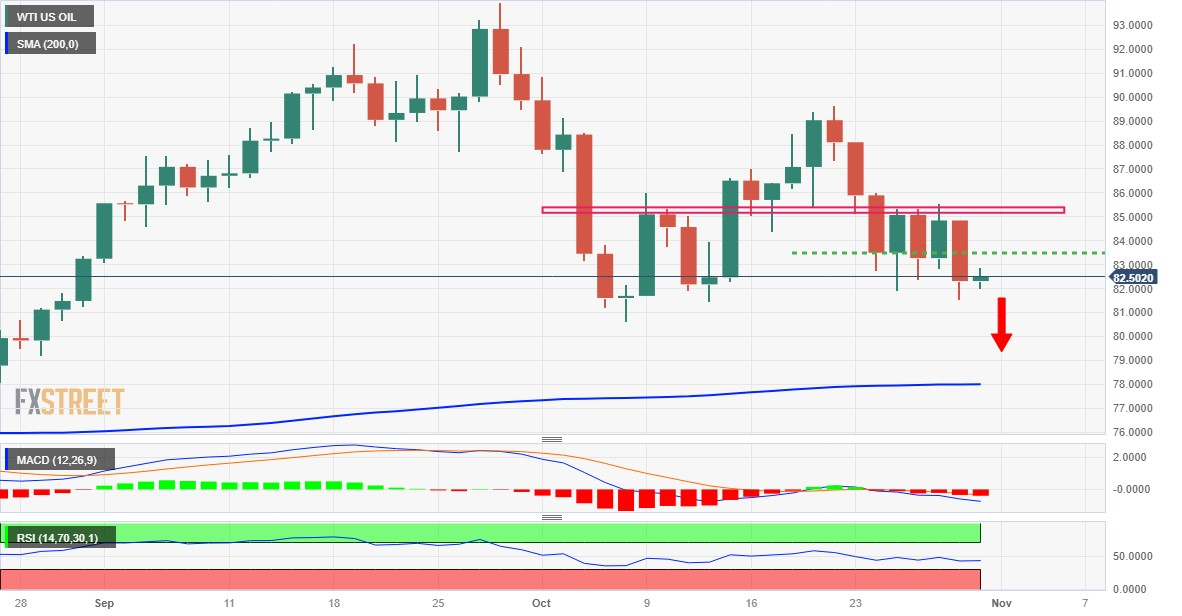
Technical levels to watch
-
09:01
Spain Current Account Balance down to €4.19B in August from previous €4.27B
-
09:00
Italy Gross Domestic Product (YoY) registered at 0%, below expectations (0.1%) in 3Q
-
09:00
Italy Gross Domestic Product (QoQ) below expectations (0.1%) in 3Q: Actual (0%)
-
08:58
USD/JPY to push ahead to 152 and prompt aggressive FX intervention – ING
USD/JPY is higher after the BoJ made the lightest of tweaks to its Yield Curve Control policy. Economists at ING analyze the pair’s outlook.
The BoJ's in no rush to exit YCC
One gets the sense from the BoJ that it is wary of JGB yields spiking, and that is why it is acting so very carefully here. At the same time, the change in inflation forecasts was insufficient to support views of an exit to YCC policy. CPI ex-food – which is BoJ's target – is still forecast at 1.7% in FY25 – i.e., not above 2% in a stable manner.
Today's BoJ meeting has not triggered the reset on how we view the Yen and the risk is now that USD/JPY pushes ahead to 152 and prompts the central bank into aggressive FX intervention.
-
08:55
EUR/GBP revisits the five-month high near 0.8740 ahead of Eurozone data
- EUR/GBP continues the winning streak despite downbeat German Retail Sales.
- Investors await Eurozone HICP and GDP data to gain economic insights into the Eurozone.
- BoE is expected to maintain interest rates at 5.25%; weakening the Pound Sterling.
EUR/GBP continues the winning streak for the third consecutive day, revisiting the five-month high around 0.8740 during the European session on Tuesday. The cross-pair receives upward support despite the weaker German Retail Sales (YoY), which declined by 4.3% in September compared to the previous drop of 2.3%.
Moreover, Germany’s preliminary Harmonized Index of Consumer Prices (MoM) for October released on Monday, declined by 0.2% against the expected rise of 0.1%, swinging from the 0.2% rise in September. While, the yearly index reduced to 3.0% from 4.3% previously, lower than the 3.6% expected.
Additionally, Germany's GDP for Q3 contracted, although the contraction was less severe than anticipated, still showing a negative reading of 0.1% against the market consensus of 0.3% decline.
The upcoming data from the Eurozone on Tuesday, including the Harmonized Index of Consumer Prices (HICP), Core HICP, and seasonally adjusted Gross Domestic Product (GDP), will be closely watched by investors. These indicators could provide crucial insights into the inflationary pressures and the economic performance of the Eurozone.
The anticipation that the Bank of England (BoE) will maintain interest rates at 5.25% in Thursday's decision is a significant factor in weakening the market sentiment toward the British Pound (GBP).
Investors will also likely monitor the BoE Monetary Policy Committee (MPC) report. The MPC reports provide insights into the internal dynamics and consensus among policymakers, offering cues on the central bank's stance on monetary policy.
-
08:49
USD/JPY: Further weakness now points to 148.15 – UOB
The downward bias in USD/JPY could extend to the 148.15 zone in the next few weeks, according to Economist Lee Sue Ann and Markets Strategist Quek Ser at UOB Group.
Key Quotes
24-hour view: Yesterday, we held the view that USD “has scope to test 149.35 before the risk of rebound increases.” We were also of the view that “149.00 is unlikely to come under threat.” Our view was incorrect, as USD plummeted to 148.79 before rebounding. The rebound in oversold conditions suggests USD is unlikely to weaken much further. Today, USD is more likely to trade between 148.75 and 149.75.
Next 1-3 weeks: We noted yesterday (30 Oct, spot at 149.75) that the recent buildup in upward momentum had largely dissipated. We expected USD to trade in a range of 149.00/150.70. We did not anticipate USD to drop to a low of 148.79. There is a tentative buildup in downward momentum, and USD is likely to trade with a downward bias towards 148.15. At this time, it is too early to tell if USD has enough momentum to break below this level. Overall, only a breach of 150.30 would indicate that the downward bias has faded.
-
08:48
FX option expiries for Oct 31 NY cut
FX option expiries for Oct 31 NY cut at 10:00 Eastern Time, via DTCC, can be found below.
- EUR/USD: EUR amounts
- 1.0450 1.8b
- 1.0500 1.6b
- 1.0525 822m
- 1.0550 613m
- 1.0600 1.2b
- 1.0645 500m
- GBP/USD: GBP amounts
- 1.2160 497m
- USD/JPY: USD amounts
- 148.60 470m
- 150.00 1.3b
- USD/CHF: USD amounts
- 0.9200 370m
- AUD/USD: AUD amounts
- 0.6330 566m
- USD/CAD: USD amounts
- 1.3825 615m
- NZD/USD: NZD amounts
- 0.5850 772m
-
08:38
Natural Gas Futures: Further correction should not be ruled out
Considering advanced prints from CME Group for natural gas futures markets, open interest rose by around 2.2K contracts after two consecutive daily declines on Monday. On the other hand, volume dropped for the second session in a row, this time by nearly 52K contracts.
Natural Gas now eyes a move to $4.00
Natural gas prices started the week on the back foot and came under pressure following Friday’s nine-month highs. The daily downtick came on the back of rising open interest, which seems to reinforce the idea that a corrective decline appears likely in the very near term. In the meantime, further rebound carries the potential to extend to the next hurdle at the round level of $4.00 per MMBtu.
-
08:34
Silver Price Analysis: XAG/USD continues with its struggle to find acceptance above 200-day SMA
- Silver drifts lower on Tuesday and snaps a two-day winning streak to over a one-week high.
- The mixed technical setup warrants some caution before placing aggressive directional bets.
- A sustained strength beyond the $23.60-70 area to support prospects for any further gains.
Silver (XAG/USD) extends the previous day's retracement slide from the $23.60-$23.70 horizontal resistance and remains under some selling pressure through the first half of the European session on Tuesday. The white metal currently trades around the $23.20-$23.15 region, down over 0.50% for the day, and for now, seems to have snapped a two-day winning streak.
From a technical perspective, the recent repeated failures to find acceptance above the 200-day Simple Moving Average (SMA) and the subsequent pullbacks from the $23.60-$23.70 supply zone warrant caution for bullish traders. That said, oscillators on the daily chart are holding in the positive territory and support prospects for the emergence of some dip-buying. Hence, it will be prudent to wait for some follow-through selling below the $23.00 mark before positioning for any further depreciating move.
The XAG/USD might then accelerate the fall towards testing last week's swing low, around the $22.45 region. This is closely followed by the $22.30-$22.25 horizontal resistance breakpoint now turned support, which if broken decisively will be seen as a fresh trigger for bearish traders. The downward trajectory could then get extended further towards the $22.00 round-figure mark en route to the $21.70 horizontal support.
On the flip side, momentum beyond the $23.35 region (200-day SMA) might continue to confront hurdle near the $23.60-$23.70 zone. A sustained strength beyond should allow the XAG/USD to reclaim the $24.00 mark and climb further towards testing the next relevant barrier near the $24.20 region. Some follow-through buying will confirm a fresh breakout and allow the white metal to make a fresh attempt towards conquering the $25.00 psychological mark.
Silver daily chart
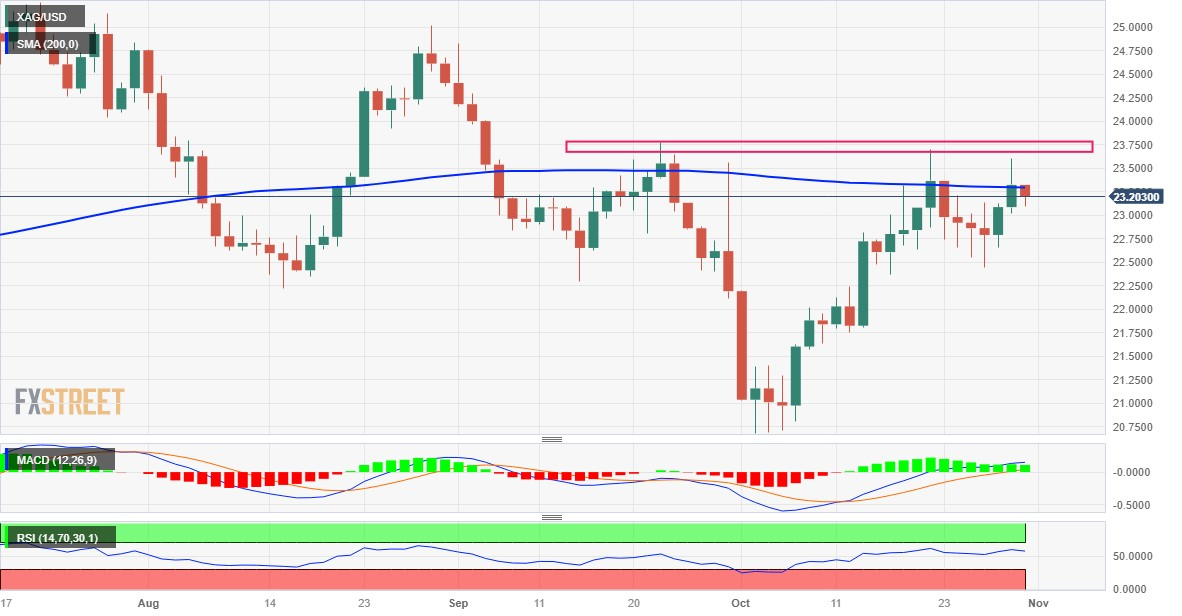
Technical levels to watch
-
08:30
EUR/USD could rise a few more pips again before the focus shifts to Fed meeting – Commerzbank
On Monday, the Euro had a good day against the Dollar. Economists at Commerzbank analyze EUR/USD outlook.
Rapid rate cuts unlikely to be discussed by the ECB in the near future
Whether or not the year-on-year inflation rate falls a little more than expected may not be all that interesting for the FX market today, as volatile energy and food prices play an important role. What is more interesting is that the month-on-month rate is likely to remain a little too high to be in line with the inflation target – not to mention the stubbornly high core inflation of over 4%! – and therefore rapid rate cuts are unlikely to be discussed by the ECB in the near future.
If the numerous ECB speakers today continue to emphasise a ‘high for longer’, the EUR/USD could rise a few more pips again before the focus shifts to Wednesday's Fed meeting.
-
08:13
Gold Price Forecast: XAU/USD to move sustainably into $2,100 territory – TDS
Gold moved into $2,000 territory in response to rising geopolitical risks. Strategists at TD Securities analyze the yellow metal’s outlook.
Fed set to pivot to a less restrictive stance
Provided the conflict does not spread into key Oil producing, the Fed's higher-for-longer narrative should see some of the risk premium associated with Gold unwind over the next few weeks.
We see the yellow metal move sustainably into $2,100 territory as the Fed pivots to a less restrictive stance, the official sector keeps buying and the USD weakens.
-
08:00
USD/CHF stabilizes above 0.9000 ahead of Fed’s monetary policy meeting
- USD/CHF remains comfortable above 0.9000 as the focus shifts to Fed monetary policy.
- The market mood remains vulnerable as the Israeli army is all set for a ground assault in Gaza.
- Investors await the Fed policy and the speech from SNB Jordan.
The USD/CHF pair trades back and forth above the psychological resistance of 0.9000 in the early European session. The Swiss Franc asset aims to extend upside as investors remain cautious ahead of the interest rate decision by the Federal Reserve (Fed), which is scheduled for Wednesday.
S&P500 futures generated some losses in the Tokyo session, indicating a risk-off mood amid geopolitical tensions. The Israeli army is all set for a ground assault in Gaza to demolish Palestine military troops in retaliation to airstrikes from Hamas since October 7.
The US Dollar Index (DXY) struggles to extend upside above 106.40 as a neutral interest rate decision from the Fed is widely anticipated. However, the outlook would remain hawkish due to robust consumer spending, strong labor market conditions, and potential signs of recovery in the manufacturing and service sectors.
The market participants expect that excess price pressures above the 2% inflation target are the most stubborn as the US economy is resilient despite higher borrowing costs. Therefore, hawkish guidance would be appropriate. Apart from easing price pressures, higher US long-term bond yields are allowing Fed policymakers to keep interest rates steady. 10-year US Treasury yields have rebounded to near 4.88%.
On the Swiss Franc front, investors await the speech from Swiss National Bank (SNB) Chairman Thomas J. Jordan, which is scheduled for Wednesday. SNB Jordan is expected to discuss about keeping interest rates unchanged at 1.75% for a longer period to ensure price stability. This week, the Swiss inflation data for October will be keenly watched.
-
07:59
USD/CNY: Downward pressure on Yuan to persist before economic growth gains a solid footing – Commerzbank
USD/CNY has hovered around 7.30 since mid-August. Economists at Commerzbank analyze the pair’s outlook after today’s official PMIs for October unexpectedly fell.
Weak PMI
The official manufacturing PMI fell below the 50 neutral mark to 49.5 after it increased to 50.2 in September. Further, the official non-manufacturing PMIs for October eased back to 50.6 from 51.7 in September.
The downward pressure on CNY will likely persist before economic growth decisively gains a solid footing. In the meantime, PBoC is likely to continue to target CNY stability.
-
07:50
USD/JPY should continue to trend higher in the coming weeks – Commerzbank
USD/JPY moved back above 150 after the Bank of Japan (BoJ) Monetary Policy Statement. Economists at Commerzbank analyze the pair’s outlook.
The BoJ seems reluctant to find an exit
The BoJ has definitely stuck to its line of not providing much clarity in its decisions with rather confusing communication regarding the YCC. Moreover, today's decision casts doubt on whether the BoJ is at least considering an exit from ultra-expansive monetary policy in the near future.
The central bank points out that inflation is expected to remain elevated next year, but then fall back below the 2% target in 2025 – it expects core inflation to be 1.9% in 2025. Accordingly, it continues to expect the inflation shock to be transitory.
Given the uncertainties surrounding inflation, it is not surprising that the market perceives this as further dovish and punishes the Yen. In the absence of any signs of intervention from the Japanese Ministry of Finance, USD/JPY should continue to trend higher in the coming weeks.
-
07:47
France Consumer Price Index (EU norm) (MoM) meets expectations (0.2%) in October
-
07:45
France Producer Prices (MoM) came in at 0.7%, above forecasts (0.2%) in September
-
07:45
France Consumer Price Index (EU norm) (YoY) registered at 4.5%, below expectations (4.6%) in October
-
07:45
Further range bound trade likely in NZD/USD near term – UOB
In the view of Economist Lee Sue Ann and Markets Strategist Quek Ser at UOB Group, NZD/USD now faces some near-term consolidation.
Key Quotes
24-hour view: Yesterday, we expected NZD to consolidate further in a range of 0.5790/0.5835. However, NZD traded in a higher range of 0.5805/0.5844. Upward momentum has hardly increased. Today, NZD could test 0.5855 before the risk of a pullback increases. The next resistance at 0.5900 is highly unlikely to come into view. Support is at 0.5825, followed by 0.5810.
Next 1-3 weeks: We have expected a lower NZD since early last week. In our latest update from last Friday (27 Oct, spot at 0.5820), we indicated that “while downward momentum has waned somewhat, there is still a chance for NZD to weaken to 0.5730.” Yesterday, NZD rose to a high of 0.5844. While our ‘strong resistance’ level of 0.5855 has not been breached, the weakness in NZD appears to have stabilised. From here, NZD is likely to trade in a range, probably between 0.5775 and 0.5900.
-
07:42
NZD/USD moves below 0.5850 as Greenback rebounds, awaits Fed decision
- NZD/USD retraces recent gains ahead of Fed policy rate decision.
- China’s NBS PMI data shows a contraction in economic trends; which could affect the Kiwi Dollar.
- New Zealand Building Permits declined by 4.7% against the previous drop of 0.7%.
NZD/USD pulls back as the US Dollar (USD) rebounds after two days of losses, trading lower near 0.5840 during the early European session on Tuesday. Moreover, in September, the disappointing turn in the Chinese economic narrative unfolded with the NBS Manufacturing Purchasing Managers' Index (PMI) unexpectedly contracting to 49.5. This outcome was contrary to the expected consistency at the 50.2 expansion observed in July.
The concerns about China's economic conditions intensified as the NBS Services PMI also dropped to 50.6, falling short of the expected 51.8 and the previous reading of 51.7. The simultaneous contraction in both the manufacturing and services sectors raises substantial concerns about the overall economic health in China, which might undermine the Kiwi Dollar (NZD), given New Zealand’s status as the largest trading partner of China.
On New Zealand’s docket, the seasonally adjusted Building Permits (MoM) reported on Tuesday, declining by 4.7% compared to the previous drop of 0.7%. The Reserve Bank of New Zealand (RBNZ) is expected to adopt a more accommodative stance on interest rate hikes following the soft headline Consumer Price Index (CPI) data, which exerts pressure on the New Zealand Dollar (NZD).
The Employment Change and Unemployment Rate for the third quarter in New Zealand will likely to be crucial indicators that market participants will keenly observe later in the week. These data points provide valuable insights into the labor market, offering cues about the economic landscape, job creation, and overall employment conditions in the country.
United States (US) ADP Employment Change and ISM Manufacturing PMI for October may provide a broader perspective on the US economic situation. These data points can significantly influence market sentiment and contribute to the overall assessment of the economic health and performance of the United States.
Moreover, the anticipation that the US Fed interest rates will be maintained at 5.5% in the upcoming policy meeting is a crucial factor. This expectation, if realized, can lead to increased demand for US Treasury bills, putting downward pressure on US Treasury yields. The interplay of these dynamics is likely to impact the US Dollar (USD), making it an important consideration for traders in the current market environment.
-
07:31
Switzerland Real Retail Sales (YoY) registered at -0.6% above expectations (-1.2%) in September
-
07:24
Turkey Foreign Arrivals climbed from previous 5.65% to 6.5% in September
-
07:24
AUD/USD: Cross above 0.6440 can spark a bounce – SocGen
AUD/USD has experienced a steady decline after facing resistance at the trend line drawn since 2022 – now near 0.6700. Economists at Société Générale analyze the pair’s outlook.
Downward momentum receding
Daily MACD has started posting positive divergence denoting receding downward momentum. However, signals of an extended bounce are not yet visible. Last year low of 0.6200/0.6170 could be an important support zone in case the decline deepens.
A move beyond the high formed in October near 0.6440 could mean a short-term up move. This break is likely to lead the pair higher towards 0.6525 and perhaps even towards the multiyear trend line at 0.6700.
-
07:15
USD/JPY recovers above 150.00 on BoJ Ueda’s dovish guidance, Fed policy eyed
- USD/JPY rebounded above 150.00 after dovish guidance on interest rates from the BoJ.
- The Japanese economy is aiming to keep inflation comfortably above 2% through high wage growth.
- Further action in the US Dollar will be guided by the US Dollar.
The USD/JPY pair reclaims 150.00 as the Bank of Japan (BoJ) Governor Kazuo Ueda delivers dovish guidance on monetary policy. BoE Ueda said that the central bank won’t hesitate to take additional easing measures if required to keep inflation comfortably above 2%.
In the monetary policy decision, the BoJ kept interest rates unchanged negative at 0.1% as expected by the market participants. The Japanese economy is managing to keep inflation above 2% consistently but price pressures are broadly prompted by external factors. The BoJ is interested in keeping inflation above the 2% target comfortably through higher wage growth for which the continuation of expansionary policy stance is highly required.
The BoJ tweaked its Yield Curve Control (YCC) by redefining 1.0% as an "upper bound" in order to provide more room for flexibility. This would continue large-scale bond-buying. BoJ Ueda commented that an improvement in the YCC flexibility was appropriate. Kazuo Ueda is confident that the central bank is gradually getting closer to achieving the price target.
Meanwhile, the market mood remains downbeat due to deepening Israel-Palestine tensions. S&P500 futures generated some losses in the Asian session ahead of the monetary policy decision by the Federal Reserve (Fed). The Fed is expected to keep interest rates unchanged in the range of 5.25-5.50% as consumer inflation is easing consistently and higher US long-term bond yields are performing the job of the central bank effectively.
The US Dollar Index (DXY) faces selling pressure while attempting to extend upside above the immediate resistance of 106.40 on expectations that the Fed will deliver a neutral decision but will keep doors open for further rate-tightening.
-
07:12
Crude Oil Futures: Extra weakness appears favoured
CME Group’s flash data for crude oil futures market noted traders increased their open interest positions for the third straight session on Monday, now by around 22.5K contracts. Volume followed suit and went up by nearly 91K contracts, setting aside two daily drops in a row.
WTI: Next on the downside comes $80.00
Monday’s marked retracement in prices of WTI was on the back of increasing open interest and volume, indicating that further weakness remains in the pipeline for the commodity in the very near term. That said, immediately to the downside emerges the key $80.00 mark per barrel ahead of the 200-day SMA at $78.15.
-
07:02
German Retail Sales drop 4.3% YoY in September vs. -2.3% previous
Germany's Retail Sales declined 0.8% MoM in September versus a 0.5% increase expected and -1.2% in August, the latest official data released by Destatis showed on Tuesday.
On an annual basis, Retail Sales in the Eurozone's top economy dropped 4.3% in September versus a 2.3% decline seen in August.
EUR/USD reaction to the German data
The Euro is recovering losses despite the mixed German consumer spending data. At the time of writing, the EUR/USD is dropping 0.05% on the day to trade at 1.0605.
About German Retail Sales
The Retail Sales released by the Statistisches Bundesamt Deutschland is a measure of changes in sales of the German retail sector. It shows the performance of the retail sector in the short term. Percent changes reflect the rate of changes of such sales. The changes are widely followed as an indicator of consumer spending. Positive economic growth is usually anticipated as "bullish" for the EUR, while a low reading is seen as negative, or bearish, for the EUR.
-
07:01
Germany Import Price Index (YoY) came in at -14.3%, above forecasts (-15.1%) in September
-
07:01
Germany Retail Sales (MoM) below forecasts (0.5%) in September: Actual (-0.8%)
-
07:01
Germany Import Price Index (MoM) came in at 1.6%, above expectations (0.5%) in September
-
07:01
Denmark Unemployment Rate remains at 2.5% in September
-
07:00
Germany Retail Sales (YoY) dipped from previous -2.3% to -4.3% in September
-
07:00
Turkey Trade Balance up to -5.01B in September from previous -8.66B
-
07:00
Germany Import Price Index (YoY) above expectations (-15.1%) in September: Actual (-14.3%)
-
06:54
BoJ’s Ueda: Will scrutinize effect of govt's policy on inflation outlook once it is announced
Bank of Japan (BOJ) Governor Kazuo Ueda is speaking at the press conference, held after its October policy meeting on Tuesday.
Additional quotes
Will scrutinize effect of govt's policy on inflation outlook once it is announced.
We haven't had large upgrade to inflation outlook based on what we call '2nd force', or demand-driven factors.
Important for currencies to move stably reflecting fundamentals.
Possibility remains low for monetary policy to fall behind the curve.
Much of the cpi forecast revision is due to longer-than-expected rise in commodity prices.
Big volality in forex could have negative impact on economy.
Closely working with government, monitoring situation on forex.
We can contain speculative moves in market with flexible market operations.
We will allow more flexibility when it comes to non-speculative market moves based on fundamentals.
As in July, today's decision to make YCC flexible was partly aimed at preventing financial market volatility, including FX volatility.
Practically speaking, it would be difficult for boj staff to ascertain whether day-to-day rise in long-term yield is speculative.
developing story, please refresh for updates
USD/JPY reaction to Ueda's comments
USD/JPY is off the intraday high of 150.31, currently trading at 150.20, still up 0.74% on the day.
-
06:47
Asian stocks trade lower, European stock markets are set to open mixed ahead of Eurozone GDP, CPI data
- Asian equities trade in negative territory after the downbeat Chinese data and BoJ rate decision.
- China’s Manufacturing PMI eased to 49.5 in October vs. 50.2 prior, Services PMI dropped to 50.6 in October versus 51.7 prior.
- Bank of Japan (BoJ) kept the rate unchanged, decided to make YCC more flexible.
- European stock markets head to open mixed ahead of Eurozone data.
Most Asian stocks traded lower on Tuesday as Chinese PMI data came in worse than expected while the Bank of Japan (BoJ) tweaked its bond yield control policy following its October meeting. Markets might turn cautious ahead of the Federal Reserve (Fed) meeting on Wednesday.
The Federal Reserve (Fed) Chair Jerome Powell affirmed that the Fed would maintain the rate steady at its upcoming meeting. However, investors will take cues from the Fed officials' comments during the Press Conference. The dovish stance of US policymakers might trigger volatility in riskier assets like stock markets.
China’s Shanghai was down 0.19% to 3,015, the Shenzhen Component Index dropped 0.90% to 9,838, Hong Kong’s Hang Sang fell 1.70% to 17,110, South Korea’s Kospi dropped 1.38%, India’s NIFTY 50 is down 0.16%, and Japan’s Nikkei is gain 0.16%.
The weaker-than-expected China’s Manufacturing Purchasing Managers' Index (PMI) data exert some pressure on the Chinese equities. Earlier Tuesday, the nation’s Manufacturing PMI came in at 49.5 in October from 50.2 expansion in September, worse than the market expectation of 50.2. Meanwhile, NBS Services PMI dropped to 50.6 in October versus 51.7 prior, below the market consensus of 51.8.
In Japan, the Bank of Japan (BoJ) committee decided to keep the interest rate and 10-year Japanese Government Bond (JGB) yield target at -0.1% and 0% respectively, after its October meeting. Japanese central bank decided to make YCC more flexible and changed the language around the 1.0% 10-year JGB yield cap.
European stock markets are set to open mixed as investors await the top-tier data in the area, including German Retail Sales, the preliminary Eurozone inflation data, and Gross Domestic Products for the third quarter (Q3).
On Monday, the German growth number came in at 0.1% quarterly fall from 0% in the previous reading, slightly better than the 0.3% decline estimated. German Consumer Price Index (CPI) arrived at 3.8% YoY in October versus 4.5 prior. The figure registered the lowest since August 2021.
Looking ahead, market participants will keep an eye on German Retail Sales, Eurozone growth numbers, and CPI data on Tuesday. On the US docket, the Conference Board Consumer Confidence will be released. The attention this week will be on the Fed interest rate decision on Wednesday and the Bank of England (BoE) monetary policy meeting on Thursday. -
06:46
USD/MXN Price Analysis: Hovers near 18.0700 aligned with the barrier at seven-day EMA
- USD/MXN rebounds after a losing streak.
- MACD line diverges below the signal line, indicating that upward momentum weakens.
- Support at 23.6% Fibonacci retracement aligned with the 18.0000 key level.
USD/MXN snaps a three-day losing streak, trading higher around 18.0700 during the Asian session on Tuesday, followed by the key resistance around the seven-day Exponential Moving Average (EMA) at 18.1310 lined up with the key level at 18.2000.
A firm breakthrough above the barrier could open the doors for the USD/MXN pair to explore the region around the previous week’s low at 18.4257 in sync with the monthly low at 18.4945.
On the downside, the USD/MXN pair could receive support around the 23.6% Fibonacci retracement at 18.0526 lined up with the 18.0000 major level, followed by the weekly high at 17.9749.
The Moving Average Convergence Divergence (MACD) line remains above the centerline but diverges below the signal line, suggesting a potential shift in momentum. This divergence indicates that the recent upward momentum may be slowing down.
The 14-day Relative Strength Index (RSI) lies above the 50 level, indicating a bullish momentum in the market. This suggests that the recent gains in the USD/MXN pair have been stronger and the pair is overbought, implying strength in the current trend.
USD/MXN: Daily Chart
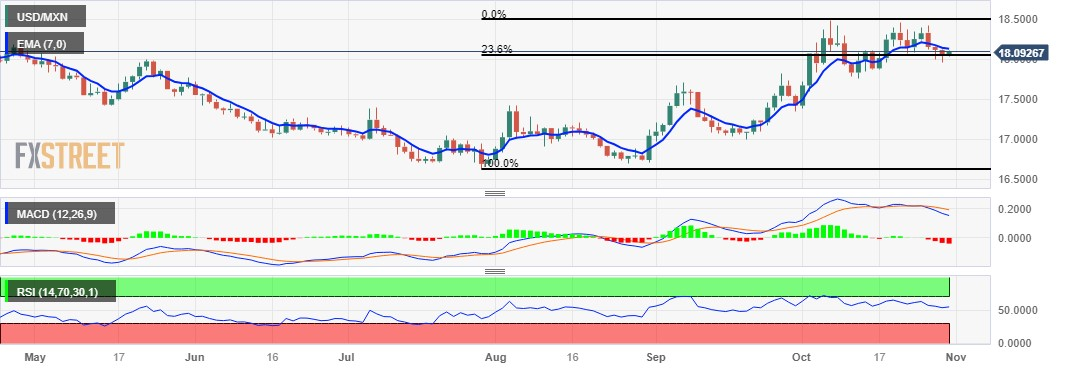
-
06:36
BoJ’s Ueda: Will patiently continue monetary easing with decided new measures
Bank of Japan (BOJ) Governor Kazuo Ueda is speaking at the press conference, held after its October policy meeting on Tuesday.
Additional quotes
Will patiently continue monetary easing with decided new measures.
Will closely scrutinize economy, price situation by examining wages and prices.
We are not in a situation to foresee sustainable and stable price increase.
Won't hesitate to take additional easing measures if necessary.
We will respond flexibly to economy and price situation.
Main reasons for inflation outlook overshoot compared to July are longer-than-expected effects of price pass-through, rising crude prices.
Today's decision was aimed at making YCC operation more flexible amid extreme high uncertainties around economy, financial markets.
Possible to conduct additional emergency bond-buying at 10-year yield levels below 1.0%.
True that likelihood of inflation outlook's realization is slightly higher but not in situation that we can foresee it with full confidence.
USD/JPY reaction to BoJ Ueda's remarks
In reaction to the above comments, USD/JPY is extending its upside, currently trading at 150.28. The pair is up 0.80% so far.
-
06:34
Pound Sterling faces pressure ahead of BoE policy, Middle East tensions
- Pound Sterling retreats as market sentiment dampens due to Israel-Palestine conflicts.
- The BoE is expected to keep interest rates unchanged to due to potential slowdown fears.
- A steady monetary policy decision from the BoE will keep policy divergence with the Fed intact.
The Pound Sterling (GBP) drops as investors turn risk-averse amid upside risks to Middle East tensions and anxiety ahead of the interest rate decision by the Bank of England (BoE). The GBP/USD pair faces selling pressure as the BoE is expected to keep interest rates unchanged at 5.25%, which will keep policy divergence with the Federal Reserve (Fed) intact.
The reasoning behind expectations of a steady monetary policy decision from the BoE is the deepening recession fears in the United Kingdom economy. Consumer inflation in the UK economy is significantly far from the desired rate of 2% and risks of price pressures remaining persistent are high as widening Middle East conflicts could elevate energy prices.
Daily Digest Market Movers: Pound Sterling corrects ahead of BoE policy
- Pound Sterling falls back sharply to near 1.2140 as investors turn cautious ahead of the monetary policy meeting by the Bank of England.
- Poor economic activities, weak household spending, soft labor demand, and upside risks to energy prices due to escalating Middle East tensions are supporting an unchanged interest rate decision by the BoE for the second time in a row.
- UK firms are operating at lower capacity due to a bleak demand outlook, which has cut labor demand heavily. The firms have also postponed their expansion plans due to higher borrowing costs.
- Consumer spending has also dropped significantly as higher price pressures have squeezed the real income of households.
- In addition to them, the housing sector is also facing the wrath of higher interest rates by the BoE. The central bank reported that mortgage approvals in September at 43,328 were the lowest since January.
- The ongoing cost of living crisis and upside risks to unemployment due to the consistently squeezing workforce have forced households to postpone home demand.
- Potential risks of a slowdown in the UK economy due to a sharp decline in economic activities would force BoE policymakers to keep interest rates unchanged at 5.25%.
- Over the interest rate guidance, the BoE is expected to keep doors open for further policy tightening as the headline inflation is more than thrice the desired rate of 2%. Therefore, the BoE would keep interest rates at an elevated level for a longer period.
- BoE policymaker Swati Dhingra commented in October that rate cuts would be early considered if the growth rate remains lower than expectations.
- The market mood remains downbeat as a ceasefire between Israel and Palestine is less likely. Israel's Prime Minister Netanyahu said that they will not agree to a cessation of fighting with Hamas.
- Meanwhile, the US Dollar recovered sharply after discovering buying interest near 106.00 as investors turned cautious ahead of the monetary policy meeting by the Federal Reserve.
- Like the BoE, the Fed is also expected to keep interest rates unchanged in the range of 5.25-5.50% on Wednesday.
- The US economy is upbeat on the grounds of labor market and consumer spending, and easing price pressures are supporting stable monetary policy. Unlike the UK economy which is struggling to bear the consequences of higher borrowing costs.
- Meanwhile, higher US long-term bond yields have tightened financial conditions, doing the Fed’s job effectively.
- Apart from the Fed’s monetary policy, the US Dollar Index (DXY) will dance to the tunes of the private payrolls and the ISM Manufacturing PMI data for September, which will be published on Wednesday.
Technical Analysis: Pound Sterling corrects from four-day high
Pound Sterling falls sharply from a four-day high around 1.2180 as the market mood turns cautious due to deepening Israel-Palestine conflicts and upcoming monetary policy from the BoE. The GBP/USD pair remains on the backfoot broadly as the 20 and 50-day Exponential Moving Averages (EMAs) are sloping below the 200-day EMA. Momentum oscillators struggle for a firm footing.
Pound Sterling FAQs
What is the Pound Sterling?
The Pound Sterling (GBP) is the oldest currency in the world (886 AD) and the official currency of the United Kingdom. It is the fourth most traded unit for foreign exchange (FX) in the world, accounting for 12% of all transactions, averaging $630 billion a day, according to 2022 data.
Its key trading pairs are GBP/USD, aka ‘Cable’, which accounts for 11% of FX, GBP/JPY, or the ‘Dragon’ as it is known by traders (3%), and EUR/GBP (2%). The Pound Sterling is issued by the Bank of England (BoE).How do the decisions of the Bank of England impact on the Pound Sterling?
The single most important factor influencing the value of the Pound Sterling is monetary policy decided by the Bank of England. The BoE bases its decisions on whether it has achieved its primary goal of “price stability” – a steady inflation rate of around 2%. Its primary tool for achieving this is the adjustment of interest rates.
When inflation is too high, the BoE will try to rein it in by raising interest rates, making it more expensive for people and businesses to access credit. This is generally positive for GBP, as higher interest rates make the UK a more attractive place for global investors to park their money.
When inflation falls too low it is a sign economic growth is slowing. In this scenario, the BoE will consider lowering interest rates to cheapen credit so businesses will borrow more to invest in growth-generating projects.How does economic data influence the value of the Pound?
Data releases gauge the health of the economy and can impact the value of the Pound Sterling. Indicators such as GDP, Manufacturing and Services PMIs, and employment can all influence the direction of the GBP.
A strong economy is good for Sterling. Not only does it attract more foreign investment but it may encourage the BoE to put up interest rates, which will directly strengthen GBP. Otherwise, if economic data is weak, the Pound Sterling is likely to fall.How does the Trade Balance impact the Pound?
Another significant data release for the Pound Sterling is the Trade Balance. This indicator measures the difference between what a country earns from its exports and what it spends on imports over a given period.
If a country produces highly sought-after exports, its currency will benefit purely from the extra demand created from foreign buyers seeking to purchase these goods. Therefore, a positive net Trade Balance strengthens a currency and vice versa for a negative balance. -
06:34
USD Index resumes the upside and rebounds to 106.40 ahead of data
- The index leaves behind two consecutive daily pullbacks.
- The Fed is seen leaving rates unchanged at its event on November 1.
- CB Consumer Confidence takes centre stage later in the NA session.
The greenback, in terms of the USD Index (DXY), regains some upside impulse and advances to the 106.40 zone ahead of the opening bell in Euroland on Tuesday.
USD Index focuses on data, Fed
The index leaves behind two daily pullbacks in a row and revisits the 106.40 area on the back of the knee-jerk in the risk-associated complex on turnaround Tuesday.
The current recovery in the index comes in tandem with a small decline in US yields across the curve amidst steady speculation that the Federal Reserve might keep its interest rates unchanged at its meeting on Wednesday.
Later in the NA session, the Employment Cost index is due in the first turn seconded by the FHFA House Price Index and the always relevant Consumer Confidence gauged by the Conference Board.
What to look for around USD
The recent corrective move in the index appears to have met decent contention just above the 106.00 yardstick so far this week.
In the meantime, support for the dollar keeps coming from the good health of the US economy and still elevated inflation, which morphs into higher yields and underpins the renewed tighter-for-longer narrative from the Federal Reserve.
Key events in the US this week: Employment Cost, FHFA House Price Index, CB Consumer Confidence (Tuesday) – MBA Mortgage Applications, ADP Report, Final Manufacturing PMI, ISM Manufacturing, Construction Spending, FOMC Interest Rate Decision, Powell press conference (Wednesday) - Initial Jobless Claims, Factory Orders (Thursday) – Nonfarm Payrolls, Unemployment Rate, Services PMI, ISM Services PMI (Friday).
Eminent issues on the back boiler: Persistent debate over a soft or hard landing for the US economy. Speculation of rate cuts in late 2024. Geopolitical effervescence vs. Russia and China. Potential spread of the Middle East crisis to other regions.
USD Index relevant levels
Now, the index is up 0.20% at 106.35 and the breakout of 106.88 (weekly high October 26) could expose 107.34 (2023 high October 3) and finally 107.99 (weekly high November 21 2022). On the downside, initial contention aligns at 105.36 (monthly low October 24) ahead of 104.42 (weekly low September 11) and then 103.43 (200-day SMA).
-
06:30
France Consumer Spending (MoM) came in at 0.2% below forecasts (0.4%) in September
-
06:30
France Gross Domestic Product (QoQ) meets forecasts (0.1%) in 3Q
-
06:11
GBP/USD now moved into a consolidative phase – UOB
Economist Lee Sue Ann and Markets Strategist Quek Ser at UOB Group suggest GBP/USD is now seen trading within the 1.2085-1.2240 band in the next weeks.
Key Quotes
24-hour view: We expected GBP to trade in a range of 1.2085/1.2155 yesterday. GBP dipped to a low of 1.2090 before staging a surprising sharp rise to 1.2175. While upward momentum has not improved much, there is room for GBP to test 1.2205. Today, the chance of GBP breaking clearly above this level is not high. If GBP breaks below 1.2120 (minor support is at 1.2135), it would mean that the current upward pressure has faded.
Next 1-3 weeks: We noted yesterday (30 Oct, spot at 1.2115) that downward momentum had waned somewhat, but “there is still room for GBP to test 1.2040.” GBP then rose to a high of 1.2175. While our ‘strong resistance’ level of 1.2180 has not been clearly breached, downward momentum has dissipated. GBP has moved into a range-trading phase and is likely to trade between 1.2085 and 1.2240 for the time being.
-
06:06
Gold Futures: Further correction in the pipeline
Open interest in gold futures markets increased for the second consecutive session on Monday, this time by around 7.5K contracts according to preliminary readings from CME Group. Volume, instead, shrank for the third session in a row, now by around 38.6K contracts.
Gold: Upside looks limited around $2000
Gold prices came under downside pressure soon after hitting fresh multi-month highs just above the $2000 mark per troy ounce. Monday’s decline was accompanied by rising open interest, which suggests that further retracement appears on the cards in the very near term. Against that backdrop, there is an initial support at the weekly low of $1953 (October 24) prior to the key 200-day SMA at $1933.

-
05:52
EUR/USD could now retest 1.0660 – UOB
Further improvement could prompt EUR/USD to revisit the 1.0660 region in the near term, comment Economist Lee Sue Ann and Markets Strategist Quek Ser at UOB Group.
Key Quotes
24-hour view: We expected EUR to trade sideways between 1.0535 and 1.0595 yesterday. However, after dipping briefly to 1.0545, EUR rose quickly to a high of 1.0624. Upward momentum is improving, albeit not much. Today, EUR could rise to the major resistance at 1.0660 (minor resistance is at 1.0635). At this time, it does not appear to have enough momentum to move above this level in a sustained manner. Support is at 1.0590, followed by 1.0565.
Next 1-3 weeks: Yesterday (30 Oct, spot at 1.0560), we noted EUR is still trading in a range. We added, “given the lower volatility, it is likely to trade in a narrower range of 1.0510/1.0660.” EUR then rose to a high of 1.0624. Upward momentum has improved a tad, and the risk of EUR breaking above 1.0660 has increased. The risk of EUR breaking clearly above 1.0660 will remain intact as long as EUR stays above 1.0545 in the next few days. Looking ahead, the next levels to watch above 1.0660 are at 1.0695 and 1.0730.
-
05:30
Netherlands, The Retail Sales (YoY) fell from previous 6.8% to 3.4% in September
-
05:18
WTI loses traction above $82.40 amid the fear of oil supply disruptions, high rates
- WTI prices loses momentum amid Middle East geopolitical tensions.
- World Bank predicted global oil prices to average $90 per barrel this quarter.
- Concerns about more rate hikes from the Federal Reserve (Fed) might weigh on WTI prices.
- Oil traders will closely watch the Fed rate decision on Wednesday.
Western Texas Intermediate (WTI), the US crude oil benchmark, is trading around $82.40 so far on Tuesday. A decline in WTI prices is supported by the escalating tension in the Middle East, which triggered the fear of potential oil supply disruptions.
According to a recent World Bank study, the rising tensions might exacerbate the already-existing energy market disruptions caused by Russia's war in Ukraine. Additionally, the World Bank forecasts global oil prices to average $90 per barrel this quarter. A “large disruption” scenario would lead to the oil price from about $90 to between $140 and 157.
Apart from this, concerns about rising interest rates might weigh on WTI prices. The Federal Reserve (Fed) Interest rate decisions are anticipated to maintain the rate steady, but Fed Chair Jerome Powell said that whether they will hold a rate for December will depend on the incoming data, while mentioning that an additional rate hike is possible if high economic growth and a labor shortage continue. It's worth noting that higher interest rates raise borrowing costs, which can slow the economy and diminish oil demand.
Looking ahead, oil traders will monitor the API and EIA weekly Crude Oil stock report for the week ending on October 27 due on Wednesday. On Wednesday, the Fed monetary policy meeting will be in the spotlight. Also, the US ISM Manufacturing PMI for October and Nonfarm Payrolls this week could offer hints about US economic conditions. These events could significantly impact the USD-denominated WTI price. Oil traders will take cues from the data and find trading opportunities around WTI prices.
-
05:10
Japan Housing Starts (YoY) came in at -6.8% below forecasts (-4.7%) in September
-
05:08
Forex Today: Japanese Yen weakens on BoJ, Euro awaits inflation data
Here is what you need to know on Tuesday, October 31:
The Japanese Yen came under heavy selling pressure early Tuesday following the Bank of Japan's (BoJ) monetary policy announcements. Eurostat will release the Harmonized Index of Consumer Prices (HICP) data for October later in the session. The US economic docket will feature August Housing Price Index and the Conference Board’s Consumer Confidence Index data for October ahead of the Federal Reserve’s all-important monetary policy decisions on Wednesday.
The improving market mood in the second half of the day weighed on the US Dollar (USD) on Monday, with the USD Index closing in negative territory. Re-escalating geopolitical tensions, however, helped the currency gather strength during the Asian trading hours on Tuesday and the USD Index recovered toward 106.50, erasing a large portion of Monday's losses. Israel Defense Forces said late Monday that it will continue to expand its ground incursion into Gaza and Israeli Prime Minister Benjamin Netanyahu stated that he will not agree to a cease-fire.
The BoJ left the policy settings unchanged after the October meeting as expected, maintaining the interest rate and the 10-year Japanese government bond (JGB) yield target at -0.1% and 0%, respectively. Some experts were anticipating the BoJ to lift the 10-year yield ceiling from 1% to 1.25% after strong inflation readings. "The Bank will maintain the target level of 10-year Japanese government bond (JGB) yields at around zero percent, it will conduct yield curve control with the upper bound of 1.0% for these yields as a reference and will control yields mainly through large-scale JGB purchases and nimble market operations," the BoJ said in its statement. USD/JPY gathered bullish momentum on the BoJ's inaction and was last seen gaining more than 0.5% on the day above 150.00.
Japanese Yen price today
The table below shows the percentage change of Japanese Yen (JPY) against listed major currencies today. Japanese Yen was the weakest against the Swiss Franc.
USD EUR GBP CAD AUD JPY NZD CHF USD 0.19% 0.20% 0.14% 0.37% 0.70% 0.23% 0.01% EUR -0.20% 0.00% -0.04% 0.16% 0.49% 0.03% -0.19% GBP -0.20% -0.01% -0.04% 0.15% 0.49% 0.04% -0.20% CAD -0.15% 0.07% 0.05% 0.22% 0.57% 0.09% -0.14% AUD -0.37% -0.16% -0.14% -0.19% 0.34% -0.10% -0.35% JPY -0.66% -0.49% -0.46% -0.57% -0.33% -0.44% -0.66% NZD -0.23% -0.02% -0.01% -0.05% 0.16% 0.47% -0.24% CHF 0.00% 0.19% 0.19% 0.13% 0.34% 0.69% 0.23% The heat map shows percentage changes of major currencies against each other. The base currency is picked from the left column, while the quote currency is picked from the top row. For example, if you pick the Euro from the left column and move along the horizontal line to the Japanese Yen, the percentage change displayed in the box will represent EUR (base)/JPY (quote).
In the meantime, the data from China revealed that the NBS Manufacturing PMI declined to 49.5 in October from 50.2 in September, while the NBS Non-Manufacturing PMI edged lower to 50.6 from 51.7.
EUR/USD advanced to a fresh six-day high above 1.0600 on Monday but lost its traction early Tuesday. Annual HICP inflation in the Euro area is forecast to soften to 3.2% from 4.3% in October. The data from Germany showed that inflation, as measured by the change in the Consumer Price Index (CPI), declined to 3.8% on a yearly basis in October from 4.5% in September. This reading came in below the market expectation of 4%.
Pressured by the negative shift seen in risk mood, GBP/USD retreated below 1.2150 after rising toward 1.2200 on Monday.
NZD/USD stretched lower following the disappointing Chinese data and was last seen trading in negative territory below 0.5850. In the early trading hours of the Asian session on Wednesday, Statistics New Zealand will publish labor market data for the third quarter.
Following the bearish action in the European session, Gold reversed its direction and rose above $2,000 in the American trading hours on Monday. XAU/USD, however, struggled to preserve its bullish momentum and declined toward $1,990 early Tuesday.
-
05:04
EUR/USD Price Analysis: Retraces the recent gains, hovers below 1.0600
- EUR/USD reverses the recent gains ahead of the Fed policy decision.
- MACD line lies above the signal line; suggesting a potential shift in momentum.
- A firm break above the 50-day EMA at 1.0654 could revisit October’s low.
EUR/USD moves downward after recent gains, hovering below 1.0600 during the Asian session on Tuesday. The pair could receive support near the psychological level at 1.0550, followed by the previous week's low at 1.0521.
A firm break below the latter could open the doors for the EUR/USD pair to navigate the area around the key level at 1.0500.
The market's prevailing expectation that the US Federal Reserve will maintain interest rates at 5.5% in the upcoming policy meeting is anticipated to have a weakening effect on the US Dollar (USD). On the upside, the 23.6% Fibonacci retracement at 1.0643 emerges as the immediate resistance, followed by the 50-day Exponential Moving Average (EMA) at 1.0654.
A breakthrough above the latter could inspire the bulls of the EUR/USD to revisit the monthly low at the 1.0694 level.
The technical analysis for the EUR/USD pair reveals interesting dynamics. The Moving Average Convergence Divergence (MACD) line remains below the centerline but above the signal line, indicating a potential shift in momentum. This suggests a nuanced market sentiment, with elements of change in the trend.
Additionally, the EUR/USD pair appears to be encountering subdued momentum, as evidenced by the 14-day Relative Strength Index (RSI). The RSI, dipping below the 50 level, signals a bearish momentum and reflects a bias toward weaker market sentiment.
EUR/USD: Daily Chart
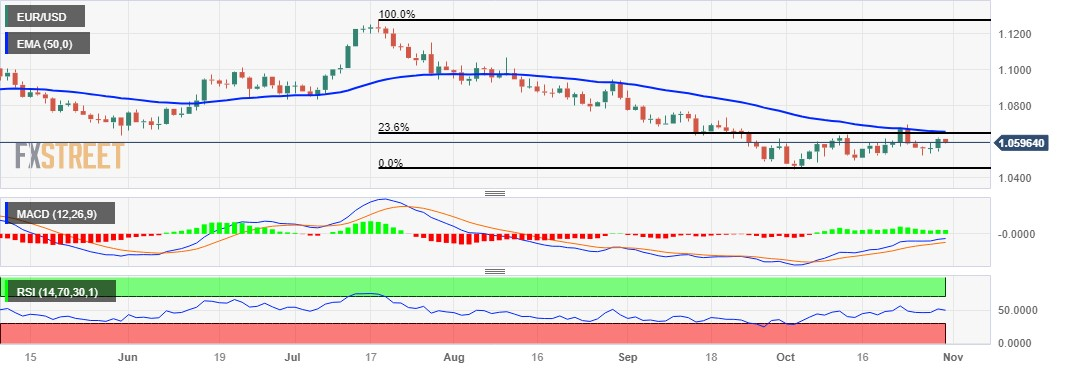
-
05:01
Japan Construction Orders (YoY) climbed from previous -4.3% to -3% in September
-
05:00
Japan Consumer Confidence Index came in at 35.7, above expectations (35.1) in October
-
04:42
Gold price edges lower on easing Middle East tensions, focus remains on FOMC meeting
- Gold price trades with a mild negative bias for the second successive day on Tuesday.
- Hawkish Fed expectations, elevated US bond yields and some USD buying exert pressure.
- Receding safe-haven demand also undermines the XAU/USD ahead of the FOMC meeting.
Gold price (XAU/USD) remains depressed for the second successive day on Tuesday and trades below the $2,000 psychological mark through the Asian session. Expectations that the Federal Reserve (Fed) will keep the door open for one additional rate hike this year to bring inflation back to its 2% target remain supportive of elevated US Treasury bond yields. This, in turn, helps revive the US Dollar (USD) demand and turns out to be a key factor weighing on the non-yielding yellow metal.
Apart from this, Israel's more measured approach to its incursion into Gaza has eased fears about a broadening crisis in the Middle East and further undermines the safe-haven Gold price. That said, the risk of a further escalation in the Israel-Hamas conflict remains, which, along with the uncertainty over the economic recovery in China, further lends support to the XAU/USD. Furthermore, the lack of any follow-through selling warrants some caution before placing aggressive bearish bets.
Traders might also opt to remain on the sidelines ahead of a two-day FOMC monetary policy meeting, starting this Tuesday. The Fed is scheduled to announce its decision on Wednesday and is widely anticipated to hold interest rates steady in a range of 5.25%-5.50%, or the highest in 22 years. Investors will look for cues about the future rate-hike path, which will play a key role in influencing the USD price dynamics and provide a fresh directional impetus to the Gold price.
Daily Digest Market Movers: Gold price remains on the defensive below a multi-month high touched last Friday
- Gold price struggles to gain any meaningful traction and remains below a multi-month peak touched last week, though lacks follow-through selling.
- The precious metal remains on track for an 8% rise this month – the most since November 2022 – in the wake of safe-haven demand stemming from the Middle East crisis.
- Investors seem reluctant to place aggressive directional bets and look to the Federal Reserve’s near-term monetary policy outlook for a fresh impetus.
- The Fed is widely expected to keep interest rates steady at a 22-year high at the end of its two-day monetary policy meeting on October 31-November 1.
- The US economy remains resilient and inflation is still above the Fed's 2% target level, which should allow the US central bank to stick to its hawkish stance.
- Fed Chair Jerome Powell had warned earlier this month that inflation was still too high and more rate increases are possible if the economy stays surprisingly hot.
- The Bank of Japan once again underdelivers and defies market expectations for a change to the 10-year JGB yield ceiling from 1% to perhaps 1.25% or 1.50%.
- Easing geopolitical tension in the Middle East dent demand for traditional safe-haven assets and also contributes to a mildly offered tone around the XAU/USD.
- China's Manufacturing PMI shrinks and growth in the services sector slowed in October, fuelling concerns about the worsening conditions in the world's second-largest economy.
Technical Analysis: Gold price could attract some buyers near the $1,985-1,984 strong horizontal resistance breakpoint
From a technical perspective, the Relative Strength Index (RSI) on the daily chart has eased from overbought territory and supports prospects for the emergence of some dip-buying around the Gold price. Hence, any subsequent decline is more likely to find support near the $1,986-1,985 horizontal resistance breakpoint. A convincing break, however, might prompt some technical selling and drag the XAU/USD further towards the $1,964 intermediate support en route to last week's swing low, around the $1,954-1,953 region.
On the flip side, the $2,000 round figure, followed by the multi-month top, around the $2,005 area touched last Friday, now seems to act as immediate hurdles. A sustained strength beyond should pave the way for an extension of a three-week-old bullish trend and lift the Gold price to the next relevant barrier near the $2,022 region.
US Dollar price today
The table below shows the percentage change of US Dollar (USD) against listed major currencies today. US Dollar was the weakest against the Swiss Franc.
USD EUR GBP CAD AUD JPY NZD CHF USD 0.21% 0.20% 0.15% 0.40% 0.65% 0.26% 0.03% EUR -0.22% -0.02% -0.03% 0.18% 0.43% 0.04% -0.18% GBP -0.20% 0.00% -0.02% 0.18% 0.46% 0.07% -0.17% CAD -0.17% 0.08% 0.04% 0.25% 0.51% 0.11% -0.12% AUD -0.41% -0.18% -0.18% -0.20% 0.28% -0.12% -0.35% JPY -0.64% -0.45% -0.46% -0.51% -0.27% -0.38% -0.62% NZD -0.26% -0.04% -0.06% -0.07% 0.12% 0.41% -0.24% CHF -0.04% 0.18% 0.16% 0.12% 0.35% 0.62% 0.23% The heat map shows percentage changes of major currencies against each other. The base currency is picked from the left column, while the quote currency is picked from the top row. For example, if you pick the Euro from the left column and move along the horizontal line to the Japanese Yen, the percentage change displayed in the box will represent EUR (base)/JPY (quote).
Gold FAQs
Why do people invest in Gold?
Gold has played a key role in human’s history as it has been widely used as a store of value and medium of exchange. Currently, apart from its shine and usage for jewelry, the precious metal is widely seen as a safe-haven asset, meaning that it is considered a good investment during turbulent times. Gold is also widely seen as a hedge against inflation and against depreciating currencies as it doesn’t rely on any specific issuer or government.
Who buys the most Gold?
Central banks are the biggest Gold holders. In their aim to support their currencies in turbulent times, central banks tend to diversify their reserves and buy Gold to improve the perceived strength of the economy and the currency. High Gold reserves can be a source of trust for a country’s solvency. Central banks added 1,136 tonnes of Gold worth around $70 billion to their reserves in 2022, according to data from the World Gold Council. This is the highest yearly purchase since records began. Central banks from emerging economies such as China, India and Turkey are quickly increasing their Gold reserves.
How is Gold correlated with other assets?
Gold has an inverse correlation with the US Dollar and US Treasuries, which are both major reserve and safe-haven assets. When the Dollar depreciates, Gold tends to rise, enabling investors and central banks to diversify their assets in turbulent times. Gold is also inversely correlated with risk assets. A rally in the stock market tends to weaken Gold price, while sell-offs in riskier markets tend to favor the precious metal.
What does the price of Gold depend on?
The price can move due to a wide range of factors. Geopolitical instability or fears of a deep recession can quickly make Gold price escalate due to its safe-haven status. As a yield-less asset, Gold tends to rise with lower interest rates, while higher cost of money usually weighs down on the yellow metal. Still, most moves depend on how the US Dollar (USD) behaves as the asset is priced in dollars (XAU/USD). A strong Dollar tends to keep the price of Gold controlled, whereas a weaker Dollar is likely to push Gold prices up.
-
04:31
GBP/JPY surges above the 182.00 mark following the BoJ rate decision
- GBP/JPY gains momentum around 182.15 after the BoJ rate decision.
- BoJ decided to keep the interest rate and 10-year JGB yield target at -0.1% and 0% respectively.
- The growing worries about a recession in the UK economy could weigh on the British Pound.
- Market players await the Bank of England (BoE) rate decision on Thursday.
The GBP/JPY cross surges above the 182.00 mark during the Asian trading hours on Tuesday. The cross picks up bids following the Bank of Japan (BoJ) policy announcements. Investors will shift their focus to the Bank of England (BoE) interest rate decision for fresh impetus. The British central bank is likely to maintain the rate on Thursday. The cross currently trades around 182.15, gaining 0.41% on the day.
On Tuesday, the BoJ decided to keep the interest rate and 10-year Japanese Government Bond (JGB) yield target at -0.1% and 0%, respectively, after its October meeting. However, the central bank decided to make YCC more flexible and changed the language around the 1.0% 10-year JGB yield cap.
On the other hand, the growing worries about a recession in the UK economy could weigh on the British Pound (GBP). That being said, soft labor demand, sluggish business activity, and weak consumer spending are likely to support the BoEo maintain the status quo at its November meeting.
Looking ahead, the attention will turn to the BoE rate decision on Thursday. The BoE officials' comments might offer hints about the future monetary policy path for the rest of the year. Traders will take more cues from these events and find trading opportunities around the GBP/JPY cross. -
03:54
EUR/JPY surges near 159.00 after BoJ policy decision
- EUR/JPY continues to gain ground on the dovish BoJ decision.
- Japan’s central bank kept its policy rate at -0.1%.
- Investors await a slew of economic data from the Eurozone to be released on Tuesday.
EUR/JPY extends its gains on the second successive day, trading higher around 158.90 during the Asian session on Tuesday. Bank of Japan (BoJ) kept its policy rates at -0.1% as widely expected, which contributes to pressure on the Japanese Yen (JPY).
The BoJ also released its quarterly outlook report following the October policy meeting, forecasting a moderate ongoing recovery for Japan's economy. The report suggests that inflation is expected to decelerate initially but could regain momentum as wages increase and inflation expectations rise.
However, the outlook is clouded by significant uncertainty, prompting a need for vigilance regarding financial and foreign exchange market movements and their potential impact on Japan's economy and prices.
Moreover, Japan’s Unemployment Rate for September reduced, as anticipated, to 2.6% from the previous reading of 2.7%. Retail Trade (YoY) for the said month, declined to 5.8% compared to the 5.9% expected and 7.0% previous readings.
The Eurozone revealed a sharp dip in Germany’s inflation, indicating that the recent decision by the European Central Bank (ECB) to hold rates might be the initial pause in a series. The preliminary Harmonized Index of Consumer Prices (MoM) for October declined by 0.2% against the expected growth of 0.1%, swinging from the growth of 0.2% in September. While, the yearly index showed a decline to 3.0% from 4.3% previously, lower than the expected 3.6%.
Additionally, Germany's GDP for Q3 contracted, although the contraction was less severe than anticipated, still showing a negative reading of 0.1% against the market consensus of 0.3% decline.
On Tuesday, investors will likely observe the upcoming reports from Germany on Retail Sales. Eurozone will release the Harmonized Index of Consumer Prices (HICP), Core HICP, and seasonally adjusted Gross Domestic Product (GDP).
-
03:39
BoJ Quarterly Outlook Report: Inflation likely to slow, then re-accelerate as wages rise
The Bank of Japan’s (BoJ) published its quarterly outlook report, following its October policy meeting, with key highlights noted below.
Key takeaways (via Reuters)
Japan's economy likely to continue recovering moderately.
Inflation likely to slow, then re-accelerate as wages rise, inflation expectations heighten.
Uncertainty over Japan's economic, price outlook very high .
Must be vigilant to financial, FX market moves and their impact on Japan's economy, prices.
Risks to price outlook skewed to upside for fiscal 2023.
Must scrutinize whether positive wage-inflation cycle will strengthen.
Inflation expectations heightening moderately.
Must be mindful that uncertainty regarding outlook is very high but trend inflation to gradually accelerate towards BoJ’s price target.
Board's core-core CPI fiscal 2023 median forecast at +3.8 % vs +3.2% in July.
Board's core-core CPI fiscal 2024 median forecast at +1.9% vs +1.7% in July.
Board's core-core CPI fiscal 2025 median forecast at +1.9% vs +1.8% in July.
Board's real GDP fiscal 2023 median forecast at +2.0% vs +1.3% in July.
Board's real GDP fiscal 2024 median forecast at +1.0% vs +1.2% in July.
Board's real GDP fiscal 2025 median forecast at +1.0% vs +1.0% in July.
Related reads
- Breaking: Bank of Japan holds interest rate, tweaks YCC language
- USD/JPY spikes to fresh daily top, retakes 150.00 mark after BoJ policy decision
-
03:37
USD/JPY spikes to fresh daily top, retakes 150.00 mark after BoJ policy decision
- USD/JPY attracts fresh buying on Tuesday and draws support from a combination of factors.
- Hawkish Fed expectations, along with elevated US bond yields, help revive the USD demand.
- The JPY weakens after the BoJ changed the language around YCC and maintained ultra-low rates.
The USD/JPY pair regains positive traction during the Asian session on Tuesday and snaps a two-day losing streak to the 148.80 area, or a two-week low touched the previous day. The buying interest picks up pace after the Bank of Japan (BoJ) announced its policy decision, pushing spot prices to the 150.00 psychological mark, or a fresh daily high in the last hour.
The Japanese central bank refrained from altering its yield curve control (YCC) policy, though changed language around the target range for the benchmark 10-year yield. The BoJ decides to keep the yield target but make 1% a reference cap. The move comes on the back of pressure from a sell-off in bond markets through October, which had lifted the yield on the 10-year JGB to a 10-year peak earlier this Tuesday. The BoJ, however, maintained its ultra-low interest rates despite an uptick in Japanese inflation. This continues to weigh on the Japanese Yen (JPY) and lends support to the USD/JPY pair.
The US Dollar (USD), on the other hand, attracts some dip-buying and recovers a part of the overnight slide amid elevated US Treasury bond yields, bolstered by expectations that the Federal Reserve (Fed) will stick to its hawkish stance. In fact, the markets seem convinced that the US central bank will tighten its monetary policy further in the wake of the resilient economy and still sticky inflation. This, in turn, suggests that the path of least resistance for the USD/JPY pair is to the upside, though bulls might wait for BoJ Governor Kazuo Ueda's post-meeting presser before placing fresh bets.
The market attention will then turn to the US economic docket, featuring the release of the Chicago PMI and the Conference Board's Consumer Confidence Index, due later during the early North American session. The focus, however, will remain glued to the outcome of the highly-anticipated two-day FOMC monetary policy meeting, scheduled to be announced on Wednesday. Investors will look for cues about the Fed's future rate-hike path, which will play a key role in influencing the near-term USD price dynamics and help determine the next leg of a directional move for the USD/JPY pair.
Technical levels to watch
-
03:27
Japan BoJ Interest Rate Decision meets forecasts (-0.1%)
-
02:57
USD/CAD looks to approach 1.3850 on downbeat Crude prices
- USD/CAD could revisit the yearly high on the back of weaker Crude oil prices.
- The decline in the Chinese PMI index could put pressure on the Oil-linked CAD.
- BoC Governor Macklem said that higher interest rates and subdued growth will have repercussions on the government's spending.
- The decline in US Treasury yields undermines the US Dollar.
USD/CAD retraces recent losses post retreating from a yearly high, trading higher near 1.3840 during the Asian session on Tuesday. The pair could receive upward support on the back of downbeat Crude oil prices. The weaker Chinese Purchasing Managers' Index (PMI) data could bring some pressure on the prices of Oil, which could reinforce the strength of the USD/CAD pair ahead of the policy decision from the US Federal Reserve (Fed) on Wednesday.
Bank of Canada (BoC) Governor Tiff Macklem conveyed to lawmakers in the House of Commons on Monday that the intersection of elevated interest rates and subdued growth will have repercussions on the government's spending. While acknowledging the country's sustainable fiscal position, Macklem emphasized the need to exercise restraint in expenditure to safeguard social programs in the face of these economic dynamics.
The anticipation that the US Federal Reserve will maintain its policy rate at 5.5% in the upcoming meeting is dampening the strength of the US Dollar (USD). Adding to this, the release of moderate economic data from the United States on Friday did little to bolster the Greenback.
Western Texas Intermediate (WTI) trades below $82.50 per barrel at the time of writing. Traders adopt a cautious approach before the upcoming US Fed policy meeting, overshadowing the support previously provided by tensions in the Middle East.
The twist in China's economic narrative came in September as the NBS Manufacturing Purchasing Managers' Index (PMI) unexpectedly contracted to 49.5, which was expected to remain consistent at the 50.2 expansion seen in July. The index slipping below the crucial 50 mark, signaling contraction, adds a layer of concern. Furthermore, the NBS Services PMI mirrored this trend, dropping to 50.6, compared to the expected 51.8 and the previous reading of 51.7. These shifts in both the manufacturing and services sectors raise concerns about the depressed economic conditions in China.
The US Dollar Index (DXY) retraces the recent losses ahead of the Fed decision, trading around 106.30 by the press time. The prevailing market expectation that the Fed will keep interest rates steady at 5.5% in the upcoming policy meeting is anticipated to provide support for US Treasury bonds. The increased demand for T-bills is pushing down US Treasury yields, exerting downward pressure on the Greenback.
Additionally, investors will also monitor key indicators such as the US ADP Employment Change and the ISM Manufacturing PMI for October for further cues on US economic situation.
-
02:38
NZD/USD ticks lower after weaker Chinese PMIs, remains below mid-0.5800s
- A combination of factors exerts some pressure on NZD/USD during the Asian session.
- Hawkish Fed expectations and Elevated US bond yields help revive the USD demand.
- The disappointing Chinese PMIs further contribute to the modest intraday downtick.
The NZD/USD pair ticks lower during the Asian session on Tuesday and erodes a part of the previous day's positive move, though lacks follow-through. Spot prices remain on the defensive below mid-0.5800s and react little to the disappointing release of Chinese PMI prints.
Data published by the National Bureau of Statistics (NBS) China’s official Manufacturing PMI unexpectedly fell into contraction territory in October and came in at 49.5 as compared to 50.2 in the previous month. Adding to this, the gauge for the services sector also fell short of consensus estimates and dropped to 50.6 from 51.7 in September. The data fueled uncertainty over the economic recovery in China, which, in turn, undermines antipodean currencies, including the New Zealand Dollar (NZD).
The US Dollar (USD), on the other hand, attracts some dip-buying on the back of elevated US Treasury bond yields, bolstered by hawkish Federal Reserve (Fed) expectations. This turns out to be another factor contributing to a mildly offered tone surrounding the NZD/USD pair. The downside, however, remains limited as traders seem reluctant to place aggressive bets and now look to the outcome of the highly-anticipated two-day FOMC monetary policy meeting before positioning for the near-term trajectory.
The US central bank is scheduled to announce its decision on Wednesday and is widely expected to maintain the status quo. The US economic resilience, along with still sticky inflation, however, keeps the door open for one more rate-hike by the end of this year. Hence, investors will closely scrutinise the accompanying policy statement and Fed Chair Jerome Powell's remarks at the post-meeting press conference for cues about the future rate-hike path, which will provide some impetus to the NZD/USD pair.
Heading into the key central bank event risk, Tuesday's US economic docket – featuring the release of the Chicago PMI and the Conference Board's Consumer Confidence Index – will be looked upon for short-term trading opportunities.
Technical levels to watch
-
02:31
USD/INR trades on a flat note amid global uncertainty
- Indian Rupee remains relatively quiet ahead of the FOMC meeting.
- A pullback in US Treasury bond yields and lower oil prices lift the Indian Rupee on Tuesday.
- Federal Open Market Committee's (FOMC) interest rate decision will be closely watched by traders.
Indian Rupee (INR) trades sideways on Tuesday amid multiple challenges. A pullback in US Treasury bond yields and lower oil prices lifts INR on the day. Nonetheless, the challenges from the Middle East geopolitical tension might boost safe-haven assets like the Greenback and act as a tailwind for the USD/INR pair.
Investors will monitor India’s Fiscal Deficit and Infrastructure Output data for September on Tuesday. The spotlight this week will be the highly-anticipated Federal Open Market Committee's (FOMC) interest rate decision on Wednesday. The markets anticipate the central bank to leave the interest rate unchanged at its November meeting.Daily Digest Market Movers: Indian Rupee remains sensitive to the geopolitical uncertainty
- Market players will monitor whether the RBI starts selling bonds via open market operations (OMO) this week as liquidity improves.
- India's foreign exchange reserves declined by $2.36B to $583.53B for the week ending October 20, according to the RBI.
- The US Dallas Fed Manufacturing Index fell to -19.2 in October from -18.1 drop in September.
- The US Core Personal Consumption Expenditure Index (PCE) arrived at 3.7% YoY in September from 3.8% in the previous reading, matching the market expectation, the headline PCE came in at 3.4% YoY vs the estimation of 3.4%.
- The Michigan Consumer Confidence Index improved to 63.8, better than expected.
- UoM inflation expectations for a one-year period are expected to grow by 4.2%, while for a five-year period are expected to remain steady at 3.0%.
- Foreign investors sold $1.67B in Indian equities in October, which might weigh on the Indian Rupee.
- RBI will continue to keep an eye on maintaining inflation at the 4% target.
- RBI forecasted that India's GDP would grow at a 6.5% annual rate in the current fiscal year.
- The International Monetary Fund (IMF) revised up its forecast growth rate for India to 6.3% in October.
- India’s Wholesale Price Index (WPI) for September, a gauge of inflation, dropped -0.26% YoY versus 0.52% prior, below the market consensus of 0.50%.
Technical Analysis: The Indian Rupee trades flat with a slight negative bias
The Indian Rupee trades around a flatline on the day. The USD/INR pair remains confined within a range of 83.00–83.35. The upward outlook of USD/INR remains intact as the pair holds above the 100- and 200-day Exponential Moving Averages (EMA) on the daily chart.
Any decisive follow-through buying above the upper boundary of the trading range of 83.35 will see a rally to year-to-date (YTD) highs of 83.45. Further north, the next upside barrier at a psychological round mark at 84.00. On the flip side, the key support level is seen at 83.00, representing the confluence of a low of October 20 and a round mark. A breach below the 83.00 mark could see a drop to 82.82 (low of September 12), en route to 82.65 (low of August 4).US Dollar price in the last 7 days
The table below shows the percentage change of US Dollar (USD) against listed major currencies in the last 7 days. US Dollar was the strongest against the Swiss Franc.
USD EUR GBP CAD AUD JPY NZD CHF USD 0.62% 0.81% 1.09% -0.41% -0.17% 0.23% 1.29% EUR -0.62% 0.17% 0.47% -1.04% -0.79% -0.40% 0.68% GBP -0.81% -0.20% 0.27% -1.23% -0.99% -0.57% 0.47% CAD -1.09% -0.46% -0.27% -1.48% -1.27% -0.84% 0.20% AUD 0.39% 1.01% 1.22% 1.47% 0.22% 0.62% 1.67% JPY 0.16% 0.78% 0.98% 1.26% -0.22% 0.40% 1.45% NZD -0.23% 0.39% 0.57% 0.85% -0.63% -0.41% 1.04% CHF -1.30% -0.67% -0.48% -0.20% -1.69% -1.47% -1.05% The heat map shows percentage changes of major currencies against each other. The base currency is picked from the left column, while the quote currency is picked from the top row. For example, if you pick the Euro from the left column and move along the horizontal line to the Japanese Yen, the percentage change displayed in the box will represent EUR (base)/JPY (quote).
Indian Rupee FAQs
What are the key factors driving the Indian Rupee?
The Indian Rupee (INR) is one of the most sensitive currencies to external factors. The price of Crude Oil (the country is highly dependent on imported Oil), the value of the US Dollar – most trade is conducted in USD – and the level of foreign investment, are all influential. Direct intervention by the Reserve Bank of India (RBI) in FX markets to keep the exchange rate stable, as well as the level of interest rates set by the RBI, are further major influencing factors on the Rupee.
How do the decisions of the Reserve Bank of India impact the Indian Rupee?
The Reserve Bank of India (RBI) actively intervenes in forex markets to maintain a stable exchange rate, to help facilitate trade. In addition, the RBI tries to maintain the inflation rate at its 4% target by adjusting interest rates. Higher interest rates usually strengthen the Rupee. This is due to the role of the ‘carry trade’ in which investors borrow in countries with lower interest rates so as to place their money in countries’ offering relatively higher interest rates and profit from the difference.
What macroeconomic factors influence the value of the Indian Rupee?
Macroeconomic factors that influence the value of the Rupee include inflation, interest rates, the economic growth rate (GDP), the balance of trade, and inflows from foreign investment. A higher growth rate can lead to more overseas investment, pushing up demand for the Rupee. A less negative balance of trade will eventually lead to a stronger Rupee. Higher interest rates, especially real rates (interest rates less inflation) are also positive for the Rupee. A risk-on environment can lead to greater inflows of Foreign Direct and Indirect Investment (FDI and FII), which also benefit the Rupee.
How does inflation impact the Indian Rupee?
Higher inflation, particularly, if it is comparatively higher than India’s peers, is generally negative for the currency as it reflects devaluation through oversupply. Inflation also increases the cost of exports, leading to more Rupees being sold to purchase foreign imports, which is Rupee-negative. At the same time, higher inflation usually leads to the Reserve Bank of India (RBI) raising interest rates and this can be positive for the Rupee, due to increased demand from international investors. The opposite effect is true of lower inflation.
-
02:30
Commodities. Daily history for Monday, October 30, 2023
Raw materials Closed Change, % Silver 23.316 1.01 Gold 1996.286 -0.33 Palladium 1125.74 0.35 -
02:02
GBP/USD hangs near daily low, around mid-1.2100s amid reviving USD demand
- GBP/USD struggles to capitalize on the overnight positive move amid a modest USD strength.
- Expectations that the BoE is done raising interest rates contribute to the intraday downtick.
- The downside seems cushioned ahead of the FOMC on Wednesday and the BoE on Thursday.
The GBP/USD pair edges lower during the Asian session on Tuesday and reverses a part of the previous day's goodish move up of over 85 pips from sub-1.2100 levels. Spot prices currently trade around the 1.2155 region, down just over 0.10% for the day and well within a familiar range held over the past week or so.
Traders seem reluctant to place aggressive directional bets and prefer to wait on the sidelines ahead of this week's key central bank event risks - the FOMC policy decision on Wednesday, followed by the Bank of England (BoE) meeting on Thursday. In the meantime, expectations that the Federal Reserve (Fed) will stick to its hawkish stance remain supportive of elevated US Treasury bond yields and help revive the US Dollar (USD) demand, which, in turn, is seen exerting some pressure on the GBP/USD pair.
The US economic resilience, along with still sticky inflation, gives the Fed headroom to keep interest rates higher for longer. In fact, the markets are still pricing in the possibility of one more rate hike by the end of this year. In contrast, the BoE is expected to leave its benchmark interest rate on hold at a 15-year high of 5.25% for the second successive time to support the ailing economy. This, in turn, favours bearish traders and suggests that the path of least resistance for the GBP/USD pair is to the downside.
Moving ahead, there isn't any relevant market-moving economic data due for release from the UK, leaving spot prices at the mercy of the USD price dynamics. Later during the early North American session, traders will take cues from the US economic docket, featuring the Chicago PMI and the Conference Board's Consumer Confindence Index. Apart from this, the US bond yields will drive the USD demand and contribute to producing short-term trading opportunities around the GBP/USD pair.
Technical levels to watch
-
01:47
Australian Dollar maintains its position above the major level post recent gains
- Australian Dollar's consolidates after recent gains post stronger Retail Sales.
- Australia’s central bank is expected to raise policy rates; contributing support for the AUD.
- Chinese report revealed a decline in both manufacturing and non-manufacturing PMI for September.
The Australian Dollar (AUD) aims to halt a three-day winning streak on Tuesday. The rebound in US Dollar (USD) is weighing on the AUD/USD pair. However, the positive Australian Retail Sales contributed support for the Aussie pair ahead of the policy decision from the US Federal Reserve (Fed) on Wednesday. Moreover, the Reserve Bank of Australia (RBA) is set to release its policy decision on November 7.
Australia’s central bank is expected to raise interest rates by 25 basis points at its upcoming meeting on the back of elevated inflation. In the week before, Australia's Consumer Price Index (CPI) revealed an expansion in the third quarter of 2023, surpassing the increase seen in the second quarter. Furthermore, the seasonally adjusted Retail Sales (Month-on-Month) pleasantly surprised the market, posting a notably higher reading in September.
The Tuesday Chinese report revealed a decline in both manufacturing and non-manufacturing Manufacturing Purchasing Managers' Index (PMI) for September, heightening concerns about the sluggish economic conditions in the world's second-largest economy. This development raises the possibility of an impact on the Australian Dollar, given Australia's status as the largest trading partner of China.
The US Dollar Index (DXY) retraces recent losses on the back of upbeat US Treasury yields. The moderate economic data from the United States (US) released on Friday failed to provide any support for the Greenback as the market participants expect the Fed to keep its interest rates unchanged in the upcoming meeting.
However, the December’s meeting will be data-driven. As per the CME Fedwatch tools, Markets factor in a 23% probability of the Fed hiking 25 basis points (bps) in the December meeting.
Daily Digest Market Movers: Australian Dollar consolidates post recent gains ahead of Fed policy decision
Australia's Retail Sales (Month-on-Month) soared to 0.9% in September, surpassing market expectations of 0.3% and the previous figure of 0.2%.
Australia’s Producer Price Index (PPI) exhibited a modest easing, dropping to 3.8% on a yearly basis in Q3, compared to the previous quarter's 3.9%. On a quarterly basis, the nation's PPI experienced a significant rise to 1.8%, up from the previous reading of 0.5%.
Australian Consumer Price Index (CPI) for the third quarter of 2023 reached 1.2%, exceeding both the 0.8% uptick in the previous quarter and the market consensus of 1.1% for the same period.
The Reserve Bank of Australia stated heightened concern about the inflation impact stemming from supply shocks. Governor of the Reserve Bank of Australia, Michele Bullock stated that if inflation persists above projections, the RBA will take responsive policy measures. There is an observable deceleration in demand, and per capita consumption is on the decline.
China's NBS Manufacturing Purchasing Managers' Index (PMI) took an unexpected turn in September, contracting to 49.5, down from the 50.2 expansion observed in July and falling short of the market consensus of 50.2. Additionally, the NBS Services PMI also experienced a decline, dropping to 50.6 in September compared to the anticipated figure of 51.8 and the previous reading of 51.7.
According to reports, there's a tentative agreement between the US and China for a meeting between Presidents Joe Biden and Xi Jinping in November. This comes after months of strategic diplomatic efforts to mend relations.
US Core Personal Consumption Expenditures Price Index (YoY) declined to 3.7% in September from the previous reading of 3.8%. However, the monthly index increased to 0.3%, as anticipated from 0.1% previously.
The University of Michigan Consumer Index exceeded expectations in October, reporting a figure of 63.8, which was expected to remain consistent at 63.0.
The market sentiment leans towards the anticipation of no changes to interest rates by the US Federal Reserve (Fed) in the upcoming meeting on Wednesday.
Investors will focus on the US ADP Employment Change, ISM Manufacturing PMI for October during the week, along with the Fed Interest Rate Decision on Wednesday.
Technical Analysis: Australian Dollar hovers above the key support level at 0.6350
The Australian Dollar holds steady around 0.6370, in harmony with significant support at 0.6350. The yearly low at 0.6270 may serve as a key support, aligned with the major level around 0.6250. Looking upward, the pivotal resistance at 0.6400 is noteworthy, accompanied by the 50-day Exponential Moving Average (EMA) at 0.6405. A successful breach above this resistance could propel the currency towards the 23.6% Fibonacci retracement level at 0.6417.
AUD/USD: Daily Chart:
Australian Dollar price today
The table below shows the percentage change of Australian Dollar (AUD) against listed major currencies today. Australian Dollar was the strongest against the Japanese Yen.
USD EUR GBP CAD AUD JPY NZD CHF USD 0.10% 0.12% 0.09% 0.14% 0.25% 0.10% 0.00% EUR -0.11% 0.03% 0.02% 0.03% 0.15% -0.01% -0.10% GBP -0.13% -0.04% -0.02% -0.01% 0.11% -0.03% -0.13% CAD -0.10% 0.03% 0.04% 0.05% 0.17% 0.02% -0.09% AUD -0.13% -0.02% 0.02% 0.00% 0.12% -0.03% -0.13% JPY -0.24% -0.14% -0.13% -0.18% -0.12% -0.15% -0.25% NZD -0.09% 0.02% 0.06% 0.03% 0.03% 0.16% -0.11% CHF 0.00% 0.09% 0.12% 0.09% 0.12% 0.25% 0.10% The heat map shows percentage changes of major currencies against each other. The base currency is picked from the left column, while the quote currency is picked from the top row. For example, if you pick the Euro from the left column and move along the horizontal line to the Japanese Yen, the percentage change displayed in the box will represent EUR (base)/JPY (quote).
Australian Dollar FAQs
What key factors drive the Australian Dollar?
One of the most significant factors for the Australian Dollar (AUD) is the level of interest rates set by the Reserve Bank of Australia (RBA). Because Australia is a resource-rich country another key driver is the price of its biggest export, Iron Ore. The health of the Chinese economy, its largest trading partner, is a factor, as well as inflation in Australia, its growth rate and Trade Balance. Market sentiment – whether investors are taking on more risky assets (risk-on) or seeking safe-havens (risk-off) – is also a factor, with risk-on positive for AUD.
How do the decisions of the Reserve Bank of Australia impact the Australian Dollar?
The Reserve Bank of Australia (RBA) influences the Australian Dollar (AUD) by setting the level of interest rates that Australian banks can lend to each other. This influences the level of interest rates in the economy as a whole. The main goal of the RBA is to maintain a stable inflation rate of 2-3% by adjusting interest rates up or down. Relatively high interest rates compared to other major central banks support the AUD, and the opposite for relatively low. The RBA can also use quantitative easing and tightening to influence credit conditions, with the former AUD-negative and the latter AUD-positive.
How does the health of the Chinese Economy impact the Australian Dollar?
China is Australia’s largest trading partner so the health of the Chinese economy is a major influence on the value of the Australian Dollar (AUD). When the Chinese economy is doing well it purchases more raw materials, goods and services from Australia, lifting demand for the AUD, and pushing up its value. The opposite is the case when the Chinese economy is not growing as fast as expected. Positive or negative surprises in Chinese growth data, therefore, often have a direct impact on the Australian Dollar and its pairs.
How does the price of Iron Ore impact the Australian Dollar?
Iron Ore is Australia’s largest export, accounting for $118 billion a year according to data from 2021, with China as its primary destination. The price of Iron Ore, therefore, can be a driver of the Australian Dollar. Generally, if the price of Iron Ore rises, AUD also goes up, as aggregate demand for the currency increases. The opposite is the case if the price of Iron Ore falls. Higher Iron Ore prices also tend to result in a greater likelihood of a positive Trade Balance for Australia, which is also positive of the AUD.
How does the Trade Balance impact the Australian Dollar?
The Trade Balance, which is the difference between what a country earns from its exports versus what it pays for its imports, is another factor that can influence the value of the Australian Dollar. If Australia produces highly sought after exports, then its currency will gain in value purely from the surplus demand created from foreign buyers seeking to purchase its exports versus what it spends to purchase imports. Therefore, a positive net Trade Balance strengthens the AUD, with the opposite effect if the Trade Balance is negative.
-
01:32
China's NBS Manufacturing PMI contracts to 49.5 in September vs. 50.2 expected
China’s official Manufacturing Purchasing Managers' Index (PMI) unexpectedly contracted in September, arriving at 49.5 when compared to the 50.2 expansion in July, the latest data published by the country’s National Bureau of Statistics (NBS) showed on Tuesday. The market consensus was for a 50.2 figure.
The index dropped back below the 50 mark, which separates expansion from contraction.
The NBS Services PMI declined to 50.6 in September versus the expected 51.8 figure and 51.7 previous.
AUD/USD reaction to China's PMI data
The downbeat Chinese PMIs weigh on the Australian Dollar, with AUD/USD testing lows near 0.6360. The spot is down 0.13% on the day.
-
01:30
China NBS Non-Manufacturing PMI registered at 50.6, below expectations (51.8) in September
-
01:30
China NBS Manufacturing PMI registered at 49.5, below expectations (50.2) in September
-
01:05
EUR/USD remains on the defensive, trades just above 1.0600 mark ahead of Eurozone CPI
- EUR/USD ticks lower during the Asian session amid the emergence of some USD dip-buying.
- Expectations that the ECB is done raising rates further contribute to capping gains for the pair.
- Traders now look to the flash Eurozone CPI print for some impetus ahead of the US macro data.
The EUR/USD pair struggles to capitalize on the previous day's positive move and trades with a mild negative bias during the Asian session on Tuesday. Spot prices, however, manage to hold above the 1.0600 round figure and remain at the mercy of the US Dollar (USD) price dynamics.
The prospects for further tightening by the Federal Reserve (Fed) remain supportive of elevated US Treasury bond yield and assist the USD in attracting some dip-buying, which, in turn, is seen acting as a headwind for the EUR/USD pair. This, along with expectations that additional rate
hikes by the European Central Bank (ECB) may be off the table, further contributing to capping spot prices.The bets were reaffirmed by data showing that German consumer inflation decelerated from the 4.3% YoY rate to 3.0% in October – marking its lowest level since August 2021. This comes on top of looming recession risks and suggests that the ECB's rate-hiking cycle might have already ended. In contrast, the markets are pricing in the possibility of one more rate hike by the Federal Reserve (Fed) in 2023.
Investors seem convinced that the Fed will stick to its hawkish stance in the wake of the US economic resilience and still sticky inflation. Hence, the focus will remain glued to the outcome of the highly-anticipated two-day FOMC monetary policy meeting. The US central bank will announce its decision on Wednesday and is widely anticipated to maintain the status quo for the second straight meeting.
Market participants, meanwhile, will look for cues about the Fed's future rate-hike path, which will influence the USD price dynamics and provide a fresh impetus to the EUR/USD pair. In the meantime, Tuesday's release of the flash Eurozone CPI will be looked upon for short-term opportunities ahead of the US macro data – Chicago PMI and the Conference Board's Consumer Confidence Index.
Technical levels to watch
-
00:54
Japan’s PM Kishida: Will refrain from commenting on media report on BoJ policy meeting
Japanese Prime Minister Fumio Kishida crossed the wires in the last hour and refrained from commenting on media reports that the Bank of Japan (BoJ) is set to allow 10-year Japanese government bond (JGB) yields to rise above 1%. The BoJ is scheduled to announce its policy decision this Tuesday and the announcement is expected to infuse some volatility across the JPY pairs.
Key Quotes:
Must continue to work with BoJ on economic policy.
Aware of media reports on BoJ policy meeting but will refrain from commenting.
Currencies have a big impact on measuring the size of the economy. -
00:53
Gold Price Forecast: XAU/USD remains capped below the $2,000 barrier, Chinese PMI data looms
- Gold price remains capped below the $2,000 barrier in the Asian session on Monday.
- The weaker US Dollar and a pullback in US Treasury bond yields might lift the gold price.
- Federal Reserve (Fed) Chair Jerome Powell affirmed that the Fed would maintain the rate steady at the November meeting.
- Market players await Chinese PMI data ahead of the Fed rate decision on Wednesday.
Gold price (XAU/USD) consolidates below the $2,000 psychological mark during the early Asian session on Monday. The correction of the US Dollar (USD) and a pullback in US Treasury bond yields lend some support to the yellow metal. Gold price currently trades around $1,996, up 0.07% for the day.
Meanwhile, the US Dollar Index (DXY), the value of the USD relative to a basket of global currencies, drops to 106.20 after retracing from the weekly high of 106.70. The US Treasury bond yield moves a little, with the 10-year Treasury bond yield hovering around 4.90%.
Last week, the Federal Reserve (Fed) Chair Jerome Powell affirmed that the Fed would maintain the rate steady at its upcoming meeting on Wednesday, but whether they will hold the rate for December will depend on the incoming data. Powell added that the additional rate hike is possible if high economic growth and a labor shortage continue. This, in turn, might cap the upside of gold. It's worth noting that rising interest rates raise the opportunity cost of investing in non-yielding assets, implying a negative outlook for precious metals.
Furthermore, investors will monitor the Chinese PMI data on Tuesday. China’s Manufacturing PMI is estimated to remain in expansionary territory by growing to 50.2, while Non-Manufacturing PMI is expected to rise to 51.8. The stronger-than-expected data might boost the gold price as China is the world's largest gold producer and consumer.
Looking ahead, the US Housing Price Index and Consumer Confidence are due on Tuesday. The attention will shift to the Fed interest rate decision and the Press Conference on Wednesday will be closely watched. Traders will take cues from the events and find trading opportunities around the USD/JPY pair. -
00:31
Australia Private Sector Credit (YoY) declined to 4.9% in September from previous 5.1%
-
00:30
Australia Private Sector Credit (MoM) rose from previous 0.4% to 0.5% in September
-
00:30
Stocks. Daily history for Monday, October 30, 2023
Index Change, points Closed Change, % NIKKEI 225 -294.73 30696.96 -0.95 Hang Seng 7.63 17406.36 0.04 KOSPI 7.74 2310.55 0.34 ASX 200 -54 6772.9 -0.79 DAX 29.13 14716.54 0.2 CAC 40 29.69 6825.07 0.44 Dow Jones 511.37 32928.96 1.58 S&P 500 49.45 4166.82 1.2 NASDAQ Composite 146.47 12789.48 1.16 -
00:19
Japan's JGB 10 year yield hits 0.958%, highest since May 2013
Early Tuesday, the Japanese 10-year Government Bond Yield (JGB) reached 0.958%, the highest since May 2013.
Market reaction
The USD/JPY pair is trading at 149.30, up 0.14% on the day, as of writing.
-
00:15
Currencies. Daily history for Monday, October 30, 2023
Pare Closed Change, % AUDUSD 0.63716 0.56 EURJPY 158.179 0.07 EURUSD 1.0614 0.47 GBPJPY 181.341 -0 GBPUSD 1.21662 0.38 NZDUSD 0.5841 0.54 USDCAD 1.38235 -0.33 USDCHF 0.90161 -0.02 USDJPY 149.036 -0.39 -
00:05
United Kingdom BRC Shop Price Index (YoY): 5.2% (September) vs previous 6.2%
-
00:01
Japan Large Retailer Sales declined to 5% in September from previous 6%
-
00:01
Ireland Consumer Confidence: 60.4 (September) vs 58.8
-
00:00
New Zealand ANZ Business Confidence climbed from previous 1.5 to 23.4 in October
-
00:00
New Zealand ANZ Activity Outlook: 23.1% (October) vs 10.9%
-