Market news
26 tháng 2 2018
-
23:27
Currencies. Daily history for Feb 26’2018:
(raw materials / closing price /% change)
Oil 64.00 +0.71%
Gold 1,334.90 +0.35%
-
09:27
Crude oil Analysis
Crude oil Analysis
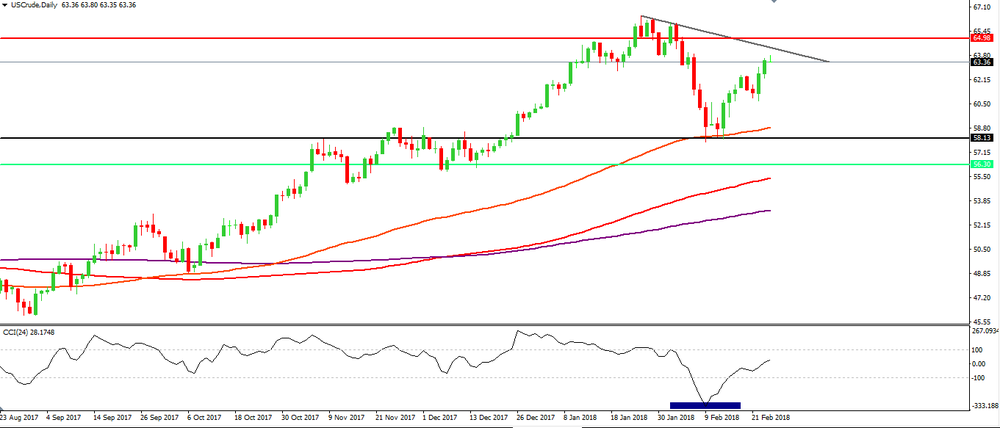
On daily time frame chart we can see that the price is (again) close to the downside trend line.
This trend line may be interesting for entry opportunities because if the price starts to reject it as it did the last few times then it might be interesting for short entries.
On the other hand, if the price breaks that same line, then we can also consider a good opportunity for long entries.
Note that in weekly time frame chart we are faced with an inverted head and shoulders - Chart Pattern
-
Market Focus
 Material posted here is solely for information purposes and reliance on this may lead to losses. Past performances are not a reliable indicator of future results. Please read our full disclaimer
Open Demo Account & Personal Page