- USD/CAD Daily time frame chart
Market news
10 November 2017
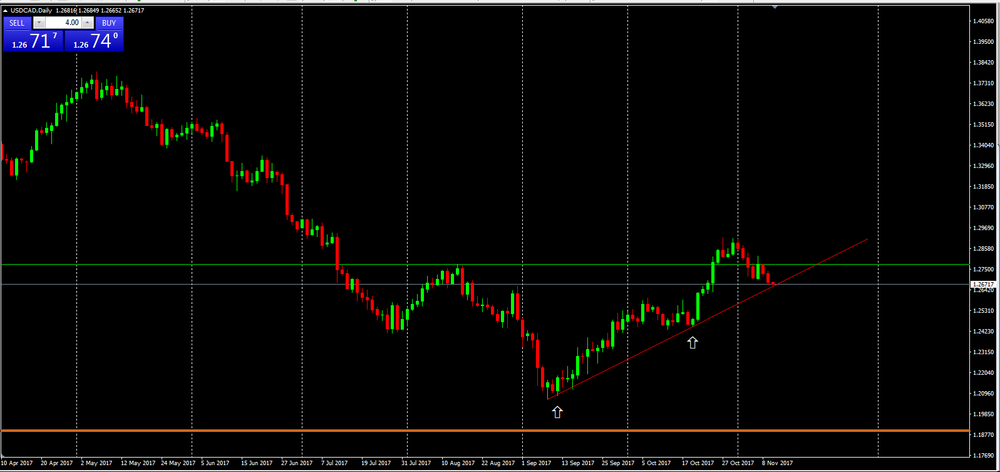
USD/CAD Daily time frame chart
As we can see on daily time frame chart, the price is now close to the upside trend line.
Besides that, we can see as well that, for the 3rdtime, the price is touching the trend line and if it confirms that touch we might see a new bullish movement to new highs or close to the previous one.
However, if the price of Crude Oil still bullish and, until now, there has been no tendency for a slowdown or a reversal of trend.
This correlation between Oil and CAD might help CAD gain strenght against U.S dollar.
Therefore, if the price breaks the upside trend line so we might see a strong depreciation on USD/CAD
Market Focus
Open Demo Account & Personal Page