- AUD/JPY Daily time frame chart
Market news
14 December 2017
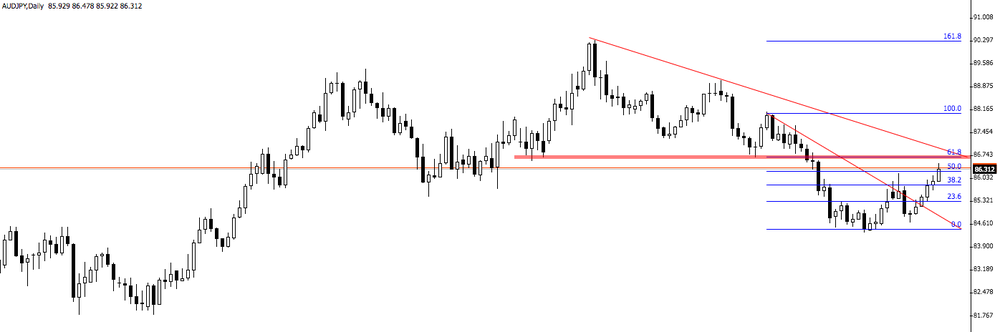
AUD/JPY Daily time frame chart
As we can see on daily time frame, the price is close to the resistance level, the downside trend line and the fibonacci's level 61.8%.
Therefore, and if the price starts to reject these barriers then we can expect a new bearish movement on this pair.
Market Focus
Open Demo Account & Personal Page