- Nikkei 225 Daily time frame chart
Market news
14 December 2017
Nikkei 225 Daily time frame chart
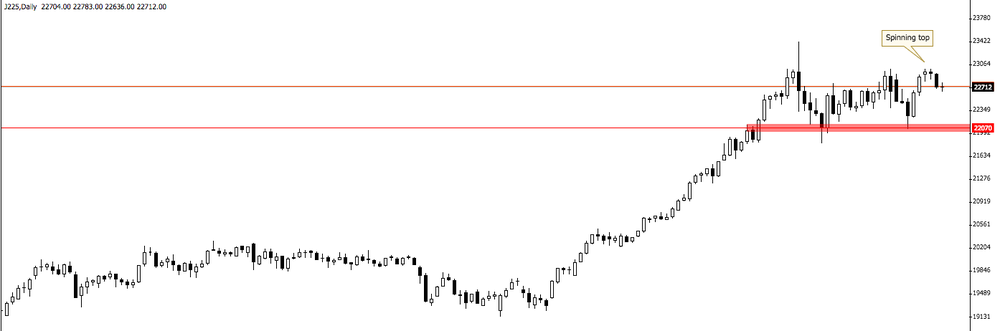
On daily time frame chart we can see that there is a candlestick pattern "spinning top" which might indicate a reversal trend.
In this case, it could be a good opportunity to enter short with targets close to the support level at 22070
In this case, it could be a good opportunity to enter short with targets close to the support level at 22070
Market Focus
Open Demo Account & Personal Page