Market news
-
22:27
Currencies. Daily history for Sep 05’2017:
(pare/closed(GMT +3)/change, %)
EUR/USD $1,1912 +0,14%
GBP/USD $1,3032 +0,81%
USD/CHF Chf0,95497 -0,27%
USD/JPY Y108,72 -0,88%
EUR/JPY Y129,52 -0,74%
GBP/JPY Y141,693 -0,06%
AUD/USD $0,7995 +0,63%
NZD/USD $0,7240 +1,12%
USD/CAD C$1,23763 -0,28%
-
21:55
Schedule for today, Wednesday, Sep 06’2017 (GMT0)
00:00 Japan Labor Cash Earnings, YoY July -0.4% 0.5%
01:30 Australia Gross Domestic Product (QoQ) Quarter II 0.3% 0.8%
01:30 Australia Gross Domestic Product (YoY) Quarter II 1.7% 1.8%
06:00 Germany Factory Orders s.a. (MoM) July 1.0% 0.1%
12:30 Canada Labor Productivity Quarter II 1.4%
12:30 Canada Trade balance, billions July -3.60 -3.3
12:30 U.S. International Trade, bln July -43.6 -44.6
13:45 U.S. Services PMI (Finally) August 54.7 56.9
14:00 Canada Bank of Canada Rate 0.75% 0.75%
14:00 Canada BOC Rate Statement
14:00 U.S. ISM Non-Manufacturing August 53.9 55.3
19:00 U.S. Fed's Beige Book
23:30 Australia AiG Performance of Construction Index August 60.5
-
14:25
U.S. 30-year treasury bond prices add to earlier gains, rise 1 point; 30-year yield hits session low at 2.719 pct
-
14:09
US factory orders for manufactured durable goods in July decreased $16.7 billion
New orders for manufactured durable goods in July decreased $16.7 billion or 6.8 percent to $229.2 billion, the U.S. Census Bureau announced today. This decrease, down three of the last four months, followed a 6.4 percent June increase. Excluding transportation, new orders increased 0.5 percent. Excluding defense, new orders decreased 7.8 percent. Transportation equipment, also down three of the last four months, drove the decrease, $17.4 billion or 19.0 percent to $74.3 billion.
Shipments of manufactured durable goods in July, up three consecutive months, increased $1.0 billion or 0.4 percent to $237.4 billion. This followed a virtually unchanged June increase. Transportation equipment, up two of the last three months, led the increase, $0.4 billion or 0.5 percent to $79.2 billion.
-
14:00
U.S.: Factory Orders , July -3.3% (forecast -3.2%)
-
13:47
Fed's Brainard: should be cautious on rate hikes given long period of low inflation
-
Cites 'extremely welcome' positive shifts in economic outlooks of europe, japan, canada, china
-
Downside economic risks to u.S. From abroad have dissipated
-
Monetary policy should not be first line of defense against financial imbalances
-
Expects 'short lived' effects from hurricane in monthly U.S. payrolls
-
Inflation 'well short' of objective
-
-
13:07
Forex option contracts rolling off today at 14.00 GMT:
EURUSD: 1.1800 (EUR 670m) 1.1850 (695m) 1.1875 (730m) 1.2000 (1.5bln)
USDJPY: 110.00 (USD 405m)
GBPUSD:1.2940 (GBP 200m) 1.3000 (525m)
EURGBP: 0.9200 (EUR 1.5bln)
-
12:54
I am allowing Japan & South Korea to buy a substantially increased amount of highly sophisticated military equipment from the United States. @realDonaldTrump
-
12:49
Hurricane Irma strengthens to a Category 5 storm as it approaches northeast Caribbean on path toward U.S. @AP
-
12:25
Trump tells congress on immigration: "Get ready to do your job - DACA!" referring to deferred action for childhood arrivals
-
11:40
"The U.S. will receive more gift packages from my country as long as it relies on reckless provocations and futile attempts to put pressure on the DPRK" - North Korea envoy
-
09:01
The volume of retail trade fell by 0.3% in the euro area (EA19) and by 0.2% in the EU28
In July 2017 compared with June 2017, the seasonally adjusted volume of retail trade fell by 0.3% in the euro area (EA19) and by 0.2% in the EU28, according to estimates from Eurostat, the statistical office of the European Union. In June, the retail trade volume increased by 0.6% in the euro area and by 0.5% in the EU28. In July 2017 compared with July 2016, the calendar adjusted retail sales index increased by 2.6% in the euro area and by 2.7% in the EU28.
The 0.3% decrease in the volume of retail trade in the euro area in July 2017, compared with June 2017, is due to falls of 0.9% for automotive fuel and of 0.5% for "Food, drinks and tobacco", while non-food products rose by 0.1%. In the EU28, the 0.2% fall in the volume of retail trade is due to decreases of 0.6% for automotive fuel and of 0.2% for "Food, drinks and tobacco", while non-food products remained stable. Among Member States for which data are available, the largest decreases in the total retail trade volume were registered in Germany (-1.2%), Croatia (-1.1%), Estonia and Austria (both -1.0%), while the highest increases were observed in Slovenia (+1.4%), Romania and Sweden (both +1.2%).
-
09:00
Eurozone: Retail Sales (MoM), July -0.3% (forecast -0.2%)
-
09:00
Eurozone: Retail Sales (YoY), July 2.6% (forecast 2.5%)
-
08:41
UK service providers recorded solid rises in business activity and incoming new work during August
UK service providers recorded solid rises in business activity and incoming new work during August, but rates of growth eased since July and remained notably weaker than seen on average in the first half of 2017. The latest survey also pointed to stronger cost pressures across the service sector, with the rate of input price inflation the fastest since February. Higher staff costs, fuel bills and prices for imported items contributed to another solid increase in average prices charged by service providers in August.
At 53.2 in August, the headline seasonally adjusted IHS Markit/CIPS Services PMI Business Activity Index registered above the 50.0 nochange value for the thirteenth consecutive month. However, the index dropped from 53.8 in July and signalled the slowest pace of business activity expansion since September 2016.
-
08:30
United Kingdom: Purchasing Manager Index Services, August 53.2 (forecast 53.5)
-
08:03
The German service sector remained in expansion mode in August, according to the latest PMI survey data from IHS Markit
Moreover, rates of growth in both total business activity and new contracts picked up from ten-month lows in July. Less positively, employment growth eased to a 16- month low and business expectations were the weakest in 2017 so far. Price pressures strengthened to a five-month high in the latest survey.
Commenting on the final PMI survey data, Trevor Balchin, Director, Economics at IHS Markit said: "The final PMI data for August confirmed the earlier flash estimate of a partial rebound in German growth following a slowdown in July. The Composite Output Index rose to 55.8 and new business expansion also strengthened. "The latest PMI data follow the official estimate of GDP expansion in the second quarter of 0.6% qr/qr and an upward revision for the first quarter to 0.7% qr/qr. Moreover, full-year growth in 2016 was also revised up to 1.9% in calendar-adjusted terms. "IHS Markit has increased its growth forecasts for 2017 and 2018 to 2.3% and 2.1% respectively (calendar-adjusted).
-
08:02
Eurozone economic growth remained solid and steady in August
This was signalled by the final IHS Markit Eurozone PMI Composite Output Index matching July's reading of 55.7, down only marginally from the flash estimate of 55.8.
On current trend, output growth so far in the third quarter is slightly below its second quarter high, but remains among the best seen over the past seven years. August saw a strong expansion of manufacturing production, with the pace of increase regaining most of the momentum ceded in July. Service sector activity growth eased to a sevenmonth low, but remained above its long-term trend.
-
08:00
Eurozone: Services PMI, August 54.7 (forecast 54.9)
-
07:55
Germany: Services PMI, August 53.5 (forecast 53.4)
-
07:50
France: Services PMI, August 54.9 (forecast 55.5)
-
07:26
Growth remained marked in the Spanish service sector during August says Markit
Although rates of expansion in business activity and new orders both eased, the rate of job creation was the strongest since prior to the global financial crisis. Higher staff costs led to a faster pace of input price inflation, while companies continued to raise their output prices modestly. Service providers remained confident that activity will rise over the coming year, despite sentiment easing.
The headline seasonally adjusted Business Activity Index posted 56.0 in August, down from 57.6 in July and signalling the weakest rise in service sector output since January. That said, activity continued to increase at a sharp pace, with growth recorded for the forty-sixth successive month. Respondents indicated that higher new orders was the main factor leading activity to rise.
-
07:15
Switzerland: Consumer Price Index (MoM) , August 0.0% (forecast 0%)
-
07:15
Switzerland: Consumer Price Index (YoY), August 0.5% (forecast 0.5%)
-
06:02
Reserve Bank of Australia says employment has been stronger over recent months, forward looking indicators strong. Held interest rate at 1.50%
-
RBA says rising AUD would lead to slower econmic growth than otherwise
-
Judged steady policy consistent with growth, inflation targets
-
Global economy continuing to improve
-
Growth expected to pick up gradually over the coming years
-
House prices rising briskly in some markets
-
Higher AUD is restraining price pressures
-
Expects gradual increase in underlying inflation
-
Housing debt has outpaced slow growth in incomes
-
Some signs housing market starting to cool
-
Drag following mining investment boom almost complete
-
-
05:56
Chinese business activity growth picked up for the second month in a row during August - Markit
The Caixin China Composite PMI data (which covers both manufacturing and services) indicated that Chinese business activity growth picked up for the second month in a row during August. Furthermore, the latest expansion of activity was the strongest seen for six months, as shown by the Composite Output Index posting 52.4, up from 51.9 in July.
August data revealed that the latest expansion of overall business activity was underpinned by increased activity at both manufacturers and services providers. Notably, services companies registered the quickest upturn in business activity for three months. This was highlighted by the seasonally adjusted Caixin China General Services Business Activity Index rising from 51.5 in July to 52.7. At the same time, goods producers noted a further modest increase in output that was little-changed from that seen in the previous month
-
05:53
Switzerland’s GDP grew by 0.3% in the 2nd quarter of 2017
Switzerland's GDP grew by 0.3% in the 2nd quarter of 2017, which is a slight acceleration compared to the previous quarter (revised from +0.3 % to +0.1 %). On the production side of GDP, both the industrial sectors and some service sectors contributed to growth in the 2nd quarter.
Manufacturing (+0.9%) grew again at a rate above the historical average, but was not able to keep up with the strong performance of the previous quarter. Moreover, value added in-creased markedly in the energy sector (+2.2 %). Two important service sectors also grew considerably in the 2nd quarter: the hotel and catering industry (+3.4 %), which had expanded only slightly in the previous quarter, and the financial sector (+2.7 %), which, after a decline in the 1st quarter, was able to resume the positive trend of the second half of 2016. However, some other service sectors performed only poorly. Value added fell slightly in trade (-0.2 %), public administration (-0.1 %) and the healthcare sector (-0.1 %), and stagnated in business services (+0.0 %).
-
05:50
10-year U.S. treasury yield at 2.136 percent vs U.S. close of 2.157 percent on friday
-
05:45
Switzerland: Gross Domestic Product (QoQ) , Quarter II 0.3% (forecast 0.5%)
-
05:45
Switzerland: Gross Domestic Product (YoY), Quarter II 0.3% (forecast 1.1%)
-
04:52
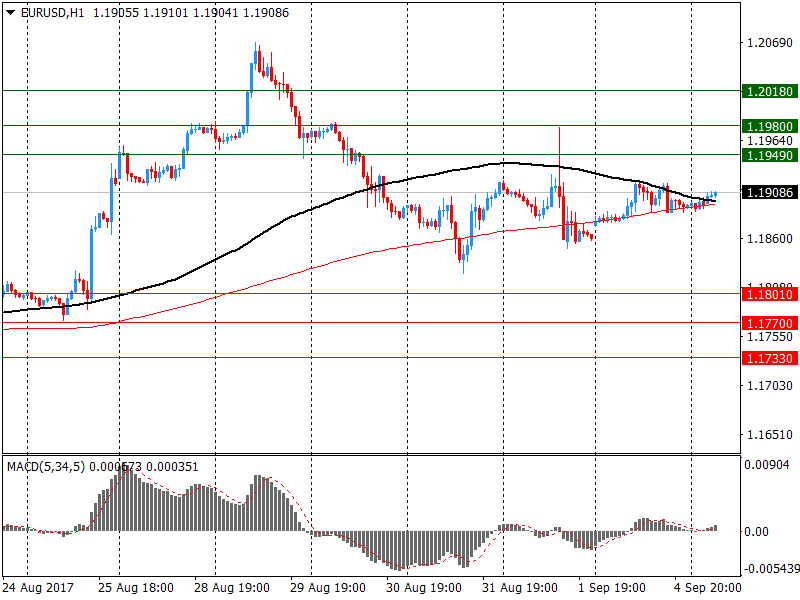
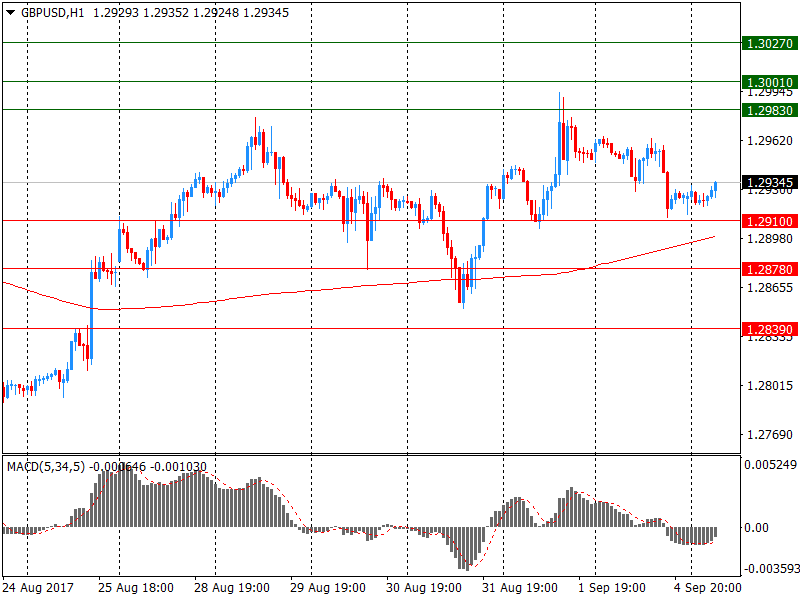
Options levels on tuesday, September 5, 2017
EUR/USD
Resistance levels (open interest**, contracts)
$1.2018 (5376)
$1.1980 (3367)
$1.1949 (4404)
Price at time of writing this review: $1.1909
Support levels (open interest**, contracts):
$1.1801 (2415)
$1.1770 (4433)
$1.1733 (3753)
Comments:
- Overall open interest on the CALL options and PUT options with the expiration date September, 8 is 145269 contracts (according to data from September, 1) with the maximum number of contracts with strike price $1,1600 (6345);
GBP/USD
Resistance levels (open interest**, contracts)
$1.3027 (3233)
$1.3001 (1238)
$1.2983 (1599)
Price at time of writing this review: $1.2935
Support levels (open interest**, contracts):
$1.2910 (1980)
$1.2878 (2724)
$1.2839 (2507)
Comments:
- Overall open interest on the CALL options with the expiration date September, 8 is 35688 contracts, with the maximum number of contracts with strike price $1,3000 (3233);
- Overall open interest on the PUT options with the expiration date September, 8 is 31026 contracts, with the maximum number of contracts with strike price $1,2900 (2724);
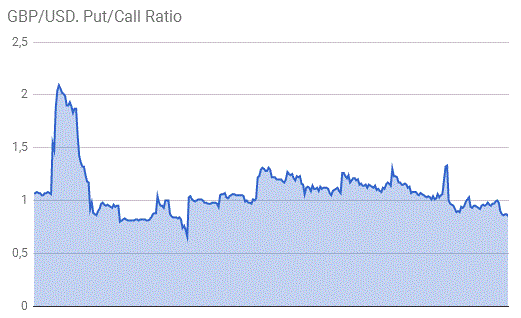
- The ratio of PUT/CALL was 0.87 versus 0.86 from the previous trading day according to data from September, 1
* - The Chicago Mercantile Exchange bulletin (CME) is used for the calculation.
** - Open interest takes into account the total number of option contracts that are open at the moment.
-
04:30
Australia: Announcement of the RBA decision on the discount rate, 1.5% (forecast 1.5%)
-
02:01
China: Markit/Caixin Services PMI, August 52.7 (forecast 51.8)
-
01:30
Australia: Current Account, bln, Quarter II 9.6 (forecast -8.05)
-


