Market news
-
23:30
Australia: AiG Performance of Construction Index, August 55.3
-
14:39
BOC: future monetary policy decisions not predetermined; will be guided by data, financial market developments as they inform inflation outlook
-
14:07
US economic activity in the non-manufacturing sector grew in August for the 92nd consecutive month
Economic activity in the non-manufacturing sector grew in August for the 92nd consecutive month, say the nation's purchasing and supply executives in the latest NonManufacturing ISM Report On Business. The NMI registered 55.3 percent. This represents continued growth in the non-manufacturing sector at a faster rate.
The NonManufacturing Business Activity Index increased to 57.5 percent, 1.6 percentage points higher than the July reading of 55.9 percent, reflecting growth for the 97th consecutive month, at a faster rate in August. The New Orders Index registered 57.1 percent, 2 percentage points higher than the reading of 55.1 percent in July. The Employment Index increased 2.6 percentage points in August to 56.2 percent from the July reading of 53.6 percent.
-
14:04
The Bank of Canada hikes interest rate to 1.00% vs 0.75% expected. USD/CAD down almost 300 pips
The Bank of Canada is raising its target for the overnight rate to 1 per cent. The Bank Rate is correspondingly 1 1/4 per cent and the deposit rate is 3/4 per cent.
Recent economic data have been stronger than expected, supporting the Bank's view that growth in Canada is becoming more broadly-based and self-sustaining. Consumer spending remains robust, underpinned by continued solid employment and income growth. There has also been more widespread strength in business investment and in exports. Meanwhile, the housing sector appears to be cooling in some markets in response to recent changes in tax and housing finance policies. The Bank continues to expect a moderation in the pace of economic growth in the second half of 2017, for the reasons described in the July Monetary Policy Report (MPR), but the level of GDP is now higher than the Bank had expected.
The global economic expansion is becoming more synchronous, as anticipated in July, with stronger-than-expected indicators of growth, including higher industrial commodity prices. However, significant geopolitical risks and uncertainties around international trade and fiscal policies remain, leading to a weaker US dollar against many major currencies. In this context, the Canadian dollar has appreciated, also reflecting the relative strength of Canada's economy.
-
14:00
Canada: Bank of Canada Rate, 1.00% (forecast 0.75%)
-
14:00
U.S.: ISM Non-Manufacturing, August 55.3 (forecast 55.3)
-
13:45
U.S.: Services PMI, August 56 (forecast 56.9)
-
13:30
U.S. treasury yields little changed as U.S. trade balace gap widens less than forecast in July
-
13:03
Forex option contracts rolling off today at 14.00 GMT:
EURUSD: 1.1775-80 (EUR 650m) 1.1800 ( 865m) 1.1900-05 (950m) 1.2000 (895m)
USDJPY: 109.00 (USD 420m) 109.35 (300m) 109.50-55 (530m) 110.00 (315m)
AUDUSD: 0.7800 (AUD 300m) 0.8100 (675m)
-
12:57
Canadian labour productivity edged down 0.1% in the second quarter
Labour productivity of Canadian businesses edged down 0.1% in the second quarter following three consecutive quarters of growth. This decline followed a significant 1.3% increase in the first quarter.
The slight decrease in productivity in the second quarter reflects a recovery in hours worked after a quarter of decline, while growth in business output continued at a faster pace.
Real gross domestic product (GDP) of businesses rose 1.3% in the second quarter, up from 1.1% in the first quarter. This marked the third time in four quarters that GDP growth of businesses has been greater than 1.0%. As in the first quarter, growth was widespread in goods-producing and service-producing business industries. Only the agriculture and forestry sector posted a decline in production in the second quarter, falling for a third consecutive quarter.
GDP growth of businesses in the second quarter was accompanied by the largest increase in hours worked (+1.4%) since the fourth quarter of 2003 (+1.9%). Hours worked rose at a comparable pace in both goods-producing (+1.2%) and service-producing (+1.4%) businesses. They were up in every major industrial sector except agriculture and forestry (-1.3%), information and cultural industries (-0.8%) and utilities (-0.3%).
-
12:55
Canada's merchandise trade deficit totalled $3.0 billion in July, narrowing from a $3.8 billion deficit in June
Imports fell 6.0% and exports decreased 4.9%, both due mainly to the effect of widespread price decreases, while the Canadian dollar appreciated sharply relative to the American dollar in July.
Total imports fell 6.0% in July to $47.2 billion, following seven consecutive monthly increases, with declines observed in all commodity sections. Prices were largely responsible for this decrease, falling 3.8%. This occurred as the Canadian dollar gained 3.6 cents US relative to the American dollar from June to July.
The decrease in import values was partially attributable to aircraft and other transportation equipment and parts, as well as motor vehicles and parts. Year over year, imports rose 4.0%.
Following a record observed in June, imports of aircraft and other transportation equipment and parts fell 35.2% to $1.6 billion in July. Aircraft imports led this decrease, with a slowdown in imports of airliners in July after two months of strong growth.
-
12:54
US trade deficit was $43.7 billion in July, up $0.1 in June
The U.S. Census Bureau and the U.S. Bureau of Economic Analysis, through the Department of Commerce,announced today that the goods and services deficit was $43.7 billion in July, up $0.1 billion from $43.5 billion in June, revised. July exports were $194.4 billion, $0.6 billion less than June exports. July imports were $238.1 billion, $0.4 billion less than June imports.
The July increase in the goods and services deficit reflected a decrease in the goods deficit of less than $0.1 billion to $65.3 billion and a decrease in the services surplus of $0.2 billion to $21.6 billion.
Year-to-date, the goods and services deficit increased $27.9 billion, or 9.6 percent, from the same period in 2016. Exports increased $76.8 billion or 6.0 percent. Imports increased $104.8 billion or 6.7 percent.
-
12:30
Canada: Labor Productivity, Quarter II -0.1%
-
12:30
U.S.: International Trade, bln, July -43.7 (forecast -44.6)
-
12:30
Canada: Trade balance, billions, July -3.04 (forecast -3.3)
-
10:09
German foreign minister welcomes european top court ruling on EU migration policy, says expects all european partners to implement ruling immediately
-
09:31
Bundesbank’s Dombret: Banks Should Finalise Brexit Relocation Plans With Frankfurt & Dublin As The Main Benefactors - CNBC
-
08:38
Russian foreign minister Lavrov says Russia and North Korean delegations could meet on sidelines of economic forum in Russia's far east - TASS
-
08:37
Eurozone retailers recorded a rise in sales for the fifth time in as many months during August
Growth was driven to a large extent by a marked expansion in Germany. The increase in France, meanwhile, was only fractional and sales in Italy continued to fall.
The headline IHS Markit Eurozone Retail PMI - which tracks the month-on-month changes in like-forlike retail sales in the bloc‟s biggest three economies combined - fell to 50.8 in August, from 51.0 in July. The latest reading highlighted the weakest rate of growth in the current five-month period of expansion.
Sales remained down on an annual basis. By country, yearly sales were up in Germany, but lower in France and Italy. The degree of the shortfall was particularly marked in the former.
-
07:29
UK defence secretary Fallon says secretary Mattis and I are clear we need to exhaust every diplomatic avenue on North Korea
-
Says China holds the key to resolving North Korean crisis
-
-
06:14
German new orders in manufacturing had decreased in July
Based on provisional data, the Federal Statistical Office (Destatis) reports that price-adjusted new orders in manufacturing had decreased in July 2017 a seasonally and working-day adjusted 0.7% on the previous month. For June 2017, revision of the preliminary outcome resulted in an increase of 0.9% compared with May 2017 (primary +1.0%). Price-adjusted new orders without major orders in manufacturing had increased in July 2017 a seasonally and working-day adjusted 0.6% on the previous month.
In July 2017, domestic orders decreased by 1.6% and foreign orders compared in July 2017 with the previous month. New orders from the euro area were down 1.0%, new orders from other countries increased 0.6% compared to June 2017.
In July 2017 the manufacturers of intermediate goods saw new orders fall by 0.4% compared with June 2017. The manufacturers of capital goods showed decreases of 0.7% on the previous month. For consumer goods, a decrease in new orders of 3.0% was recorded.
-
06:00
Germany: Factory Orders s.a. (MoM), July -0.7% (forecast 0.1%)
-
05:48
10-year U.S. treasury yield at 2.07 percent, steady from U.S. close on Tuesday
-
05:46
German chancellor Merkel's conservatives seen winning 38 pct, social democrats 23 pct in Forsa poll
-
05:46
Australian GDP rose 0.8% in Q2, less than expected
-
The Australian economy grew by 0.8% in seasonally adjusted chain volume terms in the June quarter.
-
Household final consumption expenditure increased 0.7% and government final consumption expenditure increased 1.2%.
-
Exports of goods and services rose 2.7% for the quarter.
-
Compensation of employees increased 0.7%.
-
The terms of trade fell 6.0% in the quarter.
-
-
04:48
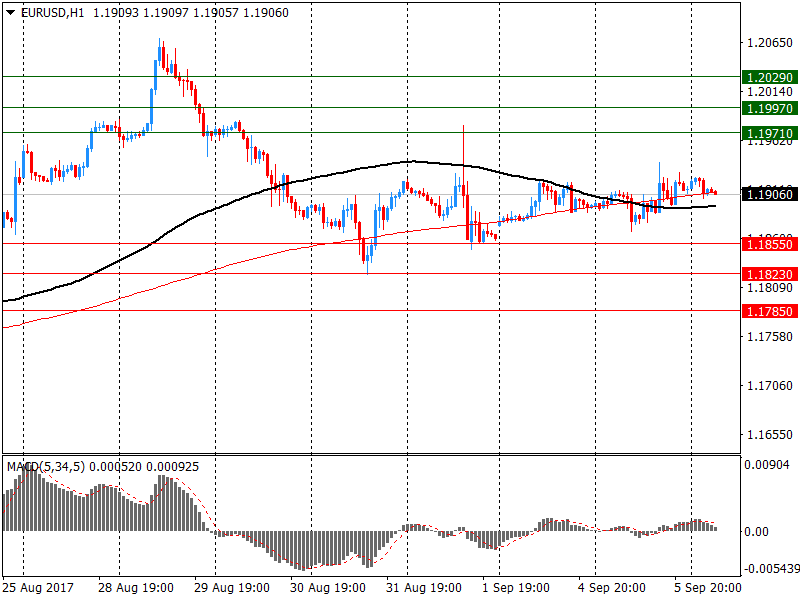
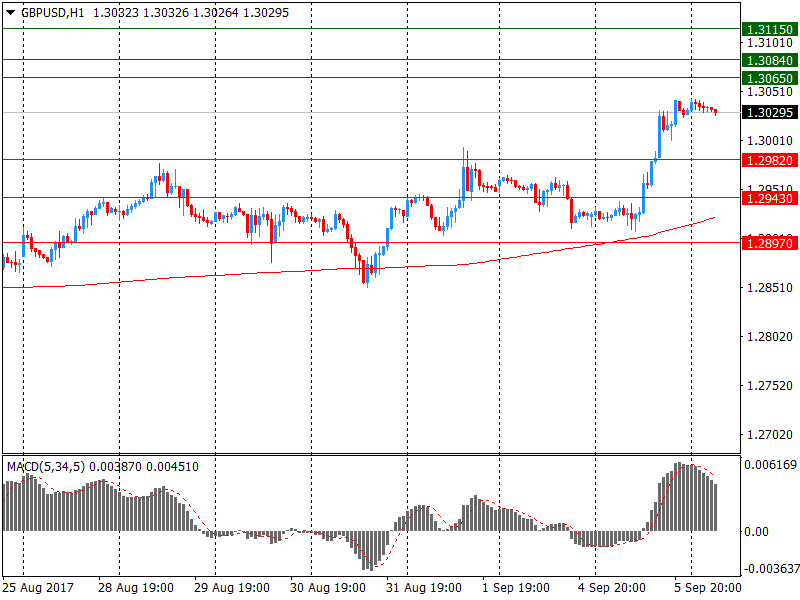
Options levels on wednesday, September 6, 2017
EUR/USD
Resistance levels (open interest**, contracts)
$1.2029 (6248)
$1.1997 (3748)
$1.1971 (4405)
Price at time of writing this review: $1.1906
Support levels (open interest**, contracts):
$1.1855 (2525)
$1.1823 (3019)
$1.1785 (4692)
Comments:
- Overall open interest on the CALL options and PUT options with the expiration date September, 8 is 150147 contracts (according to data from September, 5) with the maximum number of contracts with strike price $1,1600 (7135);
GBP/USD
Resistance levels (open interest**, contracts)
$1.3115 (2584)
$1.3084 (2315)
$1.3065 (2686)
Price at time of writing this review: $1.3030
Support levels (open interest**, contracts):
$1.2982 (1425)
$1.2943 (2215)
$1.2897 (2284)
Comments:
- Overall open interest on the CALL options with the expiration date September, 8 is 36394 contracts, with the maximum number of contracts with strike price $1,3150 (3025);
- Overall open interest on the PUT options with the expiration date September, 8 is 31049 contracts, with the maximum number of contracts with strike price $1,2850 (2577);
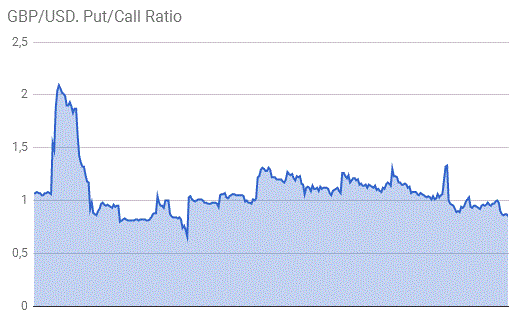
- The ratio of PUT/CALL was 0.85 versus 0.87 from the previous trading day according to data from September, 5
* - The Chicago Mercantile Exchange bulletin (CME) is used for the calculation.
** - Open interest takes into account the total number of option contracts that are open at the moment.
-
01:30
Australia: Gross Domestic Product (YoY), Quarter II 1.8% (forecast 1.8%)
-
01:30
Australia: Gross Domestic Product (QoQ), Quarter II 0.8% (forecast 0.8%)
-
00:01
Japan: Labor Cash Earnings, YoY, July -0.3% (forecast 0.5%)
-


