Market news
-
23:50
Japan: Trade Balance Total, bln, August 114 (forecast 93.9)
-
22:45
New Zealand: Current Account , Quarter II -0.62
-
22:18
Currencies. Daily history for Sep 19’2017:
(pare/closed(GMT +3)/change, %)
EUR/USD $1,1994 +0,37%
GBP/USD $1,3505 +0,07%
USD/CHF Chf0,96226 +0,11%
USD/JPY Y111,56 +0,02%
EUR/JPY Y133,82 +0,39%
GBP/JPY Y150,571 +0,04%
AUD/USD $0,8007 +0,61%
NZD/USD $0,7314 +0,79%
USD/CAD C$1,22879 -0,01%
-
22:02
Schedule for today, Wednesday, Sep 20’2017 (GMT0)
00:30 Australia Leading Index August 0.1%
06:00 Germany Producer Price Index (YoY) August 2.4% 2.5%
06:00 Germany Producer Price Index (MoM) August 0.2% 0.1%
08:30 United Kingdom Retail Sales (YoY) August 1.3% 1.1%
08:30 United Kingdom Retail Sales (MoM) August 0.3% 0.2%
13:00 Switzerland SNB Quarterly Bulletin
14:00 U.S. Existing Home Sales August 5.44 5.46
14:30 U.S. Crude Oil Inventories September 5.888
18:00 U.S. Fed Interest Rate Decision 1.25% 1.25%
18:00 U.S. FOMC Economic Projections
18:30 U.S. Federal Reserve Press Conference
22:45 New Zealand Visitor Arrivals August 3.8%
22:45 New Zealand GDP q/q Quarter II 0.5% 0.8%
22:45 New Zealand GDP y/y Quarter II 2.5% 2.5%
-
14:32
Trump says if the U.S. threatened, will have no choice but to totally destroy North Korea
-
13:50
Forex option contracts rolling off today at 14.00 GMT:
EURUSD: 1.1800 (EUR 300m) 1.1890 (480m) 1.1910 (320m) 1.1950 (650m) 1.2000 (510m) 1.2045 (310m)
USDJPY: 109.00 (USD 360m) 109.40 (530m) 110.00 (290m) 110.40 (300m) 111.00 (275m) 111.50 (380m)
AUDUSD: 0.7975 (AUD 400m) 0.8020-25 (370m) 0.8040 (230m)
NZDUSD: 0.7295 (NZD 380m)
-
13:44
British foreign office says has no immediate comment on Telegraph report that foreign secretary Johnson will resign by the weekend if PM May does not change her Brexit stance
-
13:01
Canadian manufacturing sales fell 2.6% in July
Canola production in Canada is estimated to reach a record 19.7 million tonnes in 2017, according to Statistics Canada's model-based principal field crop estimates. Soybean production is also estimated to reach a record, at 8.3 million tonnes. Current oilseed prices and profitability have encouraged Canadian farmers to plant record acreage for both of these crops.
Production is estimated to increase in 2017 for canola (+0.5%), corn for grain (+8.5%), oats (+19.0%) and soybeans (+28.8%) compared with 2016.
Production is estimated to decline in 2017 for barley (-16.8%), canary seed (-17.1%), flaxseed (-14.8%), lentils (-24.9%), mixed grains (-5.5%), mustard seed (-51.2%), dry field peas (-20.1%), fall rye (-19.6%), durum wheat (-44.6%), spring wheat (-1.8%) and winter wheat (-21.6%) compared with 2016.
-
12:59
US housing starts in line with expectations in August
Privately-owned housing units authorized by building permits in August were at a seasonally adjusted annual rate of 1,300,000. This is 5.7 percent above the revised July rate of 1,230,000 and is 8.3 percent above the August 2016 rate of 1,200,000. Single-family authorizations in August were at a rate of 800,000; this is 1.5 percent below the revised July figure of 812,000. Authorizations of units in buildings with five units or more were at a rate of 464,000 in August.
Privately-owned housing starts in August were at a seasonally adjusted annual rate of 1,180,000. This is 0.8 percent below the revised July estimate of 1,190,000, but is 1.4 percent above the August 2016 rate of 1,164,000. Single-family housing starts in August were at a rate of 851,000; this is 1.6 percent above the revised July figure of 838,000. The August rate for units in buildings with five units or more was 323,000.
-
12:57
US import/export price index rose in August
U.S. import prices increased 0.6 percent in August, the U.S. Bureau of Labor Statistics reported today, following declines in the previous 3 months. The price index for U.S. exports also advanced 0.6 percent in August, after increasing 0.5 percent in July.
Hurricane Harvey: Hurricane Harvey did not impact the collection of the import and export price index data for August because the reference period for the data is the first week of the month.Import prices rose 0.6 percent in August, the first monthly rise since a 0.2-percent increase in April and the largest advance since the index rose 0.6 percent in January. The last time import prices recorded a larger increase was a 0.7-percent advance in June 2016. Higher import prices for both fuel and
nonfuel contributed to the rise in August. Prices for U.S. imports also increased over the past 12 months, advancing 2.1 percent.
-
12:30
U.S.: Housing Starts, August 1180 (forecast 1180)
-
12:30
U.S.: Building Permits, August 1300 (forecast 1220)
-
12:30
Canada: Manufacturing Shipments (MoM), July -2.6% (forecast -1.8%)
-
12:30
U.S.: Current account, bln, Quarter II -123.1 (forecast -115.0)
-
12:30
U.S.: Import Price Index, August 0.6% (forecast 0.3%)
-
11:30
ECB policymakers disagree on whether to set firm end-date for bond-buying programme in Oct - Sources. EUR/USD down 40 pips so far
-
09:58
Zew institute says solid growth figures in Q2, steep rise in bank lending, increasing investment by both the government and private firms are likely reasons for improves investor morale
-
09:10
The ZEW Indicator of Economic Sentiment for Germany improved in September
The ZEW Indicator of Economic Sentiment for Germany improved in September 2017. Climbing 7.0 points compared to the previous month, the indicator now stands at 17.0 points. The indicator, however, still remains below the long-term average of 23.8 points.
"The solid growth figures in the second quarter of 2017 in combination with a steep rise in bank lending and increasing investment activities by both the government and private firms are likely reasons for the financial market experts' significantly more positive outlook compared to that of last month. Their expectations are further corroborated by stable global economic development. The German federal elections do not seem to have been a source of uncertainty. The worries about the recent strengthening of the euro has, for now, also faded into the background," comments ZZEW President Professor Achim Wambach.
-
09:01
Eurozone: ZEW Economic Sentiment, September 31.7
-
09:00
Germany: ZEW Survey - Economic Sentiment, September 17.0 (forecast 12.5)
-
08:21
Turkish lira weakens beyond 3.5 against dollar, first time since August 23
-
08:06
The current account of the euro area recorded a surplus of €25.1 billion in July
The current account of the euro area recorded a surplus of €25.1 billion in July 2017. This reflected surpluses for goods (€26.4 billion), primary income (€10.9 billion) and services (€2.6 billion), which were partly offset by a deficit for secondary income (€14.8 billion).
The 12-month cumulated current account for the period ending in July 2017 recorded a surplus of €333.1 billion (3.0% of euro area GDP), compared with one of €373.3 billion (3.5% of euro area GDP) for the 12 months to July 2016 (see Table 1 and Chart 1). This development was due to decreases in the surpluses for goods (from €367.2 billion to €338.6 billion) and services (from €63.4 billion to €43.3 billion), and an increase in the deficit for secondary income (from €123.2 billion to €146.5 billion). These were partly offset by an increase in the surplus for primary income (from €65.9 billion to €97.6 billion).
-
08:00
Eurozone: Current account, unadjusted, bln , July 32.5
-
06:39
Options levels on tuesday, September 19, 2017
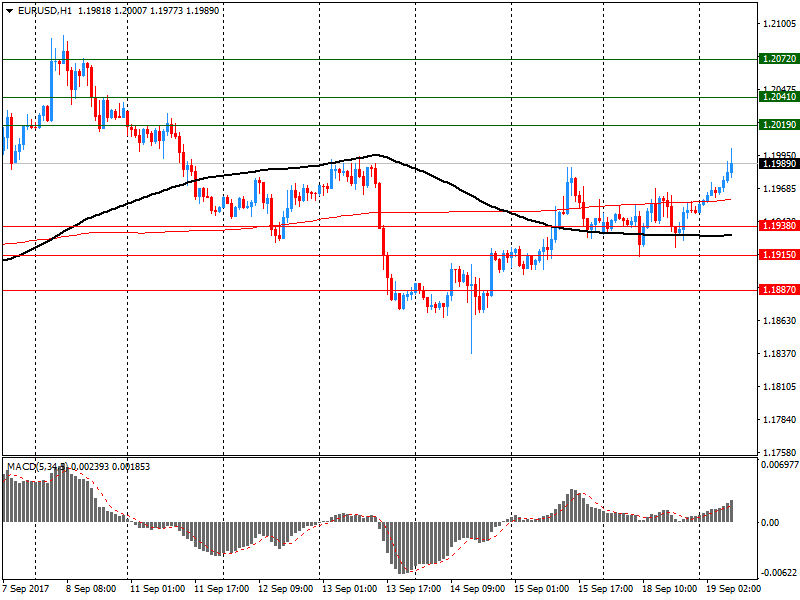
EUR/USD
Resistance levels (open interest**, contracts)
$1.2072 (1415)
$1.2041 (1357)
$1.2019 (580)
Price at time of writing this review: $1.1989
Support levels (open interest**, contracts):
$1.1938 (1312)
$1.1915 (3204)
$1.1887 (3124)
Comments:
- Overall open interest on the CALL options and PUT options with the expiration date October, 6 is 96668 contracts (according to data from September, 18) with the maximum number of contracts with strike price $1,1800 (4574);
GBP/USD
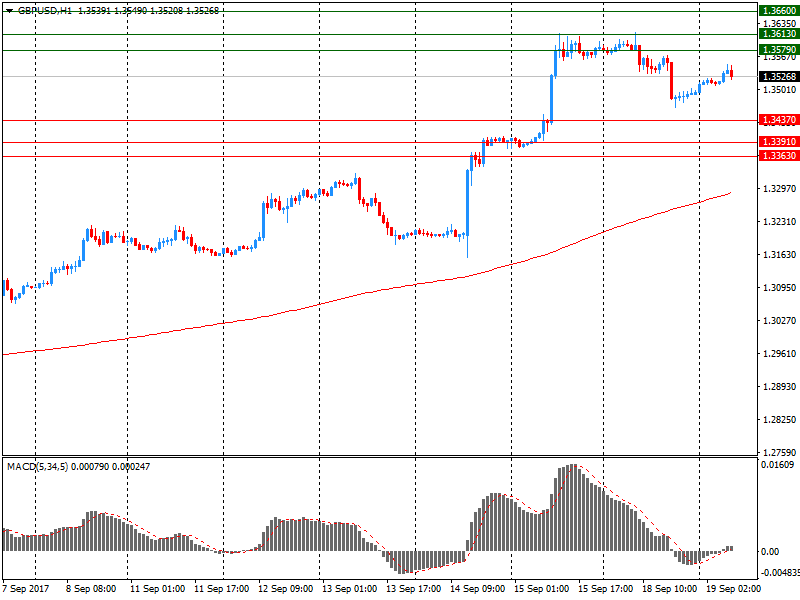
Resistance levels (open interest**, contracts)
$1.3660 (1216)
$1.3613 (1110)
$1.3579 (1455)
Price at time of writing this review: $1.3527
Support levels (open interest**, contracts):
$1.3437 (664)
$1.3391 (334)
$1.3363 (175)
Comments:
- Overall open interest on the CALL options with the expiration date October, 6 is 30056 contracts, with the maximum number of contracts with strike price $1,3300 (2586);
- Overall open interest on the PUT options with the expiration date September, 8 is 32865 ontracts, with the maximum number of contracts with strike price $1,2950 (2496);
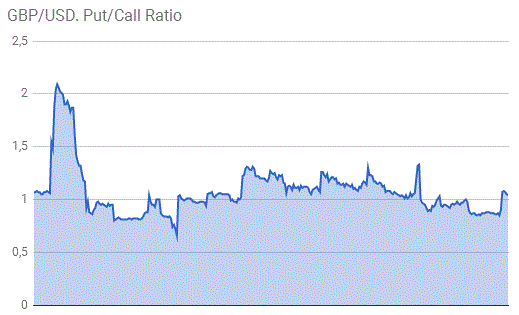
- The ratio of PUT/CALL was 1.09 versus 1.08 from the previous trading day according to data from September, 18
* - The Chicago Mercantile Exchange bulletin (CME) is used for the calculation.
** - Open interest takes into account the total number of option contracts that are open at the moment.
-
06:20
Iraqi Oil Minister: Has Fully Complied With OPEC Supply Cuts, Exceeded Its Share In Cuts @LiveSquawk
-
06:05
China foreign minister says North Korea nuclear issue must be resolved peacefully with talks
-
Says China will continue to strictly follow U.N. resolutions, assume its international obligations
-
The vicious cycle needs to be broken
-
Other parties must assume their responsibilities, play their own role
-
-
06:01
Australian house price index rose more than expected in Q2
The price index for residential properties for the weighted average of the eight capital cities rose 1.9% in the June quarter 2017. The index rose 10.2% through the year to the June quarter 2017.
The capital city residential property price indexes rose in Sydney (+2.3%), Melbourne (+3.0%), Brisbane (+0.6%), Adelaide (+0.8%), Canberra (+1.3%) and Hobart (+1.8%) and fell in Perth (-0.8%) and Darwin (-1.4%).
Annually, residential property prices rose in Sydney (+13.8%), Melbourne (+13.8%), Hobart (+12.4%), Canberra (+7.9%), Adelaide (+5.0%) and Brisbane (+3.0%) and fell in Darwin (-4.9%) and Perth (-3.1%).
The total value of residential dwellings in Australia was $6,726,783.5m at the end of the June quarter 2017, rising $145,868.5m over the quarter.
The mean price of residential dwellings rose $12,100 to $679,100 and the number of residential dwellings rose by 40,000 to 9,906,100 in the June quarter 2017.
-
05:54
RBA: AUD rise driven by fall in USD, weighing on domestic growth and inflation
-
Leading indicators suggested jobs pick up was likely to continue
-
RBA meeting started with discussion on labour market, which had continued to improve
-
Labour market still has spare capacity, wage growth to remain low for some time
-
Jobs growth to support household incomes and spending, but high debt a risk
-
Clear signs housing market in Sydney had eased, less so in Melbourne
-
China impact on iron ore, expected prices to fall as new supply came on stream
-
-
05:51
Trump says we call for full restoration of democracy and political freedoms in Venezuela and we want it to happen very soon
-
01:32
Australia: House Price Index (QoQ), Quarter II 1.9% (forecast 1.1%)
-


