Market news
-
22:46
New Zealand: Visitor Arrivals, August 5.80%
-
22:46
New Zealand: GDP y/y, Quarter II 2.5% (forecast 2.5%)
-
22:45
New Zealand: GDP q/q, Quarter II 0.8% (forecast 0.8%)
-
22:17
Currencies. Daily history for Sep 20’2017:
(pare/closed(GMT +3)/change, %)
EUR/USD $1,1893 -0,85%
GBP/USD $1,3496 -0,06%
USD/CHF Chf0,96964 +0,76%
USD/JPY Y112,29 +0,64%
EUR/JPY Y133,55 -0,20%
GBP/JPY Y151,549 +0,65%
AUD/USD $0,8032 +0,32%
NZD/USD $0,7354 +0,54%
USD/CAD C$1,23248 +0,30%
-
22:01
Schedule for today, Thursday, Sep 21’2017 (GMT0)
1:30 Australia RBA Bulletin
03:00 Japan BoJ Interest Rate Decision -0.1% -0.1%
04:30 Japan All Industry Activity Index, m/m July 0.4%
05:10 Australia RBA Assist Gov Lowe Speaks
05:45 Switzerland SECO Economic Forecasts
06:00 Switzerland Trade Balance August 3.5
06:30 Japan BOJ Press Conference
08:00 Eurozone ECB Economic Bulletin
08:30 United Kingdom BBA Mortgage Approvals August 41.58
08:30 United Kingdom PSNB, bln August 0.76
12:30 Canada Wholesale Sales, m/m July -0.5% -0.9%
12:30 U.S. Continuing Jobless Claims 1944 1980
12:30 U.S. Initial Jobless Claims 284 300
12:30 U.S. Philadelphia Fed Manufacturing Survey September 18.9 17.2
13:00 U.S. Housing Price Index, m/m July 0.1%
13:30 Eurozone ECB President Mario Draghi Speaks
14:00 Eurozone Consumer Confidence (Preliminary) September -1.5 -1.5
14:00 U.S. Leading Indicators August 0.3% 0.2%
-
18:00
U.S.: Fed Interest Rate Decision , 1.25% (forecast 1.25%)
-
14:30
U.S.: Crude Oil Inventories, September 4.591 (forecast 2.925)
-
14:03
US existing home sales down 1.7% in August
Existing-home sales stumbled in August for the fourth time in five months as strained supply levels continue to subdue overall activity, according to the National Association of Realtors. Sales gains in the Northeast and Midwest were outpaced by declines in the South and West.
Total existing-home sales1, which are completed transactions that include single-family homes, townhomes, condominiums and co-ops, retreated 1.7 percent to a seasonally adjusted annual rate of 5.35 million in August from 5.44 million in July. Last month's sales pace is 0.2 percent above last August, and is the lowest since then.
-
14:00
U.S.: Existing Home Sales , August -1.7% (forecast 5.46)
-
13:39
Forex option contracts rolling off today at 14.00 GMT:
EURUSD: 1.1950 (EUR 500 млн) 1.2000 (1.05 млрд) 1.2050 (300 млн) 1.2100 (620 млн)
USDJPY: 109.00 (USD 755 млн) 109.20 (300 млн) 109.50 (395 млн) 110.00 (515 млн) 110.75(350 млн) 111.00-10 (525 млн) 112.00 (310 млн) 112.50 (350 млн)
AUDUSD: 0.8000 (AUD 775 млн) 0.8025-25 (320 млн)
-
13:03
FOMC meeting the main event of the day. Interest rate expected to be held at 1.25% and investors will look for clues about the policy path at Yellen's press conference
-
10:51
OECD sees U.S. Growth of 2.1 pct in 2017, 2.4 pct in 2018 (both unchanged)
-
2017 world growth of 3.5 pct (unchanged from june estimates), 3.7 pct in 2018 (+0.1 pct point)
-
UK growth of 1.6 pct in 2017, 1.0 pct in 2018 (both unchanged)
-
Japanese growth of 1.6 pct in 2017 (+0.2), 1.2 pct in 2018 (+0.2)
-
Chinese growth of 6.8 pct in 2017 (+0.2), 6.6 pct in 2018 (+0.2)
-
-
09:52
British armed police officers and explosives teams patrolling Liverpool street and Moorgate areas of London's financial district - Independent
-
09:12
OECD sees euro zone growth of 2.1 pct in 2017 (+0.3), 1.9 pct in 2018 (+0.1)
-
09:00
Forex option contracts rolling off today at 14.00 GMT:
EURUSD: 1.1950 (EUR 500m) 1.2000 (1.05bln) 1.2050 (300m) 1.2100 (620m)
USDJPY: 109.00 (USD 755m) 109.20 (300m) 109.50 (395m) 110.00 (515m) 110.75(350m) 111.00-10 (525m) 112.00 (310m) 112.50 (350m)
AUDUSD: 0.8000 (AUD 775m) 0.8025-25 (320m)
-
08:34
UK retail sales rose more than expected in August. GBP/USD rally
In August 2017, the quantity bought (volume) in the retail sales industry increased by 1.0% compared with July 2017; with other non-food stores and non-store retailing as the main contributors to growth.
Compared with August 2016, the quantity bought increased by 2.4%; the 52nd consecutive month of year-on-year increase in retail sales.
Year-on-year contribution of food stores remains flat whilst there was a fall in the contribution of growth within petrol stations, showing that contributions to the overall growth came from non-essential items.
The underlying pattern in the retail industry is one of growth, three-months on three-months the quantity bought has increased by 1.2%.
Store prices increased across all store types on the year, with non-food stores and non-store retailing recording their highest year-on-year price growth since March 1992, at 3.2% and 3.3% respectively.
-
08:31
United Kingdom: Retail Sales (MoM), August 1% (forecast 0.2%)
-
08:30
United Kingdom: Retail Sales (YoY) , August 2.4% (forecast 1.1%)
-
07:52
10-year U.S. treasury yield at 2.237 percent vs U.S. close of 2.243 percent on Tuesday
-
07:51
China foreign ministry says U.N. resolutions clear Korean peninsula issue should be resolved through peaceful, political means
-
06:49
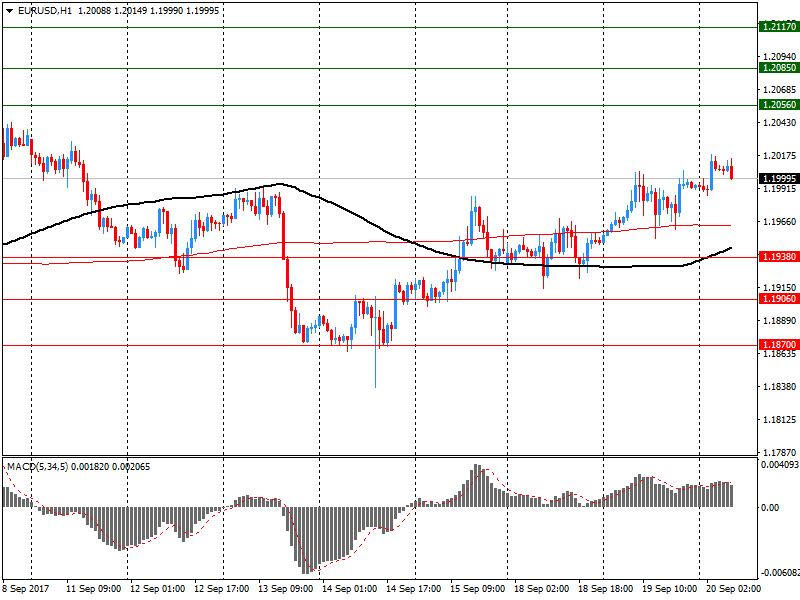
Options levels on wednesday, September 20, 2017
EUR/USD
Resistance levels (open interest**, contracts)
$1.2117 (3181)
$1.2085 (3171)
$1.2056 (496)
Price at time of writing this review: $1.1999
Support levels (open interest**, contracts):
$1.1938 (3365)
$1.1906 (3231)
$1.1870 (4301)
Comments:
- Overall open interest on the CALL options and PUT options with the expiration date October, 6 is 98630 contracts (according to data from September, 19) with the maximum number of contracts with strike price $1,1800 (4877);
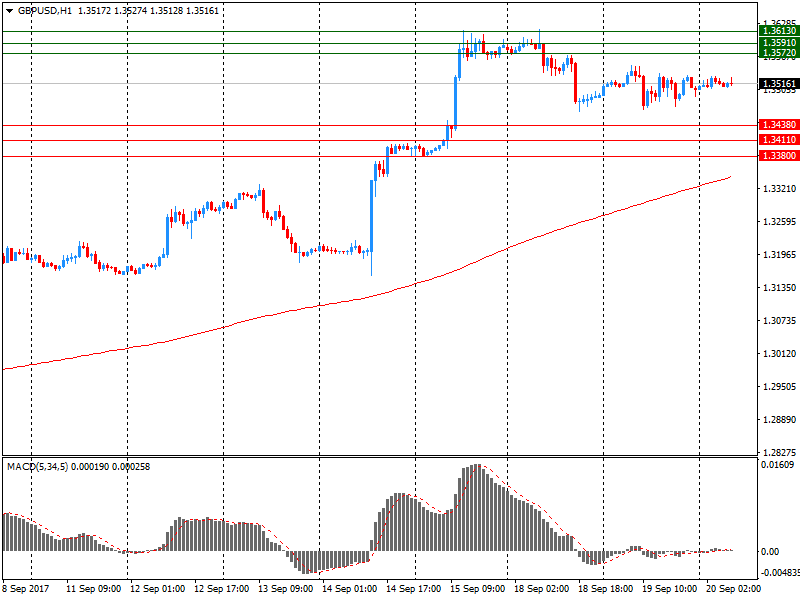
GBP/USD
Resistance levels (open interest**, contracts)
$1.3613 (1525)
$1.3591 (2510)
$1.3572 (2201)
Price at time of writing this review: $1.3516
Support levels (open interest**, contracts):
$1.3438 (425)
$1.3411 (330)
$1.3380 (167)
Comments:
- Overall open interest on the CALL options with the expiration date October, 6 is 31328 contracts, with the maximum number of contracts with strike price $1,3300 (2510);
- Overall open interest on the PUT options with the expiration date September, 8 is 33778 contracts, with the maximum number of contracts with strike price $1,2950 (2496);
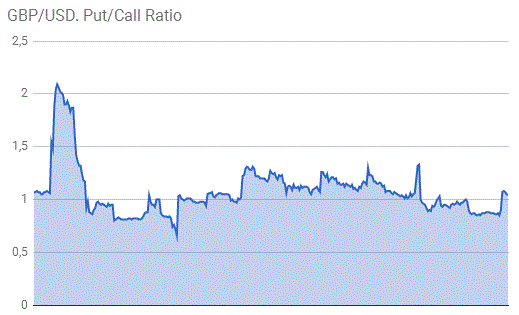
- The ratio of PUT/CALL was 1.08 versus 1.09 from the previous trading day according to data from September, 19
* - The Chicago Mercantile Exchange bulletin (CME) is used for the calculation.
** - Open interest takes into account the total number of option contracts that are open at the moment.
-
06:10
New Zealand's governing national party regains voter support lead over opposition labour party in 1 News poll. NZD/USD up 65 pips on the news
-
06:08
New Zealand’s South Island has been struck by a magnitude 5.8 earthquake - Nine News
-
06:03
German producer prices rose by 2.6% y/y
In August 2017 the index of producer prices for industrial products rose by 2.6% compared with the corresponding month of the preceding year. In July 2017 the annual rate of change all over had been 2.3%, as reported by the Federal Statistical Office.
Compared with the preceding month July 2017 the overall index rose by 0.2% in August 2017 (+0.2% in July and unchanged in June).
In August 2017 the price indices of all main industrial groups increased compared with August 2016: Prices of non-durable consumer goods rose by 3.6%, prices of intermediate goods by 3.3%. Energy prices rose by 2.7%, though the development of prices of the different energy carriers diverged. Prices of electricity increased by 5.8% and prices of petroleum products by 5.1%, whereas prices of natural gas (distribution) decreased by 6.4%. Prices of durable consumer goods and prices of capital goods increased each by 1.0%.
The overall index disregarding energy was 2.6% up on August 2016 and rose by 0.1% compared with July 2017.
-
06:00
Germany: Producer Price Index (YoY), August 2.6% (forecast 2.5%)
-
06:00
Germany: Producer Price Index (MoM), August 0.2% (forecast 0.1%)
-
05:47
New Zealand's current account deficit was $7.5 billion in Q2
For the year ended June 2017, New Zealand's current account deficit was $7.5 billion (2.8 percent of GDP; it was 2.7 percent of GDP for the June 2016 year).
The seasonally adjusted current account balance was a $1,598 million deficit in the June 2017 quarter ($1,187 million smaller than the March 2017 quarter's deficit).
The goods deficit decreased $677 million to reach $446 million.
The services surplus increased $295 million to reach $1,280 million, the highest on record.
New Zealand's primary income deficit decreased to $1,910 million in the June 2017 quarter, $403 million smaller than in the March 2017 quarter.
New Zealand's secondary income deficit increased to $522 million in the June 2017 quarter, $188 million larger than the March 2017 quarter deficit.
The capital account balance was a deficit of $14 million for the June 2017 quarter, down from the surplus of $3 million in the March 2017 quarter.
-
05:44
RBA's Ellis says hunt for yield less of a risk now rates are starting to rise globally
-
Geopolitical risk in Asia has increased, while lessening in the euro area
-
Household debt on its own unlikely to trigger such a shock
-
High household debt in Australia is a risk in the event of an economic shock
-
Policy globally will have to stay expansionary should inflation remain low
-
Still believes global wage growth and inflation will pick up, but may take some time
-
-
05:42
China foreign minister says China upholds peaceful resolution of North Korea issue - Xinhua
-
00:34
Australia: Leading Index, August -0.1%
-


