Market news
-
15:58
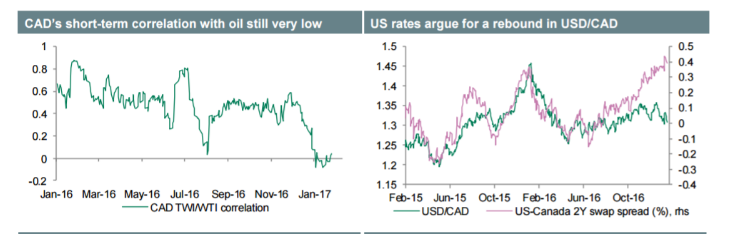
Credit Agricole is long USD/CAD. Where to target
"The CAD has recouped its post-BoC losses. Markets were probably encouraged by President Trump's approval of the Keystone XL oil pipeline, previously blocked by President Barack Obama on environmental concerns.
However, we do not see this as an immediate negative for USD/CAD: although this would facilitate the delivery of oil from Western Canada to US refineries in several years' time, the immediate impact will mostly be via increased US hiring during the construction of the project. Markets were also likely to have been encouraged by the relatively constructive tone from Prime Minister Justin Trudeau and other Canadian politicians with respect to potentially re-negotiating the NAFTA terms, suggesting that the close US-Canada trade relationship will most likely largely survive the protectionist leanings of the new US administration.
However, from a valuation perspective, the CAD is starting to look expensive again, as oil prices remain in their current USD51-55/bl range and 2Y rate differentials with the US continue to widen.
We expect USD/CAD to rise to 1.37 by the end of Q1 and 1.40 by Q3.
In the week ahead, we are watching the November GDP report. BoC Governor Stephen Poloz speaks on Tuesday, 31 January, when he gets a chance to clarify his comment at the press conference that a rate cut remains "on the table".
-
15:28
Greece's 2017 economic growth will undershoot the target set by the nation's creditors and laid out in the country's budget - Dow Jones
-
15:06
US consumers expressed a higher level of confidence in January - UoM
"Consumers expressed a higher level of confidence January than any other time in the last dozen years. The post-election surge in confidence was driven by a more optimistic outlook for the economy and job growth during the year ahead as well as more favorable economic prospects over the next five years. Consumers also reported much more positive assessments of their current financial situation due to gains in both incomes and household wealth, and anticipated the most positive outlook for their personal finances in more than a decade", says Surveys of Consumers chief economist, Richard Curtin.
-
15:00
U.S.: Reuters/Michigan Consumer Sentiment Index, December 98.5 (forecast 98.1)
-
14:26
Mexico has taken advantage of the U.S. for long enough. Massive trade deficits & little help on the very weak border must change, NOW! @realDonaldTrump
-
13:46
Option expiries for today's 10:00 ET NY cut
EURUSD 1.0495-1.0500 (EUR 831m) 1.0630 (307m) 1.0645-55 (543m) 1.0750 (485m)1.0900 (423m) 1.0650 (271m) 1.0750 (256m)
USDJPY 113.20-25 (610m) 114.00 (722m) 114.85 (300m) Y115.00 (575m) 115.40-50(775m) 116.00 (358m)
GBPUSD: 1.2970 (GBP 700m)
AUDUSD: 0.7350 (AUD 724m) 0.7575 (333m) 0.7600 (244m)
USDCAD: 1.3145 (USD 520m) 1.3400 (2.69bln)
-
13:37
US new orders for manufactured durable goods in December decreased $1.0 billion or 0.4 percent
New orders for manufactured durable goods in December decreased $1.0 billion or 0.4 percent to $227.0 billion, the U.S. Census Bureau announced today. This decrease, down two consecutive months, followed a 4.8 percent November decrease. Excluding transportation, new orders increased 0.5 percent. Excluding defense, new orders increased 1.7 percent. Transportation equipment, also down two consecutive months, drove the decrease, $1.7 billion or 2.2 percent to $73.7 billion.
Nondefense new orders for capital goods in December increased $2.4 billion or 3.8 percent to $66.6 billion. Shipments increased $1.2 billion or 1.8 percent to $71.7 billion. Unfilled orders decreased $5.1 billion or 0.7 percent to $691.8 billion. Inventories increased $0.6 billion or 0.3 percent to $171.1 billion.
-
13:35
US Q4 preliminary GDP rose less than expected
Real gross domestic product (GDP) increased at an annual rate of 1.9 percent in the fourth quarter of 2016, according to the "advance" estimate released by the Bureau of Economic Analysis. In the third quarter, real GDP increased 3.5 percent.
The increase in real GDP in the fourth quarter reflected positive contributions from personal consumption expenditures (PCE), private inventory investment, residential fixed investment, nonresidential fixed investment, and state and local government spending that were partly offset by negative contributions from exports and federal government spending. Imports, which are a subtraction in the calculation of GDP, increased
-
13:31
U.S.: PCE price index, q/q, Quarter IV 2.2%
-
13:30
U.S.: GDP, q/q, Quarter IV 1.9% (forecast 2.2%)
-
13:30
U.S.: Durable Goods Orders ex Transportation , December 0.5% (forecast 0.5%)
-
13:30
U.S.: Durable Goods Orders , December -0.4% (forecast 2.6%)
-
13:30
U.S.: Durable goods orders ex defense, November 1.7%
-
13:30
U.S.: PCE price index ex food, energy, q/q, Quarter IV 1.3% (forecast 1.7%)
-
13:00
Orders
EUR/USD
Offers 1.0700 1.0730 1.0765 1.0780 1.0800 1.0830 1.0850-55
Bids 1.0655-60 1.0625-30 1.0600 1.0580 1.0565 1.0550 1.0520 1.0500
GBP/USD
Offers 1.2560 1.2580 1.2600 1.2630 1.2660 1.2680 1.2700 1.2730 1.2750
Bids 1.2525-30 1.2500 1.2480-85 1.2450 1.2430 1.2400
EUR/GBP
Offers 0.8530-35 0.8550 0.8580-85 0.8600 0.8620 0.8650
Bids 0.8470-75 0.8450 0.8430 0.8400 0.8385 0.8350
EUR/JPY
Offers 123.30 123.50 123.80 124.00 124.20 124.50 124.80 125.00
Bids 122.80 122.60 122.30 122.00 121.80 121.60 121.20 121.00
USD/JPY
Offers 115.35 115.50 115.65 115.80 116.00 116.20 116.50 116.80 117.00
Bids 115.00 114.80-85 114.50 114.30 114.00 113.80 113.50 113.30 113.00
AUD/USD
Offers 0.7550-55 0.7580-85 0.7600 0.7630 0.7650 0.7675 0.7700
Bids 0.7500 0.7480-85 0.7450 0.7430 0.7400
-
10:41
Opinion polls indicate that the anti-establishment Party for Freedom is set to become the largest party in the Netherlands after the March general elections - Dow Jones
-
09:57
Option expiries for today's 10:00 ET NY cut
EUR/USD 1.0650 (EUR 271m) 1.0750 (256m)
USD/JPY 112.70-75 (626m) 112.95-113.00 (429m) 114.00 (2.1bln)
GBP/USD: 1.2260 (328m)
EUR/GBP: 0.8750 (379m)
USD/CHF: 1.000 (594m) 1.0250 (1.1bln)
AUD/USD: 0.7375 (813m) 0.7460 (250m)
Информационно-аналитический отдел TeleTrade
-
09:39
Eur/Usd & Gbp/Usd views and targets from Citi
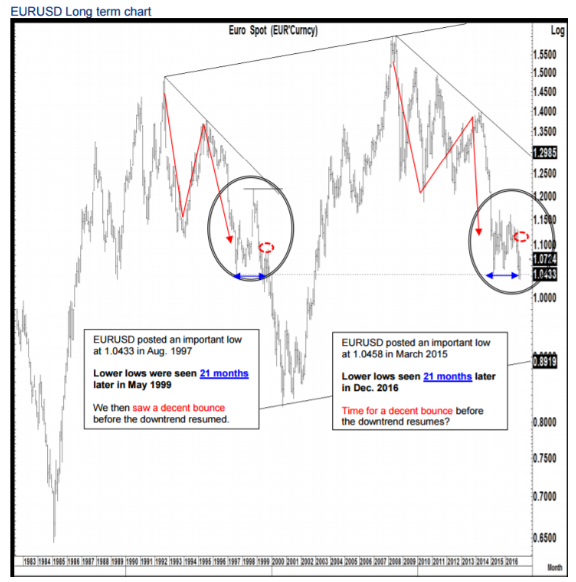
"In the short run, we continue to expect EURUSD and GBPUSD to test major resistance levels, which is consistent with our roadmap from 1999, before turning again later.
Looking back to 1999, as the DXY started turning higher in October of 1999, it did not rally against JPY. The rally was against European currencies and it is these crosses - largely EURUSD and GBPUSD - that we believe will trend in favor of the USD over the months ahead.
A month after the June 1999 Fed hike, EURUSD posted a bullish monthly reversal (July 1999) and the DXY Index posted a bearish one. We may well see the same again this month. The monthly close levels to watch this month are
- EURUSD: 1.0875 - A monthly close above would result in a bullish monthly reversal targeting a decent gap to the 200 day which currently stands at 1.1017.
- USD-Index: 99.43 - A monthly close below would result in a bearish monthly reversal
If seen, we it would add to the short term bias of USD weakness. Beyond this short term bounce the overall picture still looks bearish for EURUSD just as we saw in the last cycle.
GBP/USD: Taken out the reverse head and shoulders neckline, 55 day moving average and previous falling trendline which all converged between 1.2406-1.2415
This break suggests a rally to 1.2842 which would be the reverse head and shoulders target.
Good resistance levels are at 1.2775-1.2798".
Copyright © 2017 CitiFX, eFXnews™
-
09:08
Euro area monetary aggregate M3 increased to 5.0% in December
The annual growth rate of the broad monetary aggregate M3 increased to 5.0% in December 2016, from 4.8% in November.
• The annual growth rate of the narrower aggregate M1, which includes currency in circulation and overnight deposits, increased to 8.8% in December, from 8.5% in November.
• The annual growth rate of adjusted loans to households stood at 2.0% in December, compared with 1.9% in November.
• The annual growth rate of adjusted loans to non-financial corporations increased to 2.3% in December, from 2.1% in November.
-
09:02
Eurozone: Private Loans, Y/Y, December 2% (forecast 2%)
-
09:01
Eurozone: M3 money supply, adjusted y/y, December 5% (forecast 4.9%)
-
08:35
Further rhetoric from U.S. President Donald Trump against Mexico sent the peso backtracking on more of its early-week gains - Dow Jones
-
07:29
Options levels on friday, January 27, 2017
EUR/USD
Resistance levels (open interest**, contracts)
$1.0782 (2520)
$1.0757 (2240)
$1.0741 (449)
Price at time of writing this review: $1.0668
Support levels (open interest**, contracts):
$1.0622 (1373)
$1.0597 (2047)
$1.0568 (1757)
Comments:
- Overall open interest on the CALL options with the expiration date March, 13 is 59258 contracts, with the maximum number of contracts with strike price $1,0800 (3762);
- Overall open interest on the PUT options with the expiration date March, 13 is 70852 contracts, with the maximum number of contracts with strike price $1,0000 (5001);
- The ratio of PUT/CALL was 1.20 versus 1.17 from the previous trading day according to data from January, 26
GBP/USD
Resistance levels (open interest**, contracts)
$1.2808 (1712)
$1.2712 (1623)
$1.2617 (1643)
Price at time of writing this review: $1.2546
Support levels (open interest**, contracts):
$1.2589 (14396)
$1.2492 (911)
$1.2394 (1451)
Comments:
- Overall open interest on the CALL options with the expiration date March, 13 is 22815 contracts, with the maximum number of contracts with strike price $1,2500 (2589);
- Overall open interest on the PUT options with the expiration date March, 13 is 25551 contracts, with the maximum number of contracts with strike price $1,1500 (3231);
- The ratio of PUT/CALL was 1.12 versus 1.06 from the previous trading day according to data from January, 26
* - The Chicago Mercantile Exchange bulletin (CME) is used for the calculation.
** - Open interest takes into account the total number of option contracts that are open at the moment.
-
07:24
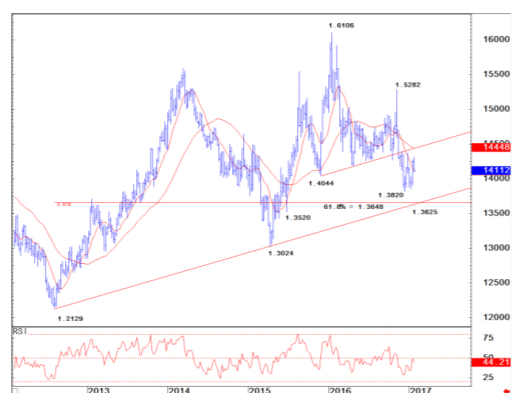
Credit Suisse says EUR/CAD maintains a large top targeting 61.8% Fibo
"EURCAD is currently consolidating the sharp fall experienced from November till December 2016.
However, with a major top still in place we remain bearish and look for an eventual break below 1.3820 to turn the core trend lower again for the 61.8% retracement of the 2012/16 rise and potential trend support 1.3648/25 next.
We would expect a renewed basing effort here. However, below it would then aim at 1.3520, potentially the April 2015 major low at 1.3024.
Resistance shows first at 1.4368/94 with "neckline" and 200-day average barriers at 1.4441/47 ideally capping to keep the overall trend still bearish".
Copyright © 2017 Credit Suisse, eFXnews™
-
07:21
Japan's inflation topped expectations in December
Consumer prices in Japan were up 0.3 percent on year in December, the Ministry of Internal Affairs and Communications said, cited by rttnews.
That topped expectations for 0.2 percent but was down from 0.5 percent in November.
Core consumer prices, which exclude food, sank an annual 0.2 percent. That also beat forecasts for a decline of 0.3 percent following the 0.4 percent contraction a month earlier.
Overall inflation for the Tokyo region, considered a leading indicator for the nationwide trend, added 0.1 percent on year in January versus expectations for a flat reading - which would have been unchanged.
-
07:19
Japanese Prime Minister Abe: I can not say that we came out of a deflationary spiral
Today, after the publication of weak data on inflation Japanese Prime Minister Shinzo Abe said Japan is still facing deflationary pressure. However, the politician added that he is waiting for the situation to improve in the near future.
-
07:18
The Bank of Japan increased bonds purchases which led to a USD / JPY rally
This morning, the Bank of Japan increased its purchases of Japanese government bonds with a maturity of 5-10 years. The Central Bank took such measures in order to curb the rise of Japanese government bond yields. After this decision the 10-year Japanese government bonds yield fell to 0.07% compared to yesterday's value of 0.09% (the highest level since December 16).
USD / JPY rose, breaking the psychological level of Y115.00, and continues to trade around this level.
-
07:06
Australian import and export prices rose in December
The Import Price Index rose 0.2% in the December quarter 2016. Through the year to the December quarter 2016, the Import Price Index fell 4.6%.
The Export Price Index rose 12.4% in the December quarter 2016. Through the year to the December quarter 2016, the Export Price Index rose 12.4%.
-
07:04
Spicer: Would implement 20% border tax on imports from Mexico - zerohedge
-
00:31
Australia: Export Price Index, q/q, Quarter IV 12.4% (forecast 11%)
-
00:31
Australia: Import Price Index, q/q, Quarter IV 0.2% (forecast -0.5%)
-
00:30
Australia: Producer price index, y/y, Quarter IV 0.7%
-
00:30
Australia: Producer price index, q / q, Quarter IV 0.5% (forecast 0.2%)
-