Market news
-
23:30
Japan: Tokyo Consumer Price Index, y/y, January 0.1% (forecast 0.0%)
-
23:30
Japan: Tokyo CPI ex Fresh Food, y/y, January -0.3% (forecast -0.4%)
-
23:30
Japan: National Consumer Price Index, y/y, December 0.3% (forecast 0.2%)
-
23:30
Japan: National CPI Ex-Fresh Food, y/y, December -0.2% (forecast -0.3%)
-
23:16
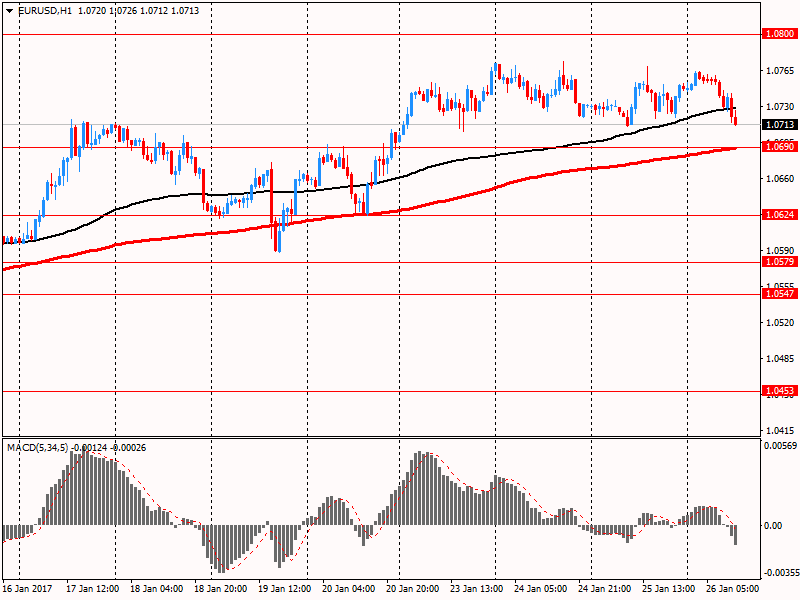
Currencies. Daily history for Jan 26’2017:
(pare/closed(GMT +2)/change, %)
EUR/USD $1,0681 -0,63%
GBP/USD $1,2592 -0,31%
USD/CHF Chf0,9996 +0,03%
USD/JPY Y114,51 +1,08%
EUR/JPY Y122,32 +0,47%
GBP/JPY Y144,2 +0,78%
AUD/USD $0,7533 -0,49%
NZD/USD $0,7244 -0,72%
USD/CAD C$1,3088 +0,15%
-
22:59
Schedule for today, Friday, Jan 27’2017 (GMT0)
00:30 Australia Producer price index, q / q Quarter IV 0.3% 0.2%
00:30 Australia Producer price index, y/y Quarter IV 0.5%
00:30 Australia Export Price Index, q/q Quarter IV 3.5% 11%
00:30 Australia Import Price Index, q/q Quarter IV -1% -0.5%
09:00 Eurozone Private Loans, Y/Y December 1.9% 2%
09:00 Eurozone M3 money supply, adjusted y/y December 4.8% 4.9%
13:30 U.S. Durable Goods Orders December -4.6% 2.6%
13:30 U.S. Durable Goods Orders ex Transportation December 0.5% 0.5%
13:30 U.S. Durable goods orders ex defense November -6.6%
13:30 U.S. PCE price index ex food, energy, q/q (Preliminary) Quarter IV 1.7% 1.7%
13:30 U.S. PCE price index, q/q (Preliminary) Quarter IV 1.5%
13:30 U.S. GDP, q/q (Preliminary) Quarter IV 3.5% 2.2%
15:00 U.S. Reuters/Michigan Consumer Sentiment Index (Finally) December 98.2 98.1
-
15:56
Creditors ask Greece for more austerity beyond 2018: Official
-
15:15
US new home sales decline 10% in December
Sales of new single-family houses in December 2016 were at a seasonally adjusted annual rate of 536,000, according to estimates released jointly today by the U.S. Census Bureau and the Department of Housing and Urban Development. This is 10.4 percent below the revised November rate of 598,000 and is 0.4 percent below the December 2015 estimate of 538,000.
The median sales price of new houses sold in December 2016 was $322,500; the average sales price was $384,000. The seasonally adjusted estimate of new houses for sale at the end of December was 259,000. This represents a supply of 5.8 months at the current sales rate.
-
15:01
U.S.: Leading Indicators , December 0.5% (forecast 0.5%)
-
15:00
U.S.: New Home Sales, December 536 (forecast 588)
-
14:50
January data signalled a positive start to 2017 for the U.S. service sector - Markit
The latest survey revealed a robust expansion of business activity and another strong increase in incoming new work. Meanwhile, service providers were more upbeat about the business outlook than at any time since May 2015.
Inflationary pressures eased since December, but were still among the highest seen over the past year-and-a-half. Adjusted for seasonal influences, the Markit Flash U.S. Services PMI Business Activity Index picked up to 55.1 in January, from 53.9.
-
14:45
U.S.: Services PMI, January 55.1 (forecast 54.4)
-
14:01
The U.S. has a 60 billion dollar trade deficit with Mexico. It has been a one-sided deal from the beginning of NAFTA with massive numbers... @realDonaldTrump
-
13:44
Option expiries for today's 10:00 ET NY cut
EURUSD 1.0650 (EUR 271m) 1.0750 (256m)
USDJPY 112.70-75 (626m) 112.95-113.00 (429m) 114.00 (2.1bln)
GBPUSD: 1.2260 (328m)
EURGBP: 0.8750 (379m)
USDCHF: 1.000 (594m) 1.0250 (1.1bln)
AUDUSD: 0.7375 (813m) 0.7460 (250m)
-
13:38
The international trade deficit of US was $65.0 billion in December
The international trade deficit of US was $65.0 billion in December, down $0.3 billion from $65.3 billion in November. Exports of goods for December were $125.5 billion, $3.7 billion more than November exports. Imports of goods for December were $190.5 billion, $3.4 billion more than November imports.
-
13:35
US preliminary wholesale inventories rose more than expected in November
Total inventories of merchant wholesalers, except manufacturers' sales branches and offices, after adjustment for seasonal variations but not for price changes, were $595.3 billion at the end of November, up 1.0 percent from the revised October level. Total inventories are up 1.4 percent from the revised November 2015 level. The October 2016 to November 2016 percent change was revised from the advance estimate of up 0.9 percent to up 1.0 percent.
-
13:34
US initial jobless claims higher than expected
In the week ending January 21, the advance figure for seasonally adjusted initial claims was 259,000, an increase of 22,000 from the previous week's revised level. The previous week's level was revised up by 3,000 from 234,000 to 237,000.
The 4-week moving average was 245,500, a decrease of 2,000 from the previous week's revised average. This is the lowest level for this average since November 3, 1973 when it was 244,000. The previous week's average was revised up by 750 from 246,750 to 247,500.
-
13:30
U.S.: Initial Jobless Claims, 259 (forecast 247)
-
13:30
U.S.: Continuing Jobless Claims, 2100 (forecast 2040)
-
13:00
Orders
EUR/USD
Offers 1.0765 1.0780 1.0800 1.0830 1.0850-55 1.0880 1.0900
Bids 1.0720 1.0700 1.0680 1.0650 1.0625-30 1.0600 1.0580 1.0565 1.0550
GBP/USD
Offers 1.2660 1.2680 1.2700 1.2730 1.2750 1.2775 1.2800 1.2860 1.2900
Bids 1.2620 1.2600 1.2585 1.2550 1.2530 1.2500 1.2480-85 1.2450
EUR/GBP
Offers 0.8520 0.8535 0.8550 0.8580-85 0.8600
Bids 0.8480 0.8450 0.8430 0.8400 0.8385 0.8350
EUR/JPY
Offers 122.30 122.50 122.80 123.00 123.50 124.00
Bids 121.80 121.60 121.20 121.00 120.80 120.50 120.00
USD/JPY
Offers 113.80-85 114.00 114.20 114.50 114.80 115.00 115.50 115.80 116.00
Bids 113.50 113.30 113.00 112.80 112.65 112.50 112.30 112.00 111.80 111.50
AUD/USD
Offers 0.7580-85 0.7600 0.7630 0.7650 0.7675 0.7700
Bids 0.7550 0.7520 0.7500 0.7480-85 0.7450 0.7430 0.7400
-
12:11
UK's Article 50 Brexit bill to be published at 1230 GMT - PM's spokesman on Reuters. GBP/USD 100 pips lower in the last 4 hours
-
11:37
-
11:04
UK sales fell modestly at the start of this year - CBI
The survey of 113 firms, consisting of 52 retailers, showed that sales fell modestly at the start of this year. Looking ahead, volumes are set to grow in the year to February.
Sales volumes were considered to be broadly in line with the average for the time of year, having been above seasonal norms at the end of 2016. Orders placed on suppliers were broadly unchanged over the year, and are expected to fall marginally next month.
The moderate decline in retail sales volumes was driven by grocers, where sales fell at the fastest pace since August 2004. However, continually healthy growth was reported elsewhere, particularly among clothing retailers and department stores.
-
11:00
United Kingdom: CBI retail sales volume balance, January -8 (forecast 22)
-
09:40
UK Q4 GDP beats expectations
UK gross domestic product (GDP) was estimated to have increased by 0.6% during Quarter 4 (Oct to Dec) 2016, the same rate of growth as in the previous 2 quarters.
Growth during Quarter 4 was dominated by services, with a strong contribution from consumer-focused industries such as retail sales and travel agency services.
Following falls in Quarter 3 (July to Sept) 2016, construction and production provided negligible positive contributions to GDP growth in Quarter 4 2016.
UK GDP was estimated to have increased by 2.0% during 2016, slowing slightly from 2.2% in 2015 and from 3.1% in 2014.
-
09:30
United Kingdom: GDP, q/q, Quarter IV 0.6% (forecast 0.5%)
-
09:30
United Kingdom: GDP, y/y, Quarter IV 2.2% (forecast 2.1%)
-
09:30
United Kingdom: BBA Mortgage Approvals, December 43.2 (forecast 41.1)
-
09:18
Italian retail trade down 0.7% in November
In November 2016 the seasonally adjusted retail trade index decreased by 0.7% with respect to October 2016 (-1.2% for food goods and -0.5% for non-food goods). The average of the last three months decreased with respect to the previous three months (-0.1%). The unadjusted index increased by 0.8% with respect to November 2015.
-
08:45
German EconMin: EU At Risk Of Falling Apart If Populists In Dutch Or French Elections Succeed Following Brexit - RTRS
-
08:14
Spanish unemployment rate declined in Q4 2016
The number of employed is reduced by 19,400 people in the fourth quarter of 2016 Compared to the previous quarter (-0.10%) and stands at 18,508,100. In terms Seasonally adjusted, the quarterly variation is 0.41%. Employment has grown in 413,900 people in the last 12 months.
The annual rate is 2.29%. The decline in employment is concentrated this quarter in the public sector (17,800 Employed), while employment in the private sector declined by 1,600. In the last 12 months employment has increased by 428,500 people in the sector Private and has been reduced by 14,600 in the public.
-
07:35
Moody's Investors Service says that China's property market will show nationally a slower pace of sales growth in 2017
Moody's Investors Service says that China's property market -- after posting a record high in 2016 -- will show nationally a slower pace of sales growth in 2017 on the back of the government's tightened controls to curb property price growth.
"We expect nationwide contracted sales in 2017 will be largely flat or will see a slight decline from 2016, after buoyant growth that year," says Chris Wong, a Moody's Analyst.
Overall, national contracted sales (on a sales value basis) grew by 36.2% year-on-year to a record high of RMB9.9 trillion in 2016, driven by growth in both sales volumes and average selling prices.
"However, the growth pace in December 2016 slowed from that seen in the first three quarters of 2016 after the government implemented tightening measures to cool the sector from late September," adds Wong.
-
07:32
Future US Treasury Secretary, Steven Mnuchin: Fed has "sufficient independence"
The future head of the Ministry of Finance said that the Fed has "sufficient independence" in order to carry out its policies. Mnuchin spoke about the actions of the Fed and endorsed the recent efforts to improve the transparency of the regulator.
Steven Turner Mnuchin - American businessman, former member of Goldman Sachs.
-
07:26
New Zeeland CPI inflation rate was 1.3 percent in the last quarter
In the December 2016 quarter compared with the September 2016 quarter:
-
The consumers price index (CPI) rose 0.4 percent (up 0.7 with seasonal adjustment).
-
Transport prices rose 3.7 percent, influenced by higher petrol and air transport prices.
-
Housing-related prices rose - purchase of new housing, excluding land, was up 1.4 percent.
-
Vegetable prices fell 15 percent (up 3.0 percent after seasonal adjustment).
From the December 2015 quarter to the December 2016 quarter:
The CPI inflation rate was 1.3 percent.
-
Housing and household utilities increased 3.3 percent.
-
Transport prices decreased 1.0 percent.
-
Tradable prices decreased 0.1 percent, while prices for non-tradables increased 2.4 percent.
The average price of 1 litre of 91 octane petrol was $1.82 in the December 2016 quarter, up from $1.75 in the September 2016 quarter.
-
-
07:25
Options levels on thursday, January 26, 2017
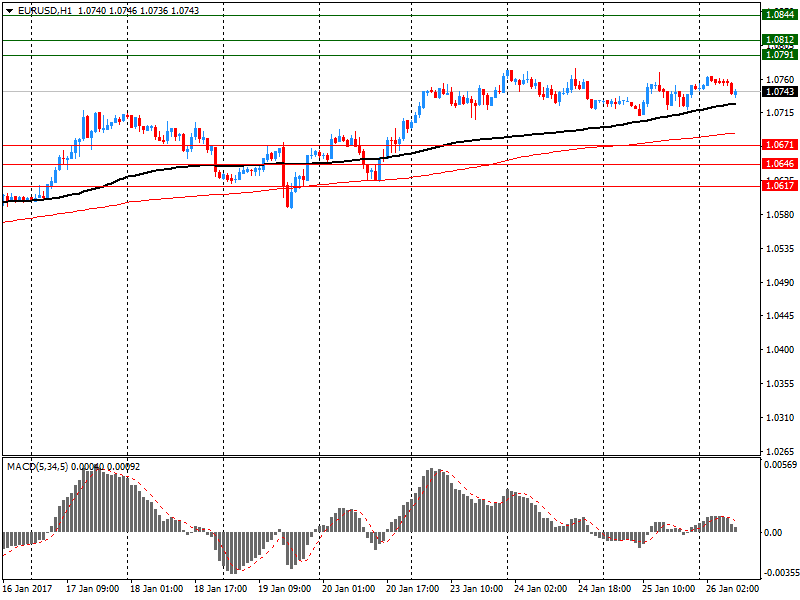
EUR/USD
Resistance levels (open interest**, contracts)
$1.0844 (2816)
$1.0812 (2390)
$1.0791 (2238)
Price at time of writing this review: $1.0743
Support levels (open interest**, contracts):
$1.0671 (1377)
$1.0646 (1253)
$1.0617 (1984)
Comments:
- Overall open interest on the CALL options with the expiration date March, 13 is 58466 contracts, with the maximum number of contracts with strike price $1,0800 (3727);
- Overall open interest on the PUT options with the expiration date March, 13 is 68313 contracts, with the maximum number of contracts with strike price $1,0000 (4951);
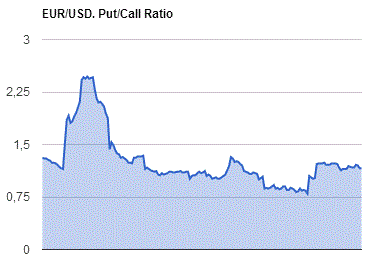
- The ratio of PUT/CALL was 1.17 versus 1.17 from the previous trading day according to data from January, 25
GBP/USD
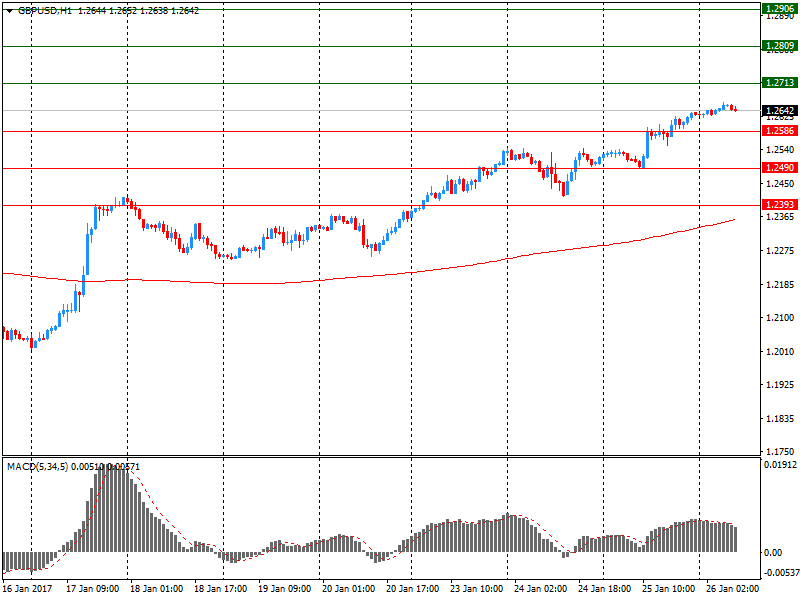
Resistance levels (open interest**, contracts)
$1.2906 (1391)
$1.2809 (1755)
$1.2713 (1623)
Price at time of writing this review: $1.2642
Support levels (open interest**, contracts):
$1.2586 (826)
$1.2490 (720)
$1.2393 (294)
Comments:
- Overall open interest on the CALL options with the expiration date March, 13 is 22421 contracts, with the maximum number of contracts with strike price $1,2500 (2600);
- Overall open interest on the PUT options with the expiration date March, 13 is 23776 contracts, with the maximum number of contracts with strike price $1,1500 (3231);
- The ratio of PUT/CALL was 1.06 versus 1.15 from the previous trading day according to data from January, 25
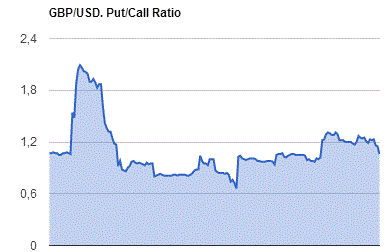
* - The Chicago Mercantile Exchange bulletin (CME) is used for the calculation.
** - Open interest takes into account the total number of option contracts that are open at the moment.
-
07:20
Swiss foreign trade grew again in 2016
After a decline in the previous year, foreign trade grew again in 2016, with the development of chemical-pharmaceutical products. Exports rose by 3.8% (real: - 0.8%) to a record high of CHF 210.7 billion. However, the two other major divisions - machines and electronics as well as watches - were unable to participate in the growth. Imports increased by 4.1% (real: + 1.2%) to CHF 173.2 billion. The surplus in the trade balance reached a new record (37.5 billion francs). Exports expanded by 3.8% (real: - 0.8%) to CHF 210.7 billion in 2016, which means that, they reached a new peak.
-
07:07
German consumer confidence is starting 2017 on an extremely positive note - GfK
Both economic and income expectations as well as propensity to buy have improved. The overall consumer climate indicator is forecasting 10.2 points for February 2017, following 9.9 points in January.
At the beginning of 2017, consumer mood, which was already at a good level, improved even further. For example, economic expectation climbed for the fourth time in a row to their highest point in one and a half years. As a result of better income prospects, propensity to buy grew significantly in January. As such, the start of 2017 was, in the view of consumers, a resounding success.
-
07:01
Switzerland: Trade Balance, December 2.72 (forecast 2.81)
-
07:00
Germany: Gfk Consumer Confidence Survey, February 10.2 (forecast 10)
-
