Market news
-
07:51
GBP/USD Forecast: Pound Sterling looks to extend rebound after UK inflation data
- GBP/USD gained traction and climbed above 1.2750 after UK data.
- The pair could face next strong resistance at 1.2770.
- Investors will keep a close eye on US bank stocks.
GBP/USD turned north and climbed to a fresh six-day high above 1.2760 in the European morning on Wednesday. The near-term technical outlook points to a buildup of bullish momentum.
Following strong wage inflation readings on Tuesday, the data from the UK revealed on Wednesday that core consumer inflation remained stick in July. Hawkish Bank of England (BoE) bets gained traction and provided a boost to Pound Sterling midweek.
The Consumer Price Index (CPI) declined to 6.8% on a yearly basis from 7.9% in June but the Core CPI held steady at 6.9%. According to Reuters, markets are fully pricing in a 25 basis points (bps) rate hike in September and see the BoE raising the policy rate by a total of 75 bps by February 2024 after the latest jobs report and inflation data.
In the late American session, the Federal Reserve will release the minutes of the July policy meeting. Investors are likely to ignore this publication and pay close attention to the action in Wall Street.
Fitch Ratings analyst told CNBC on Tuesday that the agency could downgrade several big lenders, including JPMorgan. This headline didn't allow the US Dollar (USD) to gather strength despite the upbeat Retail Sales data. In case bank stocks continue to push lower after the opening bell, the USD could come under renewed selling pressure and allow GBP/USD to stretch higher.
GBP/USD Technical Analysis
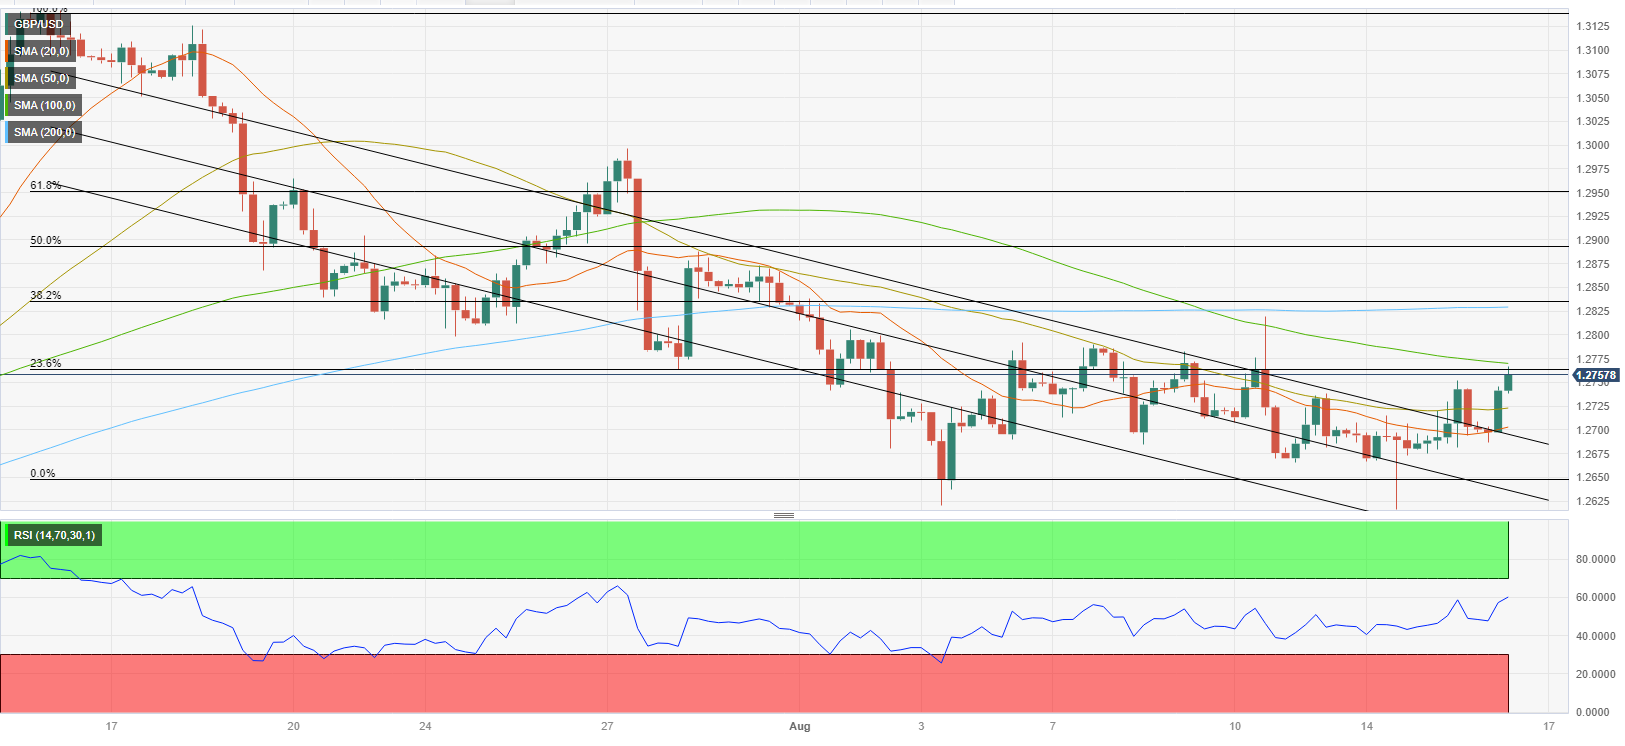
The Relative Strength Index (RSI) indicator on the 4-hour chart climbed to 60 and GBP/USD broke above the descending regression channel coming from mid-July, reflecting the bullish tilt in the short-term outlook.
On the upside, 1.2770 (100-period Simple Moving Average (SMA), Fibonacci 23.6% retracement of the latest downtrend) aligns as immediate resistance. If GBP/USD manages to clear that hurdle and starts using it as support, 1.2800 (psychological level) could act as interim resistance ahead of 1.2830 (200-period SMA, Fibonacci 38.2% retracement).
Looking south, first support is located at 1.2725 (50-period SMA) before 1.2700 (psychological level, upper limit of the descending channel). A 4-hour close below the latter could attract sellers and cause GBP/USD to decline toward 1.2650 (static level, mid-point of the descending channel).
-
06:46
USD/CNH faces extra weakness near term – UOB
USD/CNH could slip back to the 7.1000 region once 7.1250 is cleared, comment Economist Lee Sue Ann and Markets Strategist Quek Ser Leang at UOB Group.
Key Quotes
24-hour view: We highlighted yesterday that “there is a chance for USD to test 7.1500 before the risk of a rebound increases.” We added, “7.1250 is unlikely to come into view today.” Our view turned out to be correct as USD dropped to a low of 7.1479 and then closed at 7.1505 (0.22%). Downward momentum has increased and USD is unlikely to rebound just yet. Today, USD could drop below 7.1250. The round number support at 7.1000 is unlikely come under threat. In order to maintain the momentum, USD must stay below 7.1700 (minor resistance is at 7.1600).
Next 1-3 weeks: Yesterday (13 Jul, spot at 7.1670), we pointed out that “the focus is at 7.1500, and the next support below this level is at 7.1250.” USD fell to a low of 7.1479 before extending its decline in early Asian trade. We continue to expect USD to weaken. A break of 7.1250 will shift the focus to 7.1000. On the upside, a break of 7.1930 (‘strong resistance’ level was at 7.2150 yesterday) would suggest the USD weakness that started on Monday has stabilized.
-
01:00
China: Manufacturing PMI , December 51.4 (forecast 51.5)
-
00:59
China: Non-Manufacturing PMI, December 54.5
-
00:00
Gold Price Forecast: XAU/USD looks to test offers at $2,660 amid cautious optimism
- Gold price trades in the green for the third straight day on Wednesday, nears $2,650.
- Gold price gains on geopolitical risks and steady US Dollar even as Treasury bond yields recover.
- Gold price closes on 50-day SMA resistance at $2,660 amid bearish daily RSI.
Gold price stays on the front foot early Wednesday, looking to regain the $2,650 barrier as the road to recovery extends for the third straight day. Traders now await the upcoming speeches from US Federal Reserve (Fed) policymakers and Nvidia’s earnings report amid lingering geopolitical concerns between Russia and Ukraine.
Gold price looks to geopolitics and Fedspeak for fresh directives
The US Dollar (USD) seems to find fresh demand in Asian trading on Wednesday, tracking the uptick in the US Treasury bond yields as broader market sentiment improves on China’s stimulus hopes.
Markets were cautious earlier following the People’s Bank of China’s (PBOC) inaction on the Loan Prime Rates (LPR). However, expectations that China will roll out more stimulus to prop up the economy are lifting the market mood.
Further, worries over a further geopolitical escalation between Russia and Ukraine seem to fade, lifting risk appetite.
However, Gold buyers refuse to give up so far, anticipating a shift in risk sentiment if the American AI giant Nvidia Inc.’s earnings report disappoints and triggers a wave of risk aversion across the financial markets.
Also, the developments surrounding Russia and Ukraine will be closely eyed, keeping the demand for the traditional safe-haven Gold price underpinned.
On Tuesday, Russia's Defence Ministry said that Ukraine fired six US-made Army Tactical Missile Systems (ATACMS) missiles at Bryansk region, just days after US President Joe Biden allowed the Ukrainian use of American-made weapons to strike inside Russia.
The Kremlin confirmed Tuesday that they lowered the threshold for a possible nuclear strike in response to non-nuclear attacks on Russia.
Besides, the Fedspeak will help gauge the US central bank’s path forward on interest rates, with markets now pricing in a 60% chance that the Fed will cut rates by 25 basis points (bps) in December.
Gold price technical analysis: Daily chart
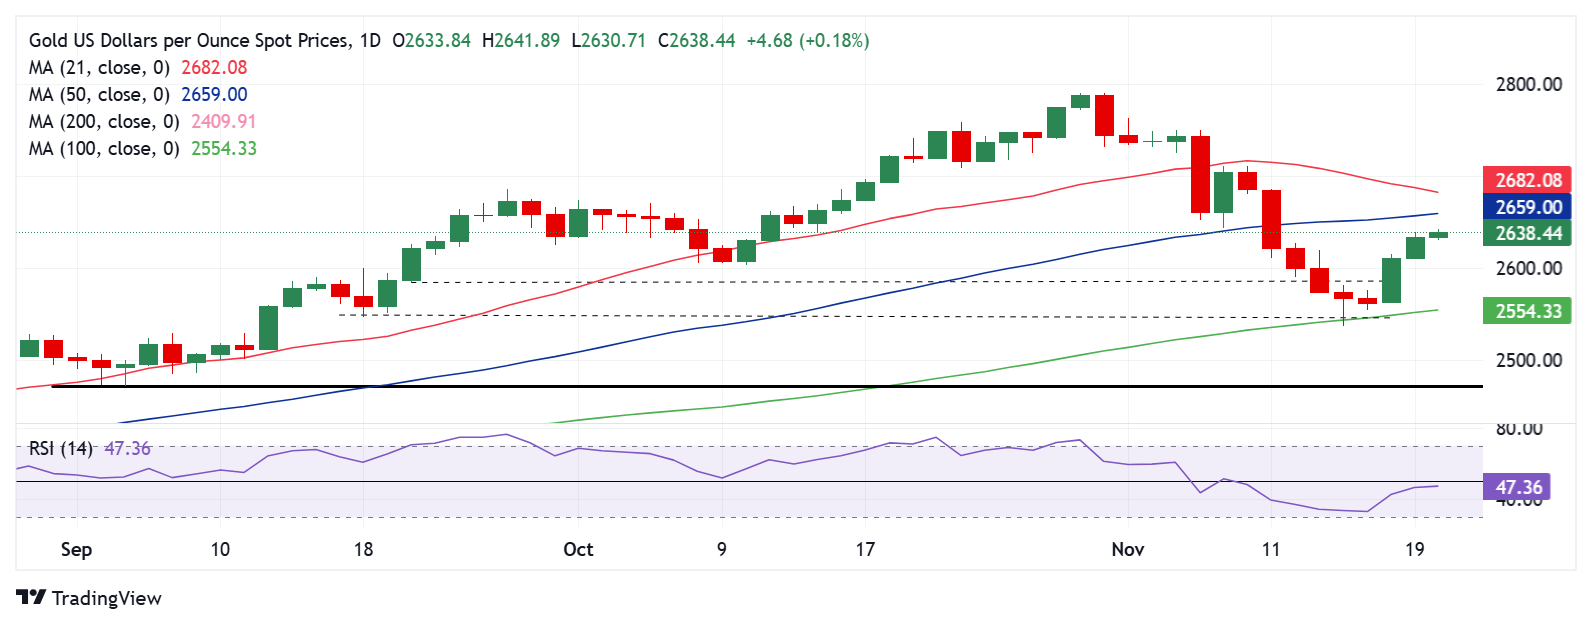
The short-term technical outlook for Gold price remains the same, with traders likely to adopt a ‘sell on bounce’ trade strategy as the 14-day Relative Strength Index (RSI) remains below the 50 level. The indicator is currently trading near 47.
An impending Bear Cross adds credence to the downside potential. The 21-day Simple Moving Average (SMA) is looking to cross the 50-day SMA above. If that happens on a daily closing basis, it will validate the bearish crossover.
That said, failure to find acceptance above the 50-day SMA at $2,660 on a daily closing basis could reinforce sellers toward the $2,600 threshold.
The previous day’s low of $2,610 will be tested ahead of that.
On the flip side, the immediate resistance is seen at the 50-day SMA, above which the 21-day SMA at $2,682 will come into play.
Additional recovery could face stiff resistance at the $2,700 threshold.
Gold FAQs
Gold has played a key role in human’s history as it has been widely used as a store of value and medium of exchange. Currently, apart from its shine and usage for jewelry, the precious metal is widely seen as a safe-haven asset, meaning that it is considered a good investment during turbulent times. Gold is also widely seen as a hedge against inflation and against depreciating currencies as it doesn’t rely on any specific issuer or government.
Central banks are the biggest Gold holders. In their aim to support their currencies in turbulent times, central banks tend to diversify their reserves and buy Gold to improve the perceived strength of the economy and the currency. High Gold reserves can be a source of trust for a country’s solvency. Central banks added 1,136 tonnes of Gold worth around $70 billion to their reserves in 2022, according to data from the World Gold Council. This is the highest yearly purchase since records began. Central banks from emerging economies such as China, India and Turkey are quickly increasing their Gold reserves.
Gold has an inverse correlation with the US Dollar and US Treasuries, which are both major reserve and safe-haven assets. When the Dollar depreciates, Gold tends to rise, enabling investors and central banks to diversify their assets in turbulent times. Gold is also inversely correlated with risk assets. A rally in the stock market tends to weaken Gold price, while sell-offs in riskier markets tend to favor the precious metal.
The price can move due to a wide range of factors. Geopolitical instability or fears of a deep recession can quickly make Gold price escalate due to its safe-haven status. As a yield-less asset, Gold tends to rise with lower interest rates, while higher cost of money usually weighs down on the yellow metal. Still, most moves depend on how the US Dollar (USD) behaves as the asset is priced in dollars (XAU/USD). A strong Dollar tends to keep the price of Gold controlled, whereas a weaker Dollar is likely to push Gold prices up.
-
00:00
EE.UU.: El PMI de servicios mejora a 56.8 en diciembre pero no alcanza los 58.5 puntos esperados
El PMI de servicios de S&P Global para Estados Unidos ha subido a 56.8 puntos desde los 56.1 de noviembre, su nivel más alto desde marzo de 2022. A pesar del aumento, la cifra ha estado por debajo de las expectativas, ya que se esperaba un aumento a 58.5.
El indicador ha mostrado su mayor crecimiento de la producción y de los nuevos pedidos desde marzo de 2022, mientras que el empleo ha aumentado por primera vez en cinco meses. La confianza empresarial ha alcanzado su nivel más alto en 18 meses.
Por otra parte, los pedidos a fábrica de noviembre han caído un 0.4% frente al descenso del 0.3% previsto, pero el dato de octubre ha sido revisado al alza hasta un +0.5% desde el +0.2% anterior.
Dólar reacción
El Índice del Dólar estadounidense (DXY) se ha desplomado este lunes desde niveles superiores a 109.00 hasta un suelo de una semana en 107.75. Tras los datos, el billete verde cotiza sobre 108.30, perdiendo un 0.59% en el día.
Economic Indicator
S&P Global Services PMI
The S&P Global Services Purchasing Managers Index (PMI), released on a monthly basis, is a leading indicator gauging business activity in the US services sector. As the services sector dominates a large part of the economy, the Services PMI is an important indicator gauging the state of overall economic conditions. The data is derived from surveys of senior executives at private-sector companies from the services sector. Survey responses reflect the change, if any, in the current month compared to the previous month and can anticipate changing trends in official data series such as Gross Domestic Product (GDP), industrial production, employment and inflation. A reading above 50 indicates that the services economy is generally expanding, a bullish sign for the US Dollar (USD). Meanwhile, a reading below 50 signals that activity among service providers is generally declining, which is seen as bearish for USD.
Read more.Last release: Mon Jan 06, 2025 14:45
Frequency: Monthly
Actual: 56.8
Consensus: 58.5
Previous: 58.5
Source: S&P Global
-
00:00
EUR/JPY attracts some buyers above 160.50 ahead of Eurozone inflation data
- EUR/JPY gains traction to around 160.70 in Tuesday’s early European session, up 0.49% on the day.
- Ishiba’s comments undermine the Japanese Yen.
- ECB’s Lagarde said she is increasingly confident that inflation will ease to its 2% target.
The EUR/JPY cross extends the rally to near 160.70 during the early European session on Tuesday. The remarks from Japan's incoming Prime Minister (PM) Shigeru Ishiba weigh on the Japanese Yen (JPY). Investors await the Eurozone Harmonized Index of Consumer Prices (HICP) for September for fresh impetus. Also, the European Central Bank (ECB) policymakers Luis de Guindos and Isabel Schnabel are set to speak later on Tuesday.
The dovish comments from Japan's upcoming Prime Minister Shigeru Ishiba exert some selling pressure on the JPY. Ishiba said that the Bank of Japan's (BoJ) monetary policy must remain accommodative to underpin a fragile economic recovery.
Elsewhere, Japan’s Tankan Large Manufacturing Index showed that overall business conditions for large manufacturing companies remained steady in the third quarter (Q3) of 2024. The headline large Manufacturers' Sentiment Index arrived at 13.0 in Q3 from 13.0 in Q2, matching the expectations.
On the Euro front, the softer German CPI inflation data triggers the expectation for a 25 basis points (bps) rate cut at the next ECB policy meeting in October. This, in turn, might cap the upside for the shared currency. The ECB President Lagarde noted on Monday that the central bank is increasingly confident that inflation will fall to its 2% target and this will be reflected in its next policy move, hinting yet about a coming interest rate reduction. The markets raise their bets on a reduction in borrowing costs at the October meeting after Lagarde's speech.ECB FAQs
The European Central Bank (ECB) in Frankfurt, Germany, is the reserve bank for the Eurozone. The ECB sets interest rates and manages monetary policy for the region. The ECB primary mandate is to maintain price stability, which means keeping inflation at around 2%. Its primary tool for achieving this is by raising or lowering interest rates. Relatively high interest rates will usually result in a stronger Euro and vice versa. The ECB Governing Council makes monetary policy decisions at meetings held eight times a year. Decisions are made by heads of the Eurozone national banks and six permanent members, including the President of the ECB, Christine Lagarde.
In extreme situations, the European Central Bank can enact a policy tool called Quantitative Easing. QE is the process by which the ECB prints Euros and uses them to buy assets – usually government or corporate bonds – from banks and other financial institutions. QE usually results in a weaker Euro. QE is a last resort when simply lowering interest rates is unlikely to achieve the objective of price stability. The ECB used it during the Great Financial Crisis in 2009-11, in 2015 when inflation remained stubbornly low, as well as during the covid pandemic.
Quantitative tightening (QT) is the reverse of QE. It is undertaken after QE when an economic recovery is underway and inflation starts rising. Whilst in QE the European Central Bank (ECB) purchases government and corporate bonds from financial institutions to provide them with liquidity, in QT the ECB stops buying more bonds, and stops reinvesting the principal maturing on the bonds it already holds. It is usually positive (or bullish) for the Euro.
-
00:00
GBP/USD Forecast: Pound Sterling loses strength after failing to clear technical hurdle
- GBP/USD retreats to the 1.2300 area after posting small losses on Wednesday.
- The technical picture points to a diminishing buyer interest in the near term.
- The US economic calendar will feature weekly Initial Jobless Claims data.
GBP/USD climbed to a two-week-high near 1.2380 in the European session on Wednesday but lost its traction to close the day marginally lower. The pair edges lower toward 1.2300 in the European morning on Thursday and the technical outlook highlights a loss of bullish momentum in the near term.
British Pound PRICE This week
The table below shows the percentage change of British Pound (GBP) against listed major currencies this week. British Pound was the strongest against the Japanese Yen.
USD EUR GBP JPY CAD AUD NZD CHF USD -1.19% -1.07% 0.23% -0.53% -1.22% -1.23% -0.64% EUR 1.19% 0.06% 1.35% 0.56% 0.02% -0.16% 0.43% GBP 1.07% -0.06% 1.21% 0.50% -0.02% -0.22% 0.36% JPY -0.23% -1.35% -1.21% -0.75% -1.41% -1.56% -1.06% CAD 0.53% -0.56% -0.50% 0.75% -0.63% -0.71% -0.14% AUD 1.22% -0.02% 0.02% 1.41% 0.63% -0.27% 0.33% NZD 1.23% 0.16% 0.22% 1.56% 0.71% 0.27% 0.40% CHF 0.64% -0.43% -0.36% 1.06% 0.14% -0.33% -0.40% The heat map shows percentage changes of major currencies against each other. The base currency is picked from the left column, while the quote currency is picked from the top row. For example, if you pick the British Pound from the left column and move along the horizontal line to the US Dollar, the percentage change displayed in the box will represent GBP (base)/USD (quote).
The US Dollar (USD) came under bearish pressure in the first half of the day on Wednesday as risk flows dominated the action in financial markets. Although Wall Street's main indexes opened higher, rising US Treasury bond yields helped the USD hold its ground in the American session.
The US Department of Labor will publish the weekly Initial Jobless Claims data later in the day. Investors forecast the number of first-time applications for unemployment benefits to rise to 220,000 in the week ending January 18 from 217,000 in the previous week. A print below 210,000 could allow the USD to gather strength and force GBP/USD to stay on the back foot. In case this data comes in above 230,000, it would point to a cooldown in the labor market and weigh on the USD.
On Friday, preliminary January Manufacturing and Services PMI reports from the UK and the US could provide important directional clues for GBP/USD heading into the weekend.
GBP/USD Technical Analysis
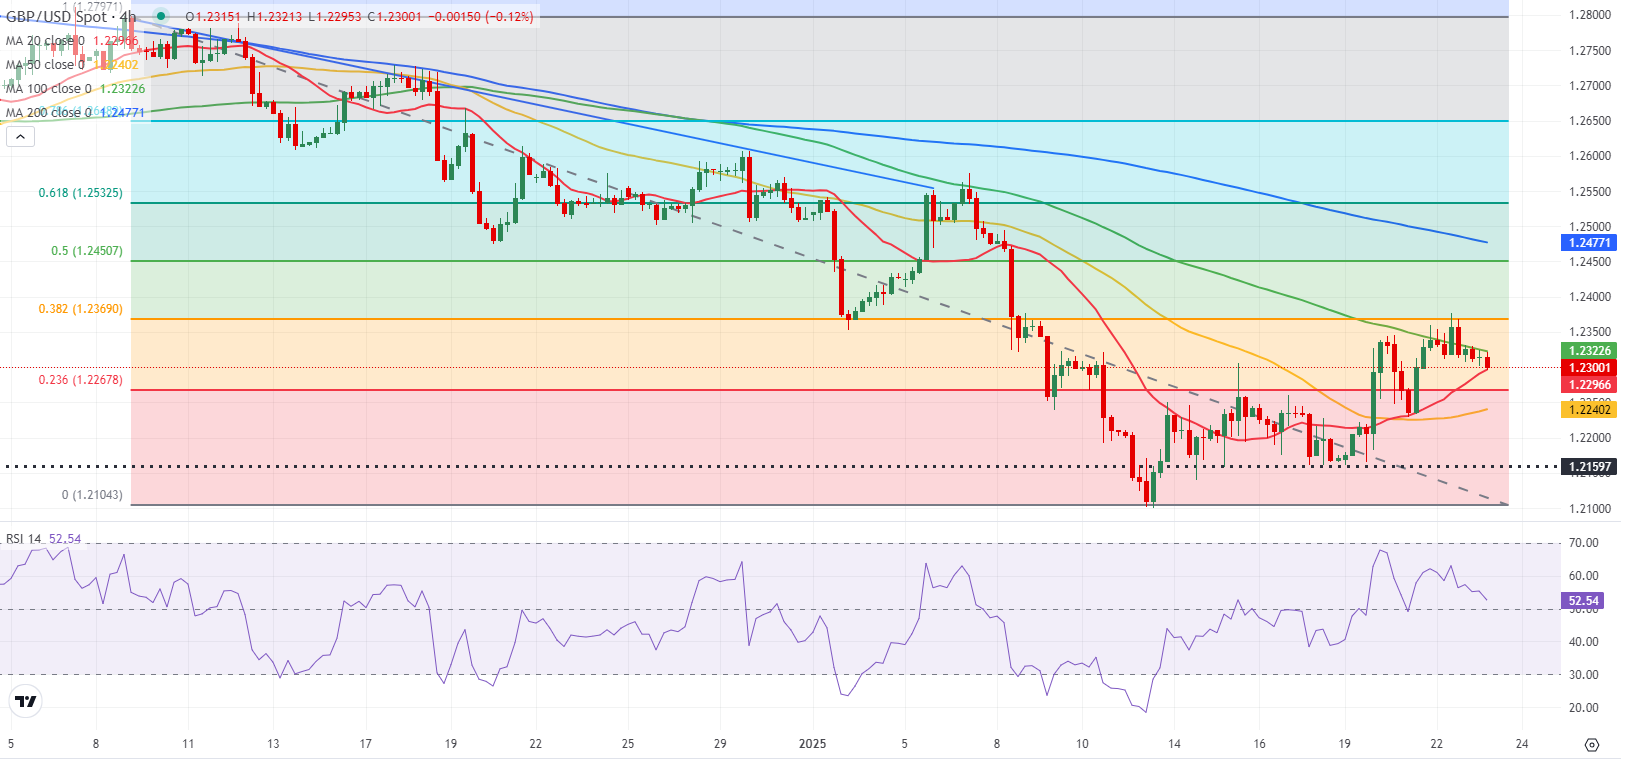
The Relative Strength Index indicator on the 4-hour chart retreats toward 50 and GBP/USD remains below the 100-period Simple Moving Average (SMA), currently located at 1.2320, after closing the last four candles below that level, reflecting buyers' hesitancy.
On the downside, 1.2270 (Fibonacci 23.6% retracement level of the latest downtrend) aligns as first support before 1.2240 (50-period SMA) and 1.2200 (round level, static level).
In case GBP/USD stabilizes above 1.2320 (100-period SMA), it could face stiff resistance at 1.2360-1.2370 (20-day SMA, Fibonacci 38.2% retracement) before testing 1.2400 (round level, static level).
Pound Sterling FAQs
The Pound Sterling (GBP) is the oldest currency in the world (886 AD) and the official currency of the United Kingdom. It is the fourth most traded unit for foreign exchange (FX) in the world, accounting for 12% of all transactions, averaging $630 billion a day, according to 2022 data. Its key trading pairs are GBP/USD, also known as ‘Cable’, which accounts for 11% of FX, GBP/JPY, or the ‘Dragon’ as it is known by traders (3%), and EUR/GBP (2%). The Pound Sterling is issued by the Bank of England (BoE).
The single most important factor influencing the value of the Pound Sterling is monetary policy decided by the Bank of England. The BoE bases its decisions on whether it has achieved its primary goal of “price stability” – a steady inflation rate of around 2%. Its primary tool for achieving this is the adjustment of interest rates. When inflation is too high, the BoE will try to rein it in by raising interest rates, making it more expensive for people and businesses to access credit. This is generally positive for GBP, as higher interest rates make the UK a more attractive place for global investors to park their money. When inflation falls too low it is a sign economic growth is slowing. In this scenario, the BoE will consider lowering interest rates to cheapen credit so businesses will borrow more to invest in growth-generating projects.
Data releases gauge the health of the economy and can impact the value of the Pound Sterling. Indicators such as GDP, Manufacturing and Services PMIs, and employment can all influence the direction of the GBP. A strong economy is good for Sterling. Not only does it attract more foreign investment but it may encourage the BoE to put up interest rates, which will directly strengthen GBP. Otherwise, if economic data is weak, the Pound Sterling is likely to fall.
Another significant data release for the Pound Sterling is the Trade Balance. This indicator measures the difference between what a country earns from its exports and what it spends on imports over a given period. If a country produces highly sought-after exports, its currency will benefit purely from the extra demand created from foreign buyers seeking to purchase these goods. Therefore, a positive net Trade Balance strengthens a currency and vice versa for a negative balance.
-
00:00
EUR/USD Forecast: Euro recovery could pick up steam after German inflation data
- EUR/USD trades in positive territory above 1.0300 on Monday.
- Regional and nation-wide inflation data from Germany will be watched closely.
- The technical outlook points to a loss of bearish momentum in the near term.
After closing in positive territory on Friday, EUR/USD continues to edge higher and trades above 1.0300 in the European morning on Monday. Regional and nation-wide inflation data from Germany could drive the Euro's valuation later in the session.
Euro PRICE Last 7 days
The table below shows the percentage change of Euro (EUR) against listed major currencies last 7 days. Euro was the weakest against the Australian Dollar.
USD EUR GBP JPY CAD AUD NZD CHF USD 0.90% 0.96% -0.03% -0.15% -0.22% 0.05% 0.67% EUR -0.90% 0.05% -0.96% -1.09% -1.19% -0.89% -0.28% GBP -0.96% -0.05% -1.00% -1.14% -1.24% -0.95% -0.33% JPY 0.03% 0.96% 1.00% -0.13% -0.14% 0.24% 0.78% CAD 0.15% 1.09% 1.14% 0.13% -0.08% 0.27% 0.82% AUD 0.22% 1.19% 1.24% 0.14% 0.08% 0.30% 0.92% NZD -0.05% 0.89% 0.95% -0.24% -0.27% -0.30% 0.62% CHF -0.67% 0.28% 0.33% -0.78% -0.82% -0.92% -0.62% The heat map shows percentage changes of major currencies against each other. The base currency is picked from the left column, while the quote currency is picked from the top row. For example, if you pick the Euro from the left column and move along the horizontal line to the US Dollar, the percentage change displayed in the box will represent EUR (base)/USD (quote).
The improving risk mood heading into the weekend made it difficult for the US Dollar (USD) to find demand and helped EUR/USD erase a portion of its weekly losses on Friday.
Early Monday, US stock index futures trade marginally higher on the day, not allowing the USD to stay resilient against its rivals.
Inflation in Germany, as measured by the change in the Consumer Price Index (CPI), is forecast to rise to 2.4% on a yearly basis in December from 2.2% in November. In case the CPI rises at a stronger pace than expected, the Euro could gather strength. Investors will also pay close attention to regional CPI figures from Germany. If these data arrive generally higher than anticipated, this could be seen as a sign pointing to a positive surprise in the headline print and provide an early boost to the Euro.
On Tuesday, Eurozone inflation data and ISM Services PMI report from the US could influence EUR/USD's action.
EUR/USD Technical Analysis
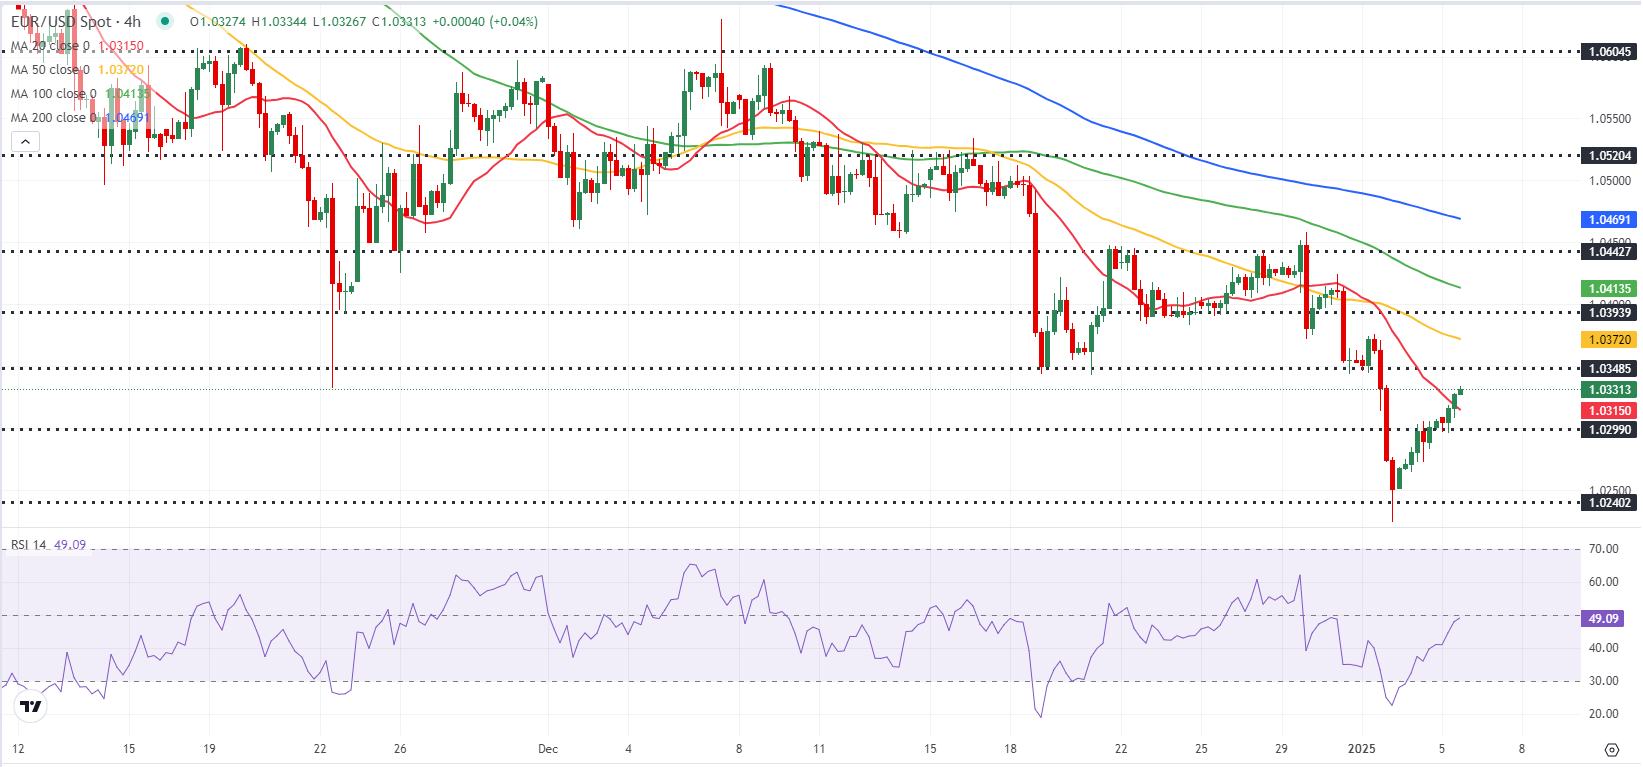
The Relative Strength Index (RSI) indicator on the 4-hour chart recovered to 50, reflecting the loss of bearish momentum. Additionally, EUR/USD closed the last 4-hour candle above the 20-period Simple Moving Average (SMA).
On the upside, 1.0350 (static level), could be seen as first resistance before 1.0400-1.0410 (static level, 100-period SMA) and 1.0440 (static level). Looking south, supports could be spotted at 1.0300 (static level, round level), 1.0240 (static level) and 1.0200 (static level).
Euro FAQs
The Euro is the currency for the 19 European Union countries that belong to the Eurozone. It is the second most heavily traded currency in the world behind the US Dollar. In 2022, it accounted for 31% of all foreign exchange transactions, with an average daily turnover of over $2.2 trillion a day. EUR/USD is the most heavily traded currency pair in the world, accounting for an estimated 30% off all transactions, followed by EUR/JPY (4%), EUR/GBP (3%) and EUR/AUD (2%).
The European Central Bank (ECB) in Frankfurt, Germany, is the reserve bank for the Eurozone. The ECB sets interest rates and manages monetary policy. The ECB’s primary mandate is to maintain price stability, which means either controlling inflation or stimulating growth. Its primary tool is the raising or lowering of interest rates. Relatively high interest rates – or the expectation of higher rates – will usually benefit the Euro and vice versa. The ECB Governing Council makes monetary policy decisions at meetings held eight times a year. Decisions are made by heads of the Eurozone national banks and six permanent members, including the President of the ECB, Christine Lagarde.
Eurozone inflation data, measured by the Harmonized Index of Consumer Prices (HICP), is an important econometric for the Euro. If inflation rises more than expected, especially if above the ECB’s 2% target, it obliges the ECB to raise interest rates to bring it back under control. Relatively high interest rates compared to its counterparts will usually benefit the Euro, as it makes the region more attractive as a place for global investors to park their money.
Data releases gauge the health of the economy and can impact on the Euro. Indicators such as GDP, Manufacturing and Services PMIs, employment, and consumer sentiment surveys can all influence the direction of the single currency. A strong economy is good for the Euro. Not only does it attract more foreign investment but it may encourage the ECB to put up interest rates, which will directly strengthen the Euro. Otherwise, if economic data is weak, the Euro is likely to fall. Economic data for the four largest economies in the euro area (Germany, France, Italy and Spain) are especially significant, as they account for 75% of the Eurozone’s economy.
Another significant data release for the Euro is the Trade Balance. This indicator measures the difference between what a country earns from its exports and what it spends on imports over a given period. If a country produces highly sought after exports then its currency will gain in value purely from the extra demand created from foreign buyers seeking to purchase these goods. Therefore, a positive net Trade Balance strengthens a currency and vice versa for a negative balance.
-
00:00
Gold Price Forecast: XAU/USD buyers stay hopeful whilst above 38.2% Fibo level at $2,700
- The US Dollar stalls with Treasury bond yields as Tesla’s earnings report lifts mood.
- Technically, Gold price appears a ‘buy-the-dips’ trade, 38.2% Fibo level holds the key.
Gold price is reversing a part of Wednesday’s correction from record highs of $2,759 early Thursday. Gold buyers draw support from a pause in the US Dollar (USD) advance, as the US Treasury bond yields rally takes a breather in the lead-up to the preliminary S&P Global US PMI data.
Gold price looks to US PMI data for further incentives
The minor pullback in the USD alongside the US Treasury bond yields could be attributed to a stabilizing market mood in Asia, following Wall Street’s tech sell-off overnight. US equity futures rebound amid a risk reset after investors breathed a sigh of relief on Tesla Inc.’s encouraging earnings report.
Tesla reported adjusted earnings of 72 cents per share for the quarter, above the average analyst estimate and snapping four consecutive quarters in which the measure missed expectations, per CNBC News. The company said its Cybertruck, which it first delivered late last year, has reached profitability for the first time,
The further upside in Gold price, however, remains at the mercy of the upcoming Euro area and the US preliminary business PMI data. Investors will seek cues on the health of the global economy, impacting risk sentiment and safe-havens such as the USD, Gold price, etc.
The US S&P Global preliminary Manufacturing PMI is seen ticking higher to 47.5 in October from September’s 47.3 while the Services PMI is set to edge a tad lower to 55.0 in the same period from 55.2 in September.
Meanwhile, the market’s nervousness ahead of key US earnings reports and the presidential election will also play its part in driving the sentiment around Gold price. Any potential decline in Gold price is likely to be bought into, as buyers could re-emerge on Gold’s safe-haven demand due to the November 5 US election and the ongoing Middle East conflict.
Gold price technical analysis: Daily chart
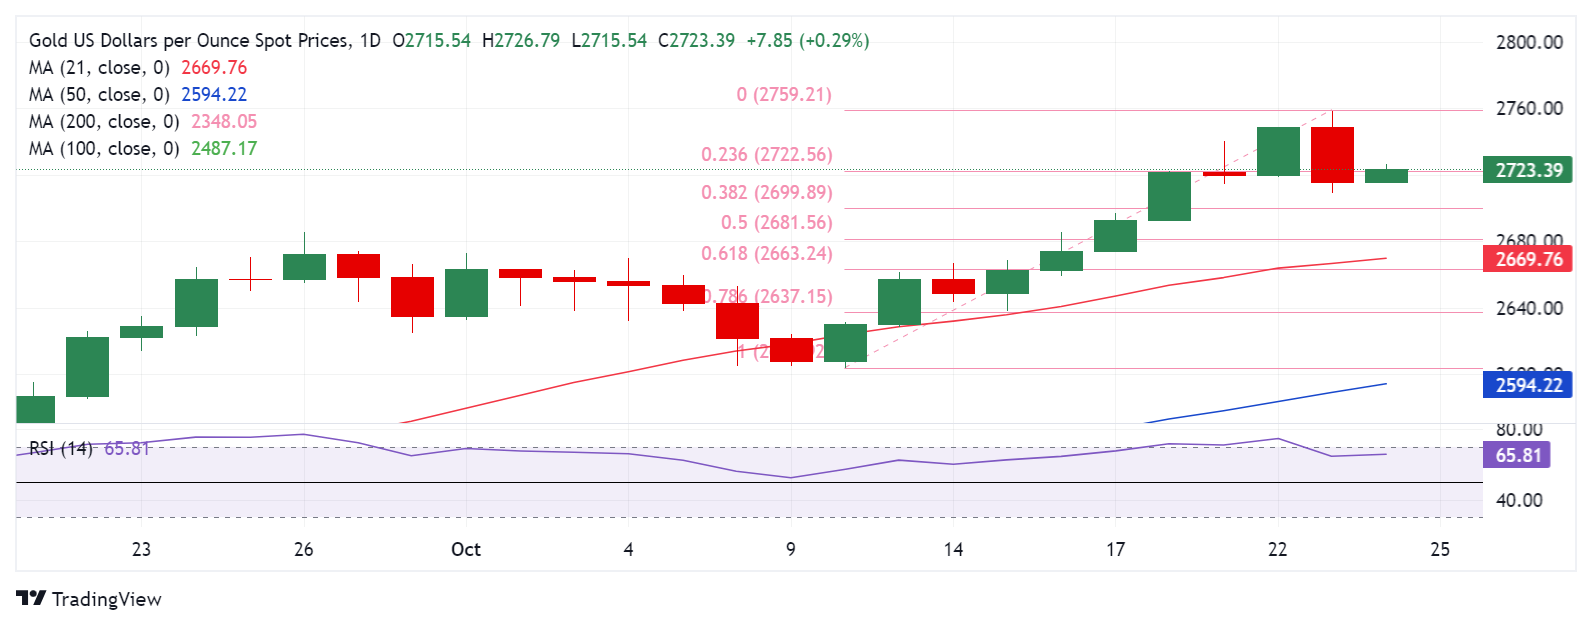
Gold price seems to be facing stiff resistance at $2,723, the 23.6% Fibonacci Retracement (Fibo) level of the latest record rally from the October 10 low of $2,604 to an all-time high of $2,759.
Acceptance above that level could encourage buyers to take on the $2,750 psychological barrier. The record high of $2,759 will be next on buyers’ radars.
The 14-day Relative Strength Index (RSI) is flattish but well above the 50 level, currently trading near 65.60, pointing to more upside momentum.
However, if Gold sellers jump back into the game, the 38.2% Fibo level of the same ascent at $2,700 will come to the rescue of buyers.
A sustained move below the latter will put the 50% Fibo support at $2,682 to the test.
The line in the sand for Gold optimists is aligned at the 21-day Simple Moving Average (SMA) at $2,670.
-
00:00
EUR/USD Forecast: Euro turns bearish, tests key support
- EUR/USD holds steady near 1.0800 following Wednesday's sharp decline.
- A daily close below 1.0790 could attract technical sellers.
- US Bureau of Economic Analysis will release the second estimate of Q1 GDP.
EUR/USD came under heavy bearish pressure in the American session on Wednesday and closed the day deep in negative territory as safe-haven flows dominated the action in financial markets. After dipping to its lowest level in two weeks below 1.0800 in the Asian session on Thursday, the pair recovered back above 1.0800.
Euro PRICE This week
The table below shows the percentage change of Euro (EUR) against listed major currencies this week. Euro was the weakest against the Swiss Franc.
USD EUR GBP JPY CAD AUD NZD CHF USD 0.37% 0.30% 0.00% 0.41% 0.32% 0.25% -0.49% EUR -0.37% -0.10% -0.32% 0.04% -0.12% -0.22% -0.83% GBP -0.30% 0.10% -0.28% 0.12% -0.00% -0.05% -0.76% JPY 0.00% 0.32% 0.28% 0.35% 0.28% 0.32% -0.54% CAD -0.41% -0.04% -0.12% -0.35% -0.10% -0.16% -0.96% AUD -0.32% 0.12% 0.00% -0.28% 0.10% -0.02% -0.75% NZD -0.25% 0.22% 0.05% -0.32% 0.16% 0.02% -0.75% CHF 0.49% 0.83% 0.76% 0.54% 0.96% 0.75% 0.75% The heat map shows percentage changes of major currencies against each other. The base currency is picked from the left column, while the quote currency is picked from the top row. For example, if you pick the Euro from the left column and move along the horizontal line to the US Dollar, the percentage change displayed in the box will represent EUR (base)/USD (quote).
Following Tuesday's decline, Wall Street's main indexes opened lower on Wednesday and continued to push lower. The Dow Jones Industrial Average lost over 1% on the day and the S&P 500 fell 0.75%. The US Dollar (USD) capitalized on risk aversion, with the USD Index reaching its highest level since May 14 above 105.00.
Early Thursday, US stock index futures are down between 0.5% and 0.8%, suggesting that markets could remain risk-averse in the second half of the day.
The US Bureau of Economic Analysis (BEA) will release its second estimate of the Gross Domestic Product (GDP) for the first quarter. In the initial estimate, the BEA announced that the US' GDP expanded at an annual rate of 1.6%. Markets expect a downward revision to 1.3% in the second estimate. In case there is a bigger downward revision, the USD could struggle to find demand, even if US stocks stay in the red. On the other hand, a better-than-forecast print could support the USD and weigh on EUR/USD.
The US economic docket will also feature weekly Initial Jobless Claims data. A reading near 200K could provide a boost to the USD, while an unexpected increase toward 230K could hurt the USD.
EUR/USD Technical Analysis
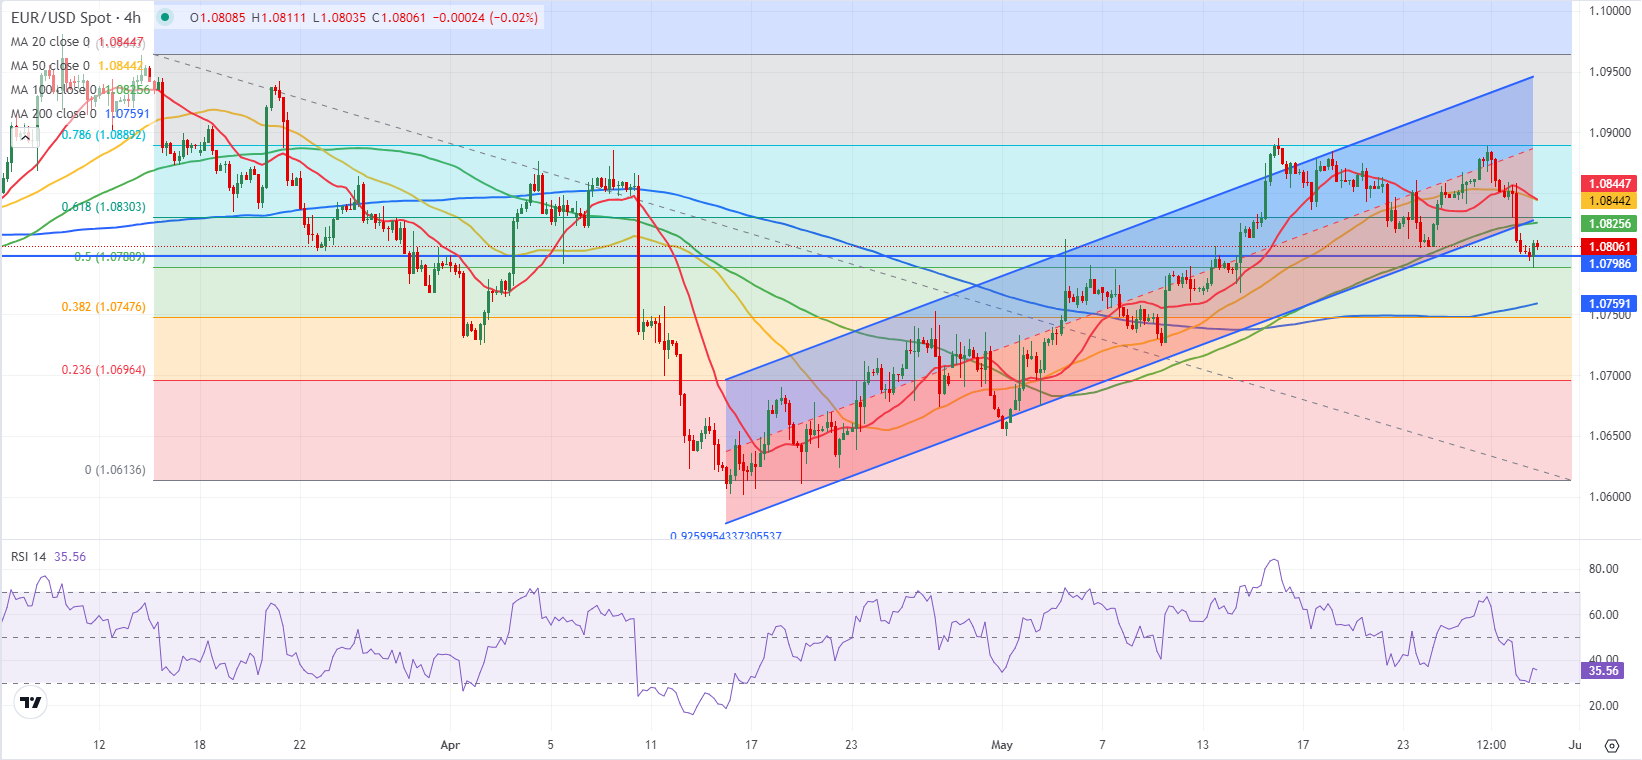
EUR/USD dropped below the lower limit of the ascending regression channel and the Relative Strength Index (RSI) indicator on the 4-hour chart fell below 40, highlighting a bearish tilt in the near term.
The 200-day Simple Moving Average (SMA) aligns as key support at 1.0790. In case the pair makes a daily close below that level and starts using it as resistance, technical sellers could remain interested. In this scenario, 1.0760-1.0750 (200-period SMA on the 4-hour chart, Fibonacci 38.2% retracement of the latest downtrend) could be seen as next support before 1.0700 (psychological level, Fibonacci 23.6% retracement).
Risk sentiment FAQs
In the world of financial jargon the two widely used terms “risk-on” and “risk off'' refer to the level of risk that investors are willing to stomach during the period referenced. In a “risk-on” market, investors are optimistic about the future and more willing to buy risky assets. In a “risk-off” market investors start to ‘play it safe’ because they are worried about the future, and therefore buy less risky assets that are more certain of bringing a return, even if it is relatively modest.
Typically, during periods of “risk-on”, stock markets will rise, most commodities – except Gold – will also gain in value, since they benefit from a positive growth outlook. The currencies of nations that are heavy commodity exporters strengthen because of increased demand, and Cryptocurrencies rise. In a “risk-off” market, Bonds go up – especially major government Bonds – Gold shines, and safe-haven currencies such as the Japanese Yen, Swiss Franc and US Dollar all benefit.
The Australian Dollar (AUD), the Canadian Dollar (CAD), the New Zealand Dollar (NZD) and minor FX like the Ruble (RUB) and the South African Rand (ZAR), all tend to rise in markets that are “risk-on”. This is because the economies of these currencies are heavily reliant on commodity exports for growth, and commodities tend to rise in price during risk-on periods. This is because investors foresee greater demand for raw materials in the future due to heightened economic activity.
The major currencies that tend to rise during periods of “risk-off” are the US Dollar (USD), the Japanese Yen (JPY) and the Swiss Franc (CHF). The US Dollar, because it is the world’s reserve currency, and because in times of crisis investors buy US government debt, which is seen as safe because the largest economy in the world is unlikely to default. The Yen, from increased demand for Japanese government bonds, because a high proportion are held by domestic investors who are unlikely to dump them – even in a crisis. The Swiss Franc, because strict Swiss banking laws offer investors enhanced capital protection.
-
00:00
EUR/GBP declines to and below 0.8300 – Danske Bank
EUR/GBP declined close to the 0.8300 mark during yesterday's session. GBP FX is in for an eventful week packed with macro data releases , Danske Bank's FX analyst Mohamad Al-Saraf reports.
EUR/GBP to trade lower in weeks to come
"This morning, we get the labour market report for December/January. Consensus expects a pick up in wage growth and unemployment to rise to 4.5% from 4.4%. Payrolls have come in to the weak side the past months and vacancies have edged lower with surveys indicating a further weakening in labour demand."
"We think the BoE is set for the next cut in May. We also published a note on how the notion of US tariffs affects the UK and by extension GBP. Overall, the UK looks better insulated against possible US tariffs on UK goods than the euro area."
"The UK mainly exports services to the US, it does not have a big US-trade deficit and US President Trump has a better relationship with UK PM Starmer. We think this favours GBP vs EUR, supporting our strategically bearish view on EUR/GBP."
-
00:00
EUR/USD Forecast: Euro looks to extend sideways action
- EUR/USD trades in a narrow channel near 1.0400 early Tuesday.
- Trading action is likely to remain subdued on Christmas Eve.
- Technical picture highlights the pair's indecisiveness in the near term.
EUR/USD closed marginally lower on Monday but the pair remained confined within a tight channel. The pair fluctuates near 1.0400 in the European morning on Tuesday as trading conditions thin out on Christmas Eve.
Euro PRICE Last 7 days
The table below shows the percentage change of Euro (EUR) against listed major currencies last 7 days. Euro was the weakest against the US Dollar.
USD EUR GBP JPY CAD AUD NZD CHF USD 1.09% 1.16% 1.87% 0.88% 1.96% 2.33% 0.60% EUR -1.09% 0.07% 0.75% -0.21% 0.85% 1.22% -0.48% GBP -1.16% -0.07% 0.71% -0.27% 0.78% 1.15% -0.54% JPY -1.87% -0.75% -0.71% -0.95% 0.14% 0.49% -1.17% CAD -0.88% 0.21% 0.27% 0.95% 1.07% 1.43% -0.26% AUD -1.96% -0.85% -0.78% -0.14% -1.07% 0.36% -1.33% NZD -2.33% -1.22% -1.15% -0.49% -1.43% -0.36% -1.67% CHF -0.60% 0.48% 0.54% 1.17% 0.26% 1.33% 1.67% The heat map shows percentage changes of major currencies against each other. The base currency is picked from the left column, while the quote currency is picked from the top row. For example, if you pick the Euro from the left column and move along the horizontal line to the US Dollar, the percentage change displayed in the box will represent EUR (base)/USD (quote).
Mixed macroeconomic data releases from the US limited the US Dollar's (USD) gains on Monday and helped EUR/USD find a foothold.
The US Census Bureau reported that Durable Goods Orders declined by 1.1% on a monthly basis in November, coming in worse than the market expectation for a decrease of 0.4%. Meanwhile, the Conference Board's Consumer Confidence Index fell to 104.7 in December from 112.8 (revised from 111.7) in November. On a positive note, New Home Sales increased by 5.9% in November following the 14.8% decrease recorded in October.
The economic calendar will not feature any macroeconomic data releases. Bond and stock markets in the US will operate half day on Tuesday and remain closed on Christmas Day on Wednesday.
EUR/USD Technical Analysis
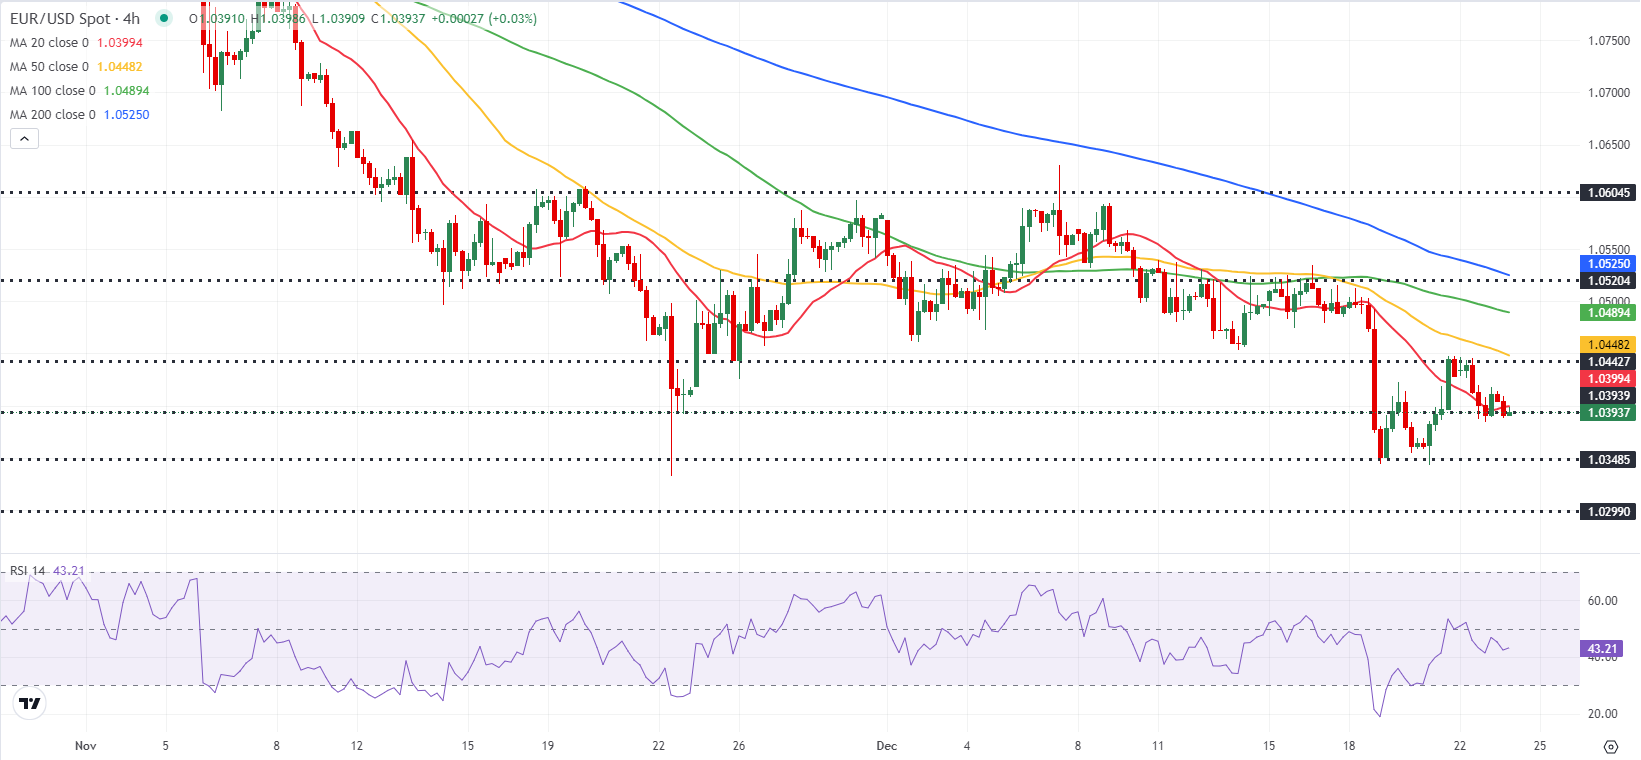
The Relative Strength Index (RSI) indicator on the 4-hour chart stays slightly below 50 but EUR/USD fluctuates at around the 20-period Simple Moving Average (SMA), highlighting a lack of directional momentum.
First resistance could be spotted at 1.0440 (static level) before 1.0490-1.0500, (100-period Simple Moving Average (SMA), static level). On the downside, 1.0350 (static level) and 1.0300 (static level, round level) could be seen as next support levels if EUR/USD confirms 1.0400 (static level, round level) as resistance.
Euro FAQs
The Euro is the currency for the 19 European Union countries that belong to the Eurozone. It is the second most heavily traded currency in the world behind the US Dollar. In 2022, it accounted for 31% of all foreign exchange transactions, with an average daily turnover of over $2.2 trillion a day. EUR/USD is the most heavily traded currency pair in the world, accounting for an estimated 30% off all transactions, followed by EUR/JPY (4%), EUR/GBP (3%) and EUR/AUD (2%).
The European Central Bank (ECB) in Frankfurt, Germany, is the reserve bank for the Eurozone. The ECB sets interest rates and manages monetary policy. The ECB’s primary mandate is to maintain price stability, which means either controlling inflation or stimulating growth. Its primary tool is the raising or lowering of interest rates. Relatively high interest rates – or the expectation of higher rates – will usually benefit the Euro and vice versa. The ECB Governing Council makes monetary policy decisions at meetings held eight times a year. Decisions are made by heads of the Eurozone national banks and six permanent members, including the President of the ECB, Christine Lagarde.
Eurozone inflation data, measured by the Harmonized Index of Consumer Prices (HICP), is an important econometric for the Euro. If inflation rises more than expected, especially if above the ECB’s 2% target, it obliges the ECB to raise interest rates to bring it back under control. Relatively high interest rates compared to its counterparts will usually benefit the Euro, as it makes the region more attractive as a place for global investors to park their money.
Data releases gauge the health of the economy and can impact on the Euro. Indicators such as GDP, Manufacturing and Services PMIs, employment, and consumer sentiment surveys can all influence the direction of the single currency. A strong economy is good for the Euro. Not only does it attract more foreign investment but it may encourage the ECB to put up interest rates, which will directly strengthen the Euro. Otherwise, if economic data is weak, the Euro is likely to fall. Economic data for the four largest economies in the euro area (Germany, France, Italy and Spain) are especially significant, as they account for 75% of the Eurozone’s economy.
Another significant data release for the Euro is the Trade Balance. This indicator measures the difference between what a country earns from its exports and what it spends on imports over a given period. If a country produces highly sought after exports then its currency will gain in value purely from the extra demand created from foreign buyers seeking to purchase these goods. Therefore, a positive net Trade Balance strengthens a currency and vice versa for a negative balance.
-
00:00
USD: Rates, liquidity and geopolitics keep dollar supported – ING
Yesterday's news of the brief imposition of martial law in South Korea came as a shock. Korean currency and asset markets play a significant role in the investment universe, where the Korean won is the 12th most traded currency in the world (BIS 2022) and its government bonds make up 9-10% of emerging market local currency bond indices. Indeed, Korea recently celebrated its inclusion into the FTSE Russell's World Government Bond Index. Global investors will therefore be closely monitoring developments in Korea over the coming days, ING’s FX analysts Chirs Turner notes.
DXY to find good buying interest under 106.00
“USD strength is not entirely being led by the second coming of Donald Trump. A lame duck government in Germany and potentially France too today if a no-confidence vote is successful, plus this Korean news, will only add to confidence that the relatively high rates (USD one-week deposit rates at 4.6%) and liquidity make the dollar the most compelling currency in which to park cash balances right now. Yes, there is the risk that US macro data softens a little and can drag the dollar a little softer, but taking defensive positions in something like the Japanese yen (deposit rate at 0.11%) or Swiss franc (0.86%) can be expensive.”
“In focus for the US today is ADP employment data (1415CET) and ISM Services (16CET). The ADP number has been discredited this year, but the ISM services number occasionally moves markets. There seems no reason to see a sharp fall here and actually the JOLTS job opening data we discussed yesterday came in better than expected.”
“Perhaps more interesting today will be Fed communication. Fed Chair Jerome Powell speaks in a moderated New York Times discussion at 1940CET. And the Fed's Beige Book is released at 2000CET. Both can provide a little colour ahead of the FOMC meeting on 18 December, where the Fed looks minded to ease policy. A 25bp cut is not fully priced and softer short-dated US rates could drag the dollar a little softer. Yet there are plenty of reasons to suspect the Dollar Index will find good buying interest under 106.00.”
-
00:00
India Gold price today: Gold falls, according to FXStreet data
Gold prices fell in India on Thursday, according to data compiled by FXStreet.
The price for Gold stood at 7,648.11 Indian Rupees (INR) per gram, down compared with the INR 7,657.72 it cost on Wednesday.
The price for Gold decreased to INR 89,197.81 per tola from INR 89,318.18 per tola a day earlier.
Unit measure Gold Price in INR 1 Gram 7,648.11 10 Grams 76,474.04 Tola 89,197.81 Troy Ounce 237,883.00 FXStreet calculates Gold prices in India by adapting international prices (USD/INR) to the local currency and measurement units. Prices are updated daily based on the market rates taken at the time of publication. Prices are just for reference and local rates could diverge slightly.
Gold FAQs
Gold has played a key role in human’s history as it has been widely used as a store of value and medium of exchange. Currently, apart from its shine and usage for jewelry, the precious metal is widely seen as a safe-haven asset, meaning that it is considered a good investment during turbulent times. Gold is also widely seen as a hedge against inflation and against depreciating currencies as it doesn’t rely on any specific issuer or government.
Central banks are the biggest Gold holders. In their aim to support their currencies in turbulent times, central banks tend to diversify their reserves and buy Gold to improve the perceived strength of the economy and the currency. High Gold reserves can be a source of trust for a country’s solvency. Central banks added 1,136 tonnes of Gold worth around $70 billion to their reserves in 2022, according to data from the World Gold Council. This is the highest yearly purchase since records began. Central banks from emerging economies such as China, India and Turkey are quickly increasing their Gold reserves.
Gold has an inverse correlation with the US Dollar and US Treasuries, which are both major reserve and safe-haven assets. When the Dollar depreciates, Gold tends to rise, enabling investors and central banks to diversify their assets in turbulent times. Gold is also inversely correlated with risk assets. A rally in the stock market tends to weaken Gold price, while sell-offs in riskier markets tend to favor the precious metal.
The price can move due to a wide range of factors. Geopolitical instability or fears of a deep recession can quickly make Gold price escalate due to its safe-haven status. As a yield-less asset, Gold tends to rise with lower interest rates, while higher cost of money usually weighs down on the yellow metal. Still, most moves depend on how the US Dollar (USD) behaves as the asset is priced in dollars (XAU/USD). A strong Dollar tends to keep the price of Gold controlled, whereas a weaker Dollar is likely to push Gold prices up.
(An automation tool was used in creating this post.)
-