Market news
-
20:08
Major US stock indexes finished trading below the zero mark
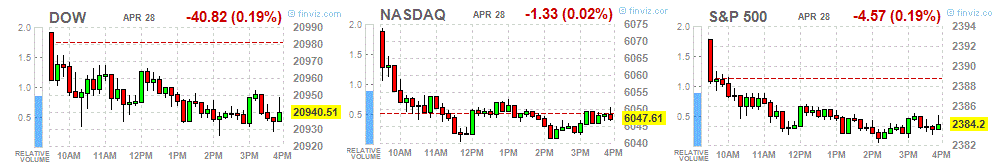
Major US stock indices fell slightly on Friday after data showed that the economy grew at its weakest pace in three years in the first quarter. Gross domestic product grew by 0.7% on an annualized basis, below the 1.1% level estimated by economists, as consumer spending barely increased, and enterprises less invested in inventories. In the fourth quarter, the US economy grew by 2.1%.
In addition, Chicago's purchasing managers' index rose to 58.3 in April from 57.7 in March, the highest level since January 2015. Optimism among firms in terms of doing business grew for the third month in a row. Three of the five components of the index led to an increase in April, while production and unfulfilled orders declined.
The cost of oil has slightly increased after the day before the price reached a monthly minimum. Investors bought oil at lower prices ahead of the OPEC meeting next month, at which producers can approve the extension of the oil production pact. Most analysts polled by Reuters expect that the deal between the Organization of Petroleum Exporting Countries and non-OPEC producers, concluded in December 2016, will be extended until the end of this year. Analysts also said that the demand and supply on the oil market could return to the balance sheet by the end of this year, if the deal to reduce production is extended.
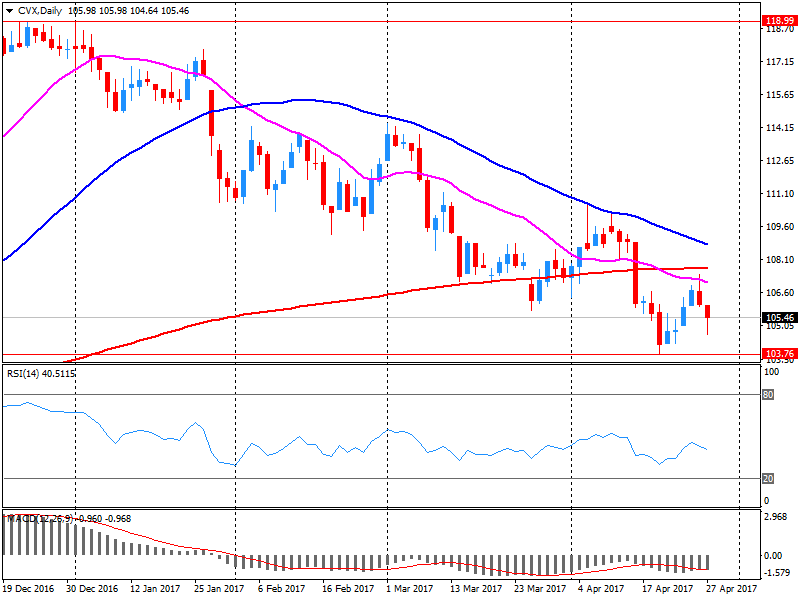
Most components of the DOW index finished trading in the red (21 out of 30). The most fell shares of Intel Corporation (INTC, -3.57%). The leader of growth was shares of Chevron Corporation (CVX, + 1.04%).
Most sectors of the S & P index showed a decline. The financial sector fell most of all (-0.7%). The leader of growth was the technological sector (+ 0.4%).
At this moment:
Dow -0.20% 20.940.30 -41.03
Nasdaq -0.02% 6,047.61 -1.33
S & P -0.19% 2,384.15 -4.62
-
19:00
DJIA -0.19% 20,940.74 -40.59 Nasdaq -0.07% 6,044.79 -4.15 S&P -0.20% 2,384.03 -4.74
-
17:05
U.S.: Baker Hughes Oil Rig Count, April 697
-
16:00
European stocks closed: FTSE 100 -33.23 7203.94 -0.46% DAX -5.78 12438.01 -0.05% CAC 40 -4.37 5267.33 -0.08%
-
14:00
U.S.: Reuters/Michigan Consumer Sentiment Index, April 97 (forecast 98)
-
13:45
U.S.: Chicago Purchasing Managers' Index , April 58.3 (forecast 56.4)
-
13:33
Federal funds futures imply traders see 75 pct chance Fed raising rates at june policy meeting vs 70 pct before release of q1 gdp, employment cost data - CME group's Fedwatch
-
Federal funds futures imply traders see 87 pct chance Fed raising rates at Sept policy meeting vs 83 pct before q1 gdp, employment cost data
-
-
13:32
U.S. Stocks open: Dow -0.05%, Nasdaq +0.39%, S&P +0.08%
-
13:31
Option expiries for today's 10:00 ET NY cut
USDJPY 109.00 / 05/10 , 109.25, 109.35, 110.00 (1.02bn), 110,15, 110,35, 110,50 (522m), 110,75, 111.00 (881m), 111.50, 111.60, 112,00, 112,50
EURUSD 1,0600 (2.83bn), 1,0700 / 05, 1,0720, 1,0750 / 54, 1,0800 / 15 (605m), 1,0850 (963m), 1,0875 / 85 (643m), 1,0900 (1.91bn), 1,0915 / 25 (824m), 1,0950 (2.44bn), 1,1000 (1.02bn), 1,1035
GBPUSD, 1,2650 , 1,2700, 1,2800, 1.2850, 1.2875, 1,2900 , 1,2920 / 25, 1,3000 (971m)
AUDUSD 0,7500, 0,7550, 0,7560, 0,7600, 0,7615, 0,7640, 0,7650
EURJPY 116,00, 116,30, 116,75, 119,50, 121,86 / 122,00, 123,30
USDCHF 0,9890, 1,0095
EURGBP 0,8300, 0,8350, 0,8400
EURCHF 1,0810, 1,0850 (295m), 1,0875
-
13:22
Before the bell: S&P futures +0.06%, NASDAQ futures -0.04%
U.S. stock-index futures were little changed as investors assessed a large batch of earnings reports and preliminary data on U.S. Q1 GDP.
Stocks:
Nikkei 19,196.74 -55.13 -0.29%
Hang Seng 24,615.13 -83.35 -0.34%
Shanghai 3,154.57 +2.38 +0.08%
FTSE 7,209.31 -27.86 -0.38%
CAC 5,280.99 +9.29 +0.18%
DAX 12,445.94 +2.15 +0.02%
Crude $49.59 (+1.27%)
Gold $1,267.70 (+0.14%)
-
12:56
Wall Street. Stocks before the bell
(company / ticker / price / change ($/%) / volume)
Amazon.com Inc., NASDAQ
AMZN
947.5
29.12(3.17%)
132782
Apple Inc.
AAPL
143.9
0.11(0.08%)
659277
AT&T Inc
T
40.02
0.11(0.28%)
2250
Barrick Gold Corporation, NYSE
ABX
16.83
0.12(0.72%)
68783
Boeing Co
BA
183.2
-0.02(-0.01%)
146
Caterpillar Inc
CAT
102.7
0.02(0.02%)
4079
Chevron Corp
CVX
108.05
2.58(2.45%)
23123
Cisco Systems Inc
CSCO
33.85
0.10(0.30%)
5206
Deere & Company, NYSE
DE
111.69
0.51(0.46%)
1669
Exxon Mobil Corp
XOM
82.69
1.43(1.76%)
106920
Facebook, Inc.
FB
149.15
1.45(0.98%)
120599
Ford Motor Co.
F
11.49
0.02(0.17%)
45062
Freeport-McMoRan Copper & Gold Inc., NYSE
FCX
13.18
0.17(1.31%)
10140
General Electric Co
GE
29.19
0.11(0.38%)
24637
General Motors Company, NYSE
GM
34.8
0.26(0.75%)
768758
Google Inc.
GOOG
907.6
33.35(3.81%)
15070
Home Depot Inc
HD
156.4
0.28(0.18%)
408
HONEYWELL INTERNATIONAL INC.
HON
134.25
4.37(3.36%)
51526
Intel Corp
INTC
36.5
-0.93(-2.48%)
317196
International Business Machines Co...
IBM
160.6
0.28(0.17%)
1409
Johnson & Johnson
JNJ
124.51
0.77(0.62%)
130
JPMorgan Chase and Co
JPM
87.78
0.17(0.19%)
6810
Microsoft Corp
MSFT
68.25
-0.02(-0.03%)
383171
Nike
NKE
55.5
0.03(0.05%)
200
Pfizer Inc
PFE
33.92
0.06(0.18%)
325
Procter & Gamble Co
PG
87.48
-0.21(-0.24%)
300
Starbucks Corporation, NASDAQ
SBUX
58.8
-2.50(-4.08%)
443009
Tesla Motors, Inc., NASDAQ
TSLA
309.81
1.18(0.38%)
12695
The Coca-Cola Co
KO
43.06
0.05(0.12%)
828
Twitter, Inc., NYSE
TWTR
16.54
-0.07(-0.42%)
40895
Verizon Communications Inc
VZ
46.79
0.12(0.26%)
8348
Visa
V
91.5
-0.10(-0.11%)
334
Walt Disney Co
DIS
116
0.16(0.14%)
228
Yahoo! Inc., NASDAQ
YHOO
48.4
0.04(0.08%)
687
Yandex N.V., NASDAQ
YNDX
27.2
-0.20(-0.73%)
1820
-
12:49
Company News: Chevron (CVX) Q1 EPS beat analysts’ expectations
Chevron (CVX) reported Q1 FY 2017 earnings of $1.41 per share (versus -$0.39 in Q1 FY 2016), beating analysts' consensus estimate of $0.87.
The company's quarterly revenues amounted to $33.421 bln (+42% y/y), missing analysts' consensus estimate of $34.046 bln.
CVX rose to $107.98 (+2.38%) in pre-market trading.
-
12:49
Upgrades and downgrades before the market open
Upgrades:
Downgrades:
Amazon (AMZN) downgraded to Sector Weight from Overweight at Pacific Crest/KeyBanc Capital Mkts
Other:
Alphabet A (GOOGL) target raised to $1050 from $1025 at RBC Capital Mkts
Alphabet A (GOOGL) target raised to $725 from $700 at Wedbush
Alphabet A (GOOGL) target raised to $990 from $950 at Pivotal Research Group
Amazon (AMZN) target raised to $1100 from $900 at RBC Capital Mkts
Microsoft (MSFT) target raised to $75 from $71 at BMO Capital Markets
Microsoft (MSFT) target raised to $77 from $72 at RBC Capital Mkts
Starbucks (SBUX) reiterated at an Outperform at RBC Capital Mkts;target $66
Starbucks (SBUX) reiterated at an Outperform at Wedbush;target $65
Facebook (FB) target raised to Facebook (FB) at Needham
-
12:43
Canadian GDP flat in February
Gross domestic product was unchanged in February following three months of growth. Gains in service-producing industries were offset by declines in goods-producing industries.
Service-producing industries were up 0.2% in February following a 0.5% gain in January, the highest monthly growth rate since January 2013. Goods-producing industries were down for the first time since October, declining 0.3% in February.
The real estate and rental and leasing sector grew 0.5% in February, led by a 5.3% gain in output of real estate agents and brokers, mainly as a result of notable gains in activity in and around the Greater Toronto Area.
The finance and insurance sector was up for the fourth month in a row, rising 0.7% in February. Depository credit intermediation and monetary authorities were up 0.5%. Financial investment services, funds and other financial vehicles increased 1.4% from higher mutual fund activity related in part to the March 1 deadline for Registered Retirement Savings Plan contributions for the 2016 tax year. Insurance carriers and related activities advanced 0.7%.
-
12:42
US PCE price index increased 2.4%
The price index for gross domestic purchases increased 2.6 percent in the first quarter, compared with an increase of 2.0 percent in the fourth quarter. The PCE price index increased 2.4 percent, compared with an increase of 2.0 percent. Excluding food and energy prices, the PCE price index increased 2.0 percent, compared with an increase of 1.3 percent.
-
12:40
US preliminary GDP miss expectations in Q1. Up 0.7% vs +1.2% expected
Real gross domestic product (GDP) increased at an annual rate of 0.7 percent in the first quarter of 2017, according to the "advance" estimate released by the Bureau of Economic Analysis. In the fourth quarter of 2016, real GDP increased 2.1 percent.
The Bureau emphasized that the first-quarter advance estimate released today is based on source data that are incomplete or subject to further revision by the source agency. The "second" estimate for the first quarter, based on more complete data, will be released on May 26, 2017.
The increase in real GDP in the first quarter reflected positive contributions from nonresidential fixed investment, exports, residential fixed investment, and personal consumption expenditures (PCE), that were offset by negative contributions from private inventory investment, state and local government
spending, and federal government spending. Imports, which are a subtraction in the calculation of GDP,
increased.
The deceleration in real GDP in the first quarter reflected a deceleration in PCE and downturns in private inventory investment and in state and local government spending that were partly offset by an upturn in exports and accelerations in both nonresidential and residential fixed investment.
-
12:30
Canada: Industrial Product Price Index, y/y, March 5.1%
-
12:30
U.S.: GDP, q/q, Quarter I 0.7% (forecast 1.1%)
-
12:30
Canada: Industrial Product Price Index, m/m, March 0.8%
-
12:30
Canada: GDP (m/m) , February 0.0% (forecast 0.1%)
-
12:30
U.S.: PCE price index ex food, energy, q/q, Quarter I 2% (forecast 2%)
-
12:30
U.S.: PCE price index, q/q, Quarter I 2.4% (forecast 2.3%)
-
12:16
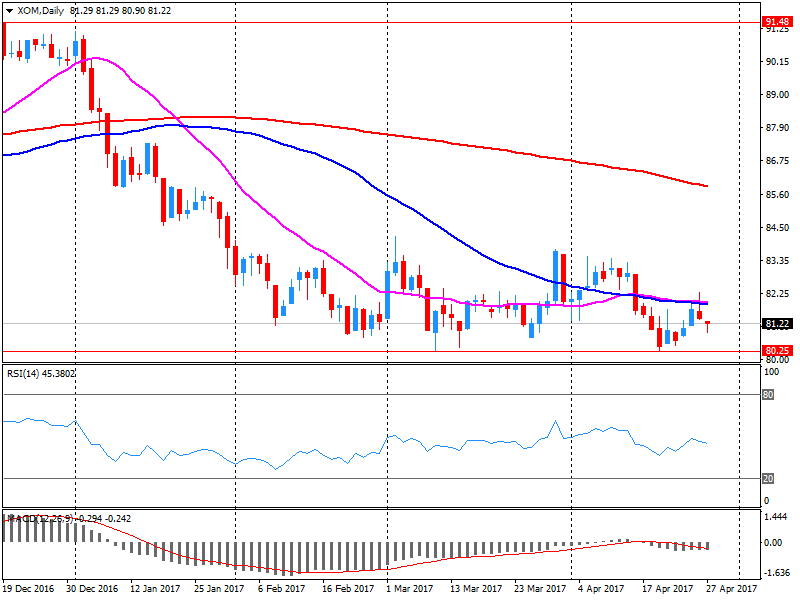
Company News: Exxon Mobil (XOM) Q1 EPS beat analysts’ estimate
Exxon Mobil (XOM) reported Q1 FY 2017 earnings of $0.95 per share (versus $0.43 in Q1 FY 2016), beating analysts' consensus estimate of $0.87.
The company's quarterly revenues amounted to $63.287 bln (29.9% y/y), missing analysts' consensus estimate of $64.877 bln.
XOM rose to $82.40 (+1.40%) in pre-market trading.
-
12:02
Orders
EUR/USD
Offers: 1.0900 1.0925 1.0935 1.0950-55 1.0980 1.1000 1.1030 1.1050
Bids: 1.0865 1.0850 1.0820 1 .0800 1.0780 1.0750 1.0700
GBP/USD
Offers: 1.2920 1.2950-60 1.2975 1.3000 1.3020 1.3050
Bids: 1.2880 1.2860 1.2830 1.2800 1.2775-80 1.2760 1.2750 1.2720 1.2700
EUR/JPY
Offers: 121.30 121.50 121.80 122.00 122.30 122.50
Bids: 120.75-80 120.50 120.30 120.00 119.80 119.50
EUR/GBP
Offers: 0.8435 0.8450 0.8465 0.8485 0.8500
Bids: 0.8400 0.8385 0.8350 0.8335 0.8300
USD/JPY
Offers: 111.50 111.65 111.80 112.00 112.20 112.50 113.00
Bids: 111.20 111.00 110.85 110.65 110.50 110.30 110.00
AUD/USD
Offers: 0.7485 0.7500 0.7520 0.7550-55 0.7585 0.7600
Bids: 0.7450 0.7430 0.7400 0.7385 0.7350
-
11:50
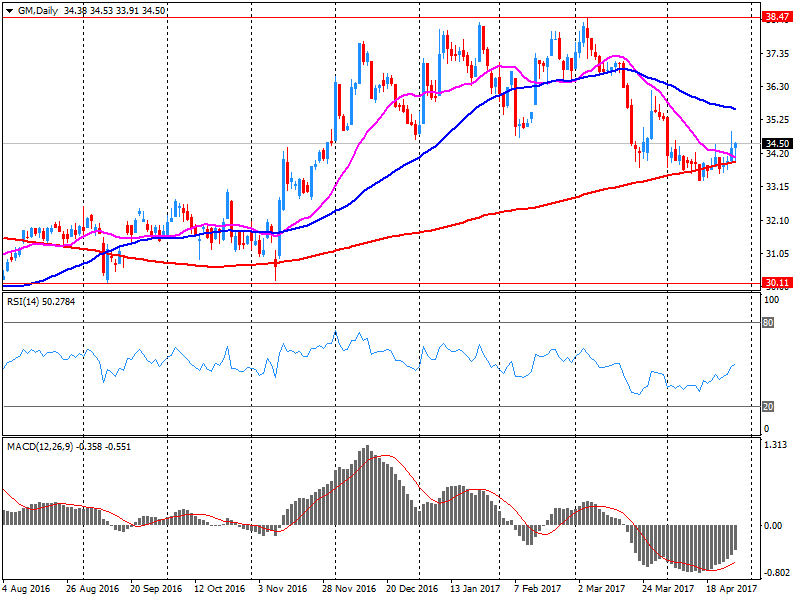
Company News: General Motors (GM) Q1 results beat analysts’ forecasts
General Motors (GM) reported Q1 FY 2017 earnings of $1.70 per share (versus $1.26 in Q1 FY 2016), beating analysts' consensus estimate of $1.47.
The company's quarterly revenues amounted to $41.200 bln (+10.6% y/y), beating analysts' consensus estimate of $37.376 bln.
GM rose to $35.10 (+1.62%) in pre-market trading.
-
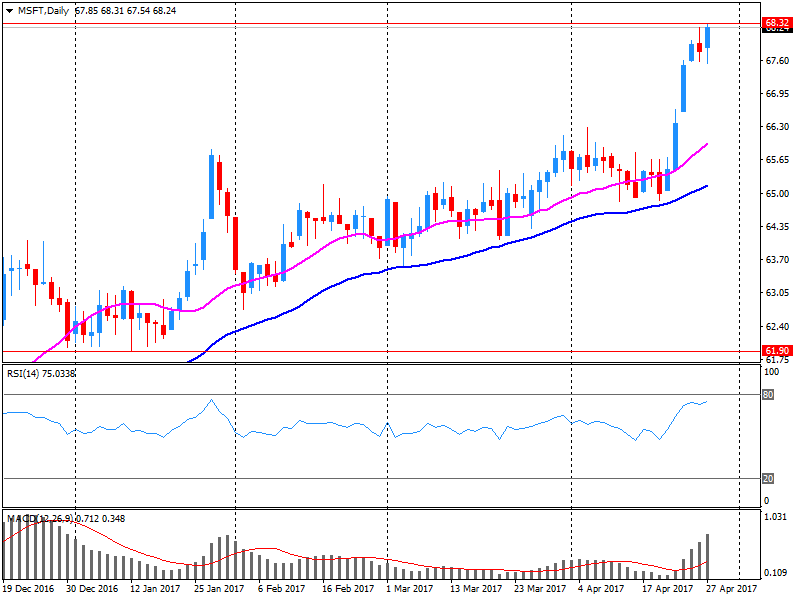
11:44
Company News: Microsoft (MSFT) Q3 EPS beat analysts’ estimate
Microsoft (MSFT) reported Q3 FY 2017 earnings of $0.73 per share (versus $0.62 in Q3 FY 2016), beating analysts' consensus estimate of $0.70.
The company's quarterly revenues amounted to $23.557 bln (+6.3% y/y), generally in-line with analysts' consensus estimate of $23.623 bln.
MSFT rose to $68.58 (+0.45%) in pre-market trading.
-
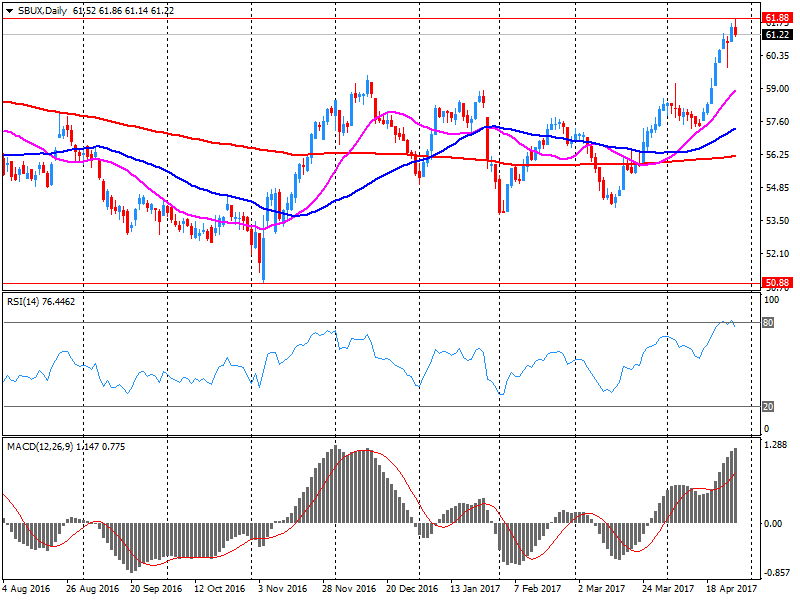
11:35
Company News: Starbucks (SBUX) posts Q1 EPS in line with analysts' estimate
Starbucks (SBUX) reported Q1 FY 2017 earnings of $0.45 per share (versus $0.39 in Q1 FY 2016), in-line with analysts' consensus estimate.
The company's quarterly revenues amounted to $5.294 bln (+7.3% y/y), missing analysts' consensus estimate of $5.418 bln.
SBUX fell to $58.45 (-4.65%) in pre-market trading.
-
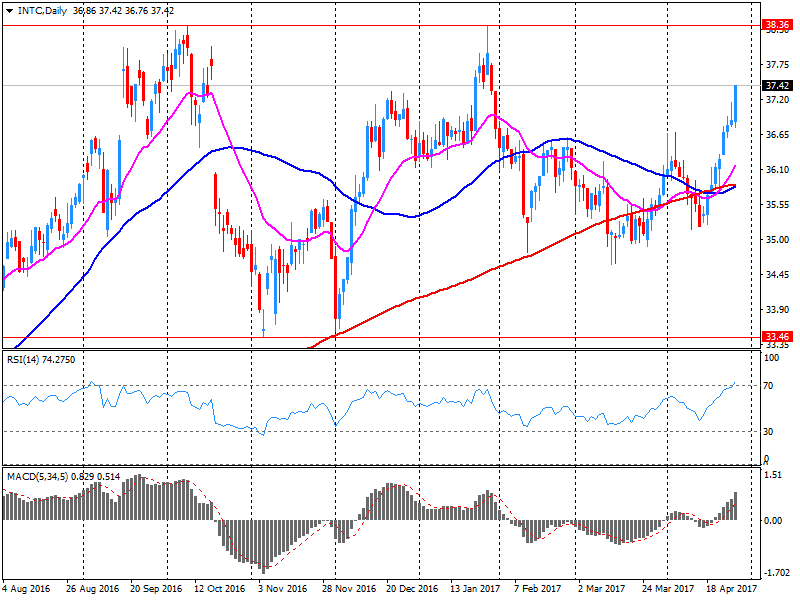
11:29
Company News: Intel (INTC) Q1 EPS beat analysts’ forecast
Intel (INTC) reported Q1 FY 2017 earnings of $0.66 per share (versus $0.54 in Q1 FY 2016), beating analysts' consensus estimate of $0.65.
The company's quarterly revenues amounted to $14.796 bln (+8% y/y), generally in-line with analysts' consensus estimate of $14.805 bln.
INTC fell to $35.92 (-4.03%) in pre-market trading.
-
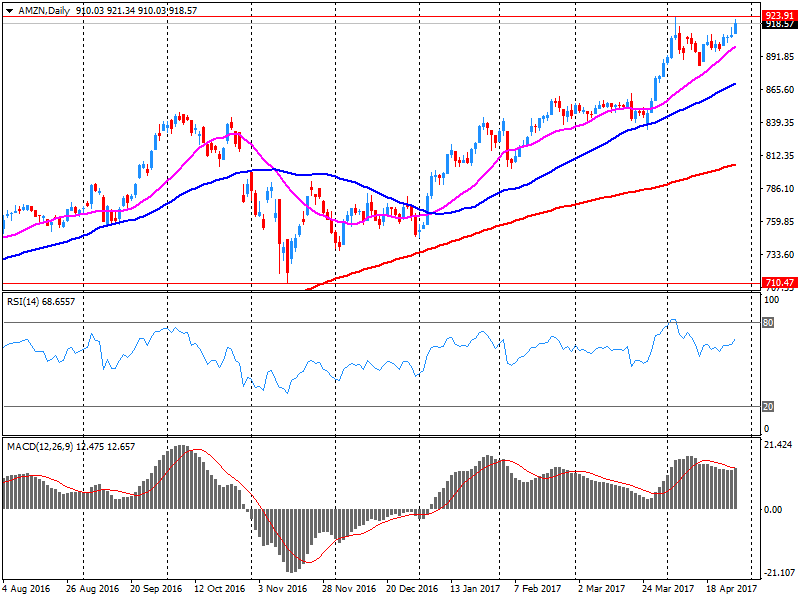
11:20
Company News: Amazon (AMZN) Q1 results beat analysts’ estimates
Amazon (AMZN) reported Q1 FY 2017 earnings of $1.48 per share (versus $1.07 in Q1 FY 2016), beating analysts' consensus estimate of $1.10.
The company's quarterly revenues amounted to $35.714 bln (+22.6% y/y), beating analysts' consensus estimate of $35.310 bln.
AMZN rose to $953.50 (+3.82%) in pre-market trading.
-
11:15
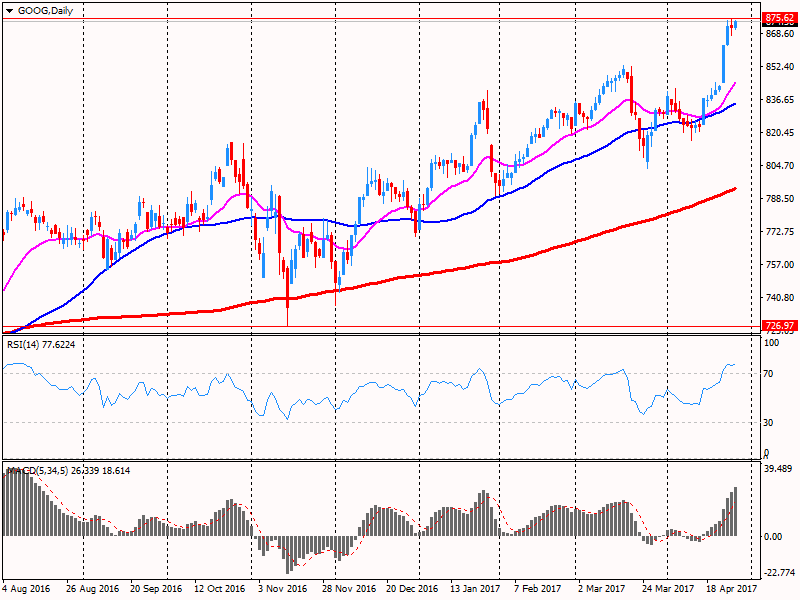
Company News: Alphabet (GOOG) Q1 results beat analysts’ expectations
Alphabet (GOOG) reported Q1 FY 2017 earnings of $7.73 per share (versus $7.50 in Q1 FY 2016), beating analysts' consensus estimate of $7.38.
The company's quarterly revenues amounted to $24.750 bln (+22.2% y/y), beating analysts' consensus estimate of $24.176 bln.
GOOG rose to $909.97 (+4.09%) in pre-market trading.
-
10:48
Russia Apr Central Bank key rate decrease to 9.25 % (fcast 9.50 %) vs prev 9.75 %. Says gradual decline in nominal interest rates and the easing of non-price bank lending conditions will remain
-
Says assessment of the overall potential of the key rate reduction before the end of 2017 is unchanged
-
Annual consumer price growth is down to 4.3% from 4.6% in february
-
According to the estimates as of 24 april, annual inflation stands at 4.2-4.3 pct
-
Economy continued to recover in the first quarter and expects fixed capital investments to increase. Industrial production is maintaining positive dynamics and unemployment is showing a downward trend
-
Inflation is estimated to remain on the path of downward movement towards the 4% target before the end of 2017
-
Inflation showed a substantial slowdown in 2017 q1, inflation expectations of both households and businesses were down
-
-
10:43
UK govt says differentiated Scottish Brexit deal could create "significant disruption" to UK internal market - Letter from Brexit minister Davis to Scottish govt
-
09:34
Important rise for Euro Area CPI in April. Eur/Usd up almost 100 pips for the day
Euro area annual inflation is expected to be 1.9% in April 2017, up from 1.5% in March 2017, according to a flash estimate from Eurostat, the statistical office of the European Union.
Looking at the main components of euro area inflation, energy is expected to have the highest annual rate in April (7.5%, compared with 7.4% in March), followed by services (1.8%, compared with 1.0% in March), food, alcohol & tobacco (1.5%, compared with 1.8% in March) and non-energy industrial goods (0.3%, stable compared with March).
-
09:00
Eurozone: Harmonized CPI, Y/Y, April 1.9% (forecast 1.8%)
-
09:00
Eurozone: Harmonized CPI ex EFAT, Y/Y, April 1.2%
-
08:40
UK index of services increased by 0.5% in the 3 months to February - ONS
In the 3 months to February 2017, services output increased by 0.5% compared with the 3 months ending November 2016; the 3-month on 3-month growth rates show that services output continues to slow since October 2016.
In the 3 months to February 2017, services output increased by 2.5% compared with the same period a year ago.
Services output increased by 0.2% between January 2017 and February 2017; this follows negative growth of 0.1% between December 2016 and January 2017, unrevised from the previous estimate.
-
08:39
UK preliminary GDP rose less than expected in Q1
UK gross domestic product (GDP) was estimated to have increased by 0.3% in Quarter 1 (Jan to Mar) 2017, the slowest rate of growth since Quarter 1 2016.
Slower growth in Quarter 1 2017 was mainly due to services, which grew by 0.3% compared with growth of 0.8% in Quarter 4 (Oct to Dec) 2016.
In Quarter 1 2017 there were falls in several important consumer-focused industries, such as retail sales and accommodation; this was due in part to prices increasing more than spending.
Production, construction and agriculture grew by 0.3%, 0.2% and 0.3% respectively in Quarter 1 2017.
GDP per head was estimated to have increased by 0.1% during Quarter 1 2017.
-
08:31
United Kingdom: BBA Mortgage Approvals, March 41.1 (forecast 42)
-
08:30
United Kingdom: GDP, q/q, Quarter I 0.3% (forecast 0.4%)
-
08:30
United Kingdom: GDP, y/y, Quarter I 2.1% (forecast 2.2%)
-
08:16
Forex option contracts rolling off today at 14.00 GMT:
USDJPY 109.00 / 05/10 , 109.25, 109.35, 110.00 (1.02bn), 110,15, 110,35, 110,50 (522m), 110,75, 111.00 (881m), 111.50, 111.60, 112,00, 112,50
EURUSD 1,0600 (2.83bn), 1,0700 / 05, 1,0720, 1,0750 / 54, 1,0800 / 15 (605m), 1,0850 (963m), 1,0875 / 85 (643m), 1,0900 (1.91bn), 1,0915 / 25 (824m), 1,0950 (2.44bn), 1,1000 (1.02bn), 1,1035
GBPUSD, 1,2650 , 1,2700, 1,2800, 1.2850, 1.2875, 1,2900 , 1,2920 / 25, 1,3000 (971m)
AUDUSD 0,7500, 0,7550, 0,7560, 0,7600, 0,7615, 0,7640, 0,7650
EURJPY 116,00, 116,30, 116,75, 119,50, 121,86 / 122,00, 123,30
USDCHF 0,9890, 1,0095
EURGBP 0,8300, 0,8350, 0,8400
EURCHF 1,0810, 1,0850 (295m), 1,0875
-
08:09
ECB survey: core inflation seen at 1.1 pct this year, 1.3 pct in 2018, unchanged from previous forecast
-
2021 inflation expectation holding steady at 1 spf
-
2017 gdp growth seen at 1.7 pct vs 1.5 seen 3 months ago
-
2019 euro zone inflation at 1.7 pct vs 1.6 pct seen 3 months ago
-
2017 inflation seen at 1.6 pct vs 1.4 pct three months ago
-
-
08:08
The annual growth rate of the Euro Area monetary aggregate M3 increased to 5.3% in March
The annual growth rate of the broad monetary aggregate M3 increased to 5.3% in March 2017, from 4.7% in February.
The annual growth rate of the narrower aggregate M1, which includes currency in circulation and overnight deposits, increased to 9.1% in March, from 8.4% in February.
The annual growth rate of adjusted loans to households stood at 2.4% in March, compared with 2.3% in February.
The annual growth rate of adjusted loans to non-financial corporations increased to 2.3% in March, from 1.9% in February.
-
08:01
Eurozone: M3 money supply, adjusted y/y, March 5.3% (forecast 4.7%)
-
08:01
Eurozone: Private Loans, Y/Y, March 2.4% (forecast 2.4%)
-
07:25
China's foreign ministry says won't comment on what China would do if North Korea carries out another nuclear test
-
07:24
Spanish GDP tops expectations in Q1
The Gross Domestic Product (GDP) generated by the Spanish economy shows a variation of 0.8% in the first quarter of 2017 compared to the previous quarter , according to estimation of quarterly GDP. This rate is one tenth higher than that recorded in the previous quarter. The annual variation of GDP in the first quarter of 2017 is 3.0%, a rate similar to that registered in the fourth quarter of the previous year.
-
07:22
French CPI inflation little changed in April
Over a year, the Consumer Price Index (CPI) should barely accelerate in April 2017 (+1.2% after +1.1% in March) according to the provisional estimate made at the end of the month. This slight increase in year-on-year inflation should come from a smaller drop in manufactured product prices, partly offset by a slight deceleration in the prices of energy, food and services.
Over one month, consumer prices are set to come to a standstill (+0.1% after +0.6% in March). This sharp slowdown should be due to that of manufactured product prices, which is seasonal. The prices of petroleum products and food should continue to fall, but at a lesser rate than in the previous month. Services prices should accelerate a little, owing to transport services.
-
07:01
Switzerland: KOF Leading Indicator, April 106.0 (forecast 107.8)
-
06:47
France: CPI, y/y, April 1.2%
-
06:46
UK house prices show second consecutive monthly decline in April
Annual house price growth dips to 2.6% - its weakest pace for almost four years.
Commenting on the figures, Robert Gardner, Nationwide's Chief Economist, said: "House prices recorded their second consecutive monthly fall in April, while the annual rate of growth slowed to 2.6%, the weakest since June 2013. "In some respects, the softening in house price growth is surprising because the unemployment rate is near to a 40- year low, confidence is still relatively high and mortgage rates have fallen to new all-time lows in recent months".
-
06:43
German import prices down 0.5% in March
As reported by the Federal Statistical Office (Destatis), the index of import prices increased by 6.1% in March 2017 compared with the corresponding month of the preceding year. In February 2017 and in January 2017 the annual rates of change were +7.4% and +6.0%, respectively. From February 2017 to March 2017 the index fell by 0.5%.
The index of import prices, excluding crude oil and mineral oil products, increased by 4.2% compared with the level of a year earlier.
The index of export prices increased by 2.3% in March 2017 compared with the corresponding month of the preceding year. In February 2017 and in January 2017 the annual rates of change were +2.5% and +1.8%, respectively. From February 2017 to March 2017 the export price index did not change.
-
06:43
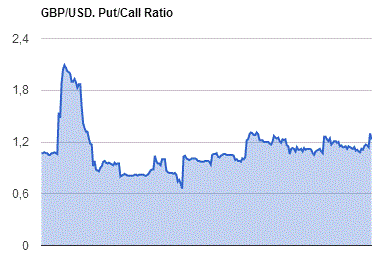
Options levels on friday, April 28, 2017
EUR/USD
Resistance levels (open interest**, contracts)
$1.0984 (4258)
$1.0957 (4168)
$1.0928 (951)
Price at time of writing this review: $1.0873
Support levels (open interest**, contracts):
$1.0831 (854)
$1.0785 (1257)
$1.0756 (1266)
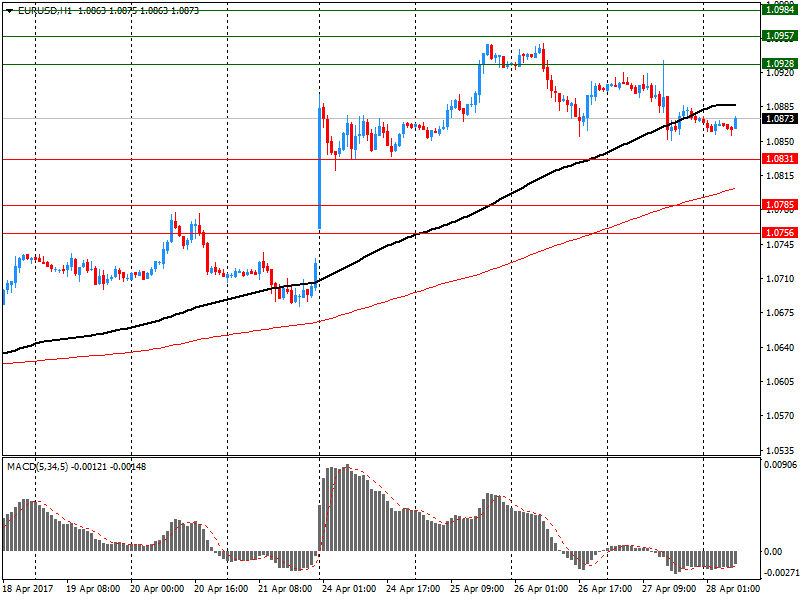
Comments:
- Overall open interest on the CALL options with the expiration date June, 9 is 70098 contracts, with the maximum number of contracts with strike price $1,1100 (6153);
- Overall open interest on the PUT options with the expiration date June, 9 is 72832 contracts, with the maximum number of contracts with strike price $1,0400 (5204);
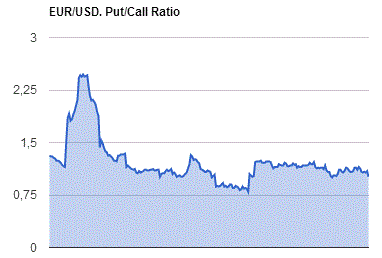
- The ratio of PUT/CALL was 1.04 versus 1.02 from the previous trading day according to data from April, 27
GBP/USD
Resistance levels (open interest**, contracts)
$1.3205 (1543)
$1.3108 (1935)
$1.3011 (2514)
Price at time of writing this review: $1.2900
Support levels (open interest**, contracts):
$1.2791 (864)
$1.2594 (668)
$1.2696 (1420)
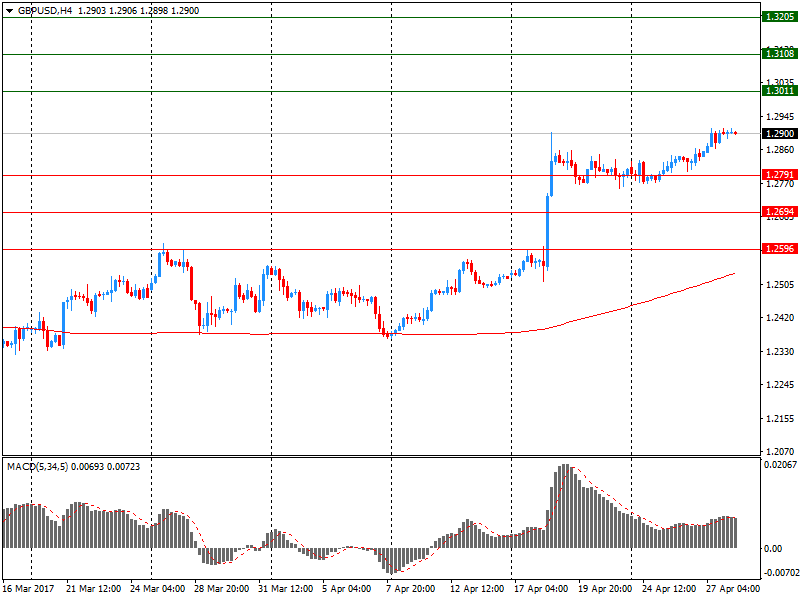
Comments:
- Overall open interest on the CALL options with the expiration date June, 9 is 24329 contracts, with the maximum number of contracts with strike price $1,3000 (2514);
- Overall open interest on the PUT options with the expiration date June, 9 is 28023 contracts, with the maximum number of contracts with strike price $1,2500 (5000);
- The ratio of PUT/CALL was 1.15 versus 1.17 from the previous trading day according to data from April, 27
* - The Chicago Mercantile Exchange bulletin (CME) is used for the calculation.
** - Open interest takes into account the total number of option contracts that are open at the moment.
-
06:42
Turnover of the retail enterprises in Germany was 2.3% higher in March 2017 than in the same month of a year earlier
According to provisional results of the Federal Statistical Office (Destatis), the price-adjusted (real) turnover of the retail enterprises in Germany was 2.3% higher in March 2017 than in the same month of a year earlier, while in nominal terms (that is, not price-adjusted) it was 4.2% higher. In March 2017, stores were open on 27 days, that is, two days more than in March 2016.
This year, Easter fell in April, while last year it was in March.
As of March 2017, a larger online retail enterprise, which established a branch in Germany in May 2015, has been included in the statistics of retail trade. This has a major impact both on online retail data and on total retail data. To reflect more adequately the economic development of German retail enterprises, the results as of May 2015 have been recalculated. This allows full comparability between the results for March 2017 to May 2016 with the relevant months of the previous year.
However, it also leads to considerable revisions of results published earlier. Due to the revision, the year-on-year change rate of real turnover of total retail trade in 2016 rose to 2.6% (previously: 1.8%) and that of nominal turnover to 2.9% (previously: 2.3%). The year-on-year change rate of real turnover of 2015 increased to 3.8% (previously: 2.5%). The year-on-year change rate of nominal turnover, too, was up to 3.8% (previously: 2.6%).
-
06:16
Germany: Retail sales, real adjusted , March 0.1% (forecast -0.3%)
-
06:02
Germany: Retail sales, real unadjusted, y/y, March 2.3% (forecast 2%)
-
05:46
France: GDP, Y/Y, Quarter I 0.8%
-
05:40
Global Stocks
U.K. stocks finished with losses Thursday, with a rallying pound helping to push the blue-chips market lower for the first time in four sessions, but Lloyds Banking Group PLC gained following the lender's well-received earnings report.
The Nasdaq Composite closed at a record Thursday, during an busy day of corporate quarterly results, but the broader market ended in neutral territory as a slump in energy and questions about President Donald Trump's tax plan weighed on Wall Street.
Major stock indexes in Asia fell slightly on Friday, mirroring Wall Street's cautious sentiment on risk taking, though strong earnings results from tech companies saw shares in the sector rise. The market-friendly result of the first round of elections in France helped the region start the week strongly, but stocks have given back some of their gains as investors refocused on local drivers.
-
05:30
France: GDP, q/q, Quarter I 0.3% (forecast 0.4%)
-
05:02
Japan: Housing Starts, y/y, March 0.2% (forecast -2.4%)
-
05:01
Japan: Construction Orders, y/y, March 4%
-
05:01
Japan: Construction Orders, y/y, March 4%
-
01:31
Australia: Private Sector Credit, y/y, March 5.0%
-
01:30
Australia: Producer price index, q / q, Quarter I 0.5% (forecast 0.3%)
-
01:30
Australia: Private Sector Credit, m/m, March 0.3%
-
01:30
Australia: Producer price index, y/y, Quarter I 1.3%
-
01:00
New Zealand: ANZ Business Confidence, April 11.0
-