Noticias del mercado
-
19:01
U.S.: Baker Hughes Oil Rig Count, July 764
-
15:49
Option expiries for today's 10:00 ET NY cut
EURUSD:1.1490-00 (EUR 1.1bln) 1.1550-55 (660m) 1.1600 (400m)
USDJPY: 111.40-50 (USD 980m) 111.75-80 (825m) 112.00 (510m) 112.25-35 (660m)
GBPUSD: 1.3000 (GBP 545m) 1.3150 (320m)
-
14:36
Canadian retail sales increased for the third consecutive month, rising 0.6% to $48.9 billion in May
Sales were up in 5 of 11 subsectors, representing 56% of total retail trade.
Higher sales at motor vehicle and parts dealers were the main contributor to the gain. Excluding sales in this subsector, retail sales were down 0.1% in May.
After removing the effects of price changes, retail sales in volume terms rose 1.1%.
Following a decrease in April, sales at motor vehicle and parts dealers increased 2.4% in May. Higher sales at new car dealers (+2.7%) accounted for most of the gain at the subsector level. Used car dealers (+4.7%) and automotive parts, accessories and tire stores (+2.7%) also posted higher sales. Sales at other motor vehicle dealers (-4.2%) were down for the fourth time in five months.
Higher receipts were reported at food and beverage stores (+0.9%). The main contributors to the gain were supermarkets and other grocery stores (+0.9%) and beer, wine and liquor stores (+2.4%). Following a 3.5% increase in April, lower sales were reported at specialty food stores (-2.2%).
Sales at electronics and appliance stores (+1.2%) continued their upward trend in May, rising for a fifth consecutive month.
-
14:35
Canadian CPI down 0.1% in June, as expected
The Consumer Price Index (CPI) rose 1.0% on a year-over-year basis in June, following a 1.3% gain in May.
Energy prices decreased in the 12 months to June, after increasing in May. At the same time, prices for food rose year over year in June, following a small decline in May.
Excluding food and energy, the CPI was up 1.4% on a year-over-year basis in June, matching the gain in May.
Prices were up in seven of the eight major components in the 12 months to June, with the shelter index and the recreation, education and reading index contributing the most to the year-over-year rise in the CPI. The clothing and footwear index declined on a year-over-year basis.
Transportation costs rose 0.6% on a year-over-year basis in June, following a 2.2% gain in May. This deceleration was led by gasoline prices, which fell 1.4% in the 12 months to June, after increasing 6.8% in May. The purchase of passenger vehicles index declined for the first time since February 2015, down 0.2% year over year in June. Meanwhile, passenger vehicle insurance premiums rose 2.1% in the 12 months to June, following a 1.4% increase in May.
-
14:30
Canada: Retail Sales YoY, May 7.3%
-
14:30
Canada: Consumer Price Index m / m, June -0.1% (forecast -0.1%)
-
14:30
Canada: Bank of Canada Consumer Price Index Core, y/y, June 0.9%
-
14:30
Canada: Retail Sales ex Autos, m/m, May -0.1% (forecast 0.0%)
-
14:30
Canada: Consumer price index, y/y, June 1% (forecast 1.0%)
-
14:30
Canada: Retail Sales, m/m, May 0.6% (forecast 0.2%)
-
14:24
U.S. medium, longer-dated treasury yields bounce up from 3-week lows in early U.S. trading; 10-year yield at 2.246 pct
-
12:30
ECB policymakers see December as too late for decision even if staff flagged it as option - Sources
-
12:13
ECB Policy Makers: See Oct Meeting As Likely Date For Decision On Asset Purchase Programme - Reuters
-
11:35
German economy ministry spokeswoman says german govt is reviewing all applications for arms projects from Turkey
-
10:48
ECB survey: core inflation forecast raised to 1.1 pct from 1.0 pct for 2017; unchanged further out - SPF
-
Inflation forecasts cut by 0.1 pct point for 2017-2019; long-term projection unchanged
-
Gdp growth seen at 1.9 pct vs 1.7 seen 3 months ago, 2018-2019 gdp also revised up
-
Risks for inflation tilted to the downside in longer term, balanced for gdp growth
-
Unemployment projections cuts by 0.2-0.3 pct point for all years
-
-
10:45
UK public sector net borrowing increased by £1.9 billion to £22.8 billion in the current financial year-to-date
Public sector net borrowing (excluding public sector banks) increased by £1.9 billion to £22.8 billion in the current financial year-to-date (April 2017 to June 2017), compared with the same period in 2016.
The Office for Budget Responsibility (OBR) forecast that public sector net borrowing (excluding public sector banks) will be £58.3 billion during the financial year ending March 2018.
Public sector net borrowing (excluding public sector banks) increased by £2.0 billion to £6.9 billion in June 2017, compared with June 2016.
Public sector net borrowing (excluding public sector banks) decreased by £25.9 billion to £46.2 billion in the financial year ending March 2017 (April 2016 to March 2017) compared with the financial year ending March 2016; this is the lowest net borrowing since the financial year ending March 2008.
The Office for Budget Responsibility (OBR) forecast that public sector net borrowing (excluding public sector banks) would be £51.7 billion during the financial year ending March 2017.
Public sector net debt (excluding public sector banks) was £1,753.5 billion at the end of June 2017, equivalent to 87.4% of gross domestic product (GDP), an increase of £128.5 billion (or 3.6 percentage points as a ratio of GDP) on June 2016.
-
10:30
United Kingdom: PSNB, bln, June -6.28 (forecast -4.3)
-
09:56
N.Korea tour operator says informed by US authorities that US citizens won't be allowed to travel to N.Korea 30 days after july 27 - Twitter message
-
09:25
Reserve Bank of Australia deputy gov Debelle says no automatic reason to follow rate hikes abroad
-
08:37
Options levels on friday, July 21, 2017
EUR/USD
Resistance levels (open interest**, contracts)
$1.1723 (1617)
$1.1702 (3678)
$1.1678 (5169)
Price at time of writing this review: $1.1648
Support levels (open interest**, contracts):
$1.1586 (164)
$1.1557 (729)
$1.1522 (649)
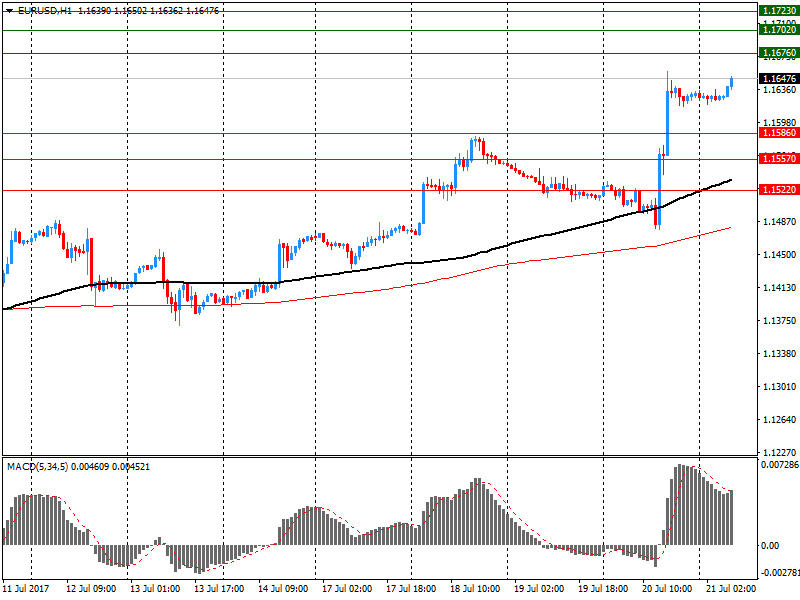
Comments:
- Overall open interest on the CALL options and PUT options with the expiration date August, 4 is 70958 contracts (according to data from July, 20) with the maximum number of contracts with strike price $1,1500 (5169);
GBP/USD
Resistance levels (open interest**, contracts)
$1.3106 (2297)
$1.3056 (2158)
$1.3017 (1094)
Price at time of writing this review: $1.2988
Support levels (open interest**, contracts):
$1.2960 (475)
$1.2943 (346)
$1.2921 (405)
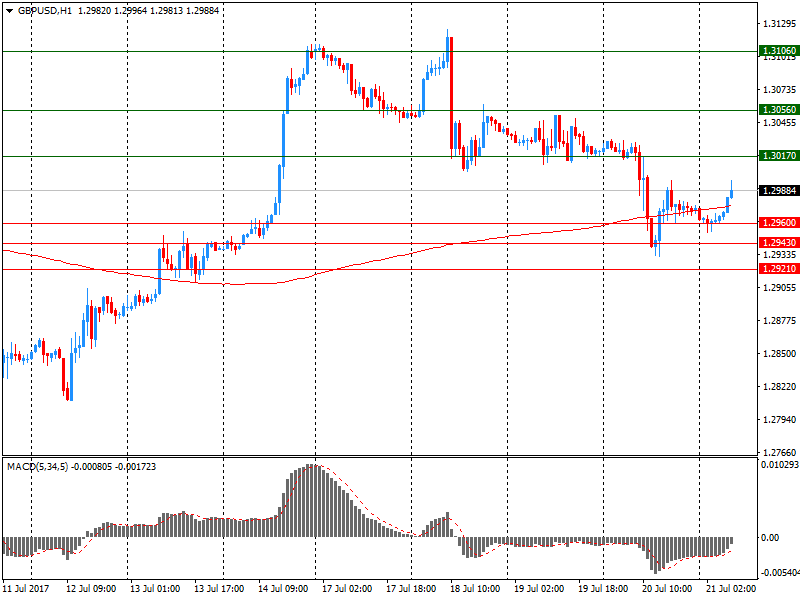
Comments:
- Overall open interest on the CALL options with the expiration date August, 4 is 27215 contracts, with the maximum number of contracts with strike price $1,3100 (3054);
- Overall open interest on the PUT options with the expiration date August, 4 is 26104 contracts, with the maximum number of contracts with strike price $1,2800 (3095);
- The ratio of PUT/CALL was 0.96 versus 0.95 from the previous trading day according to data from July, 20
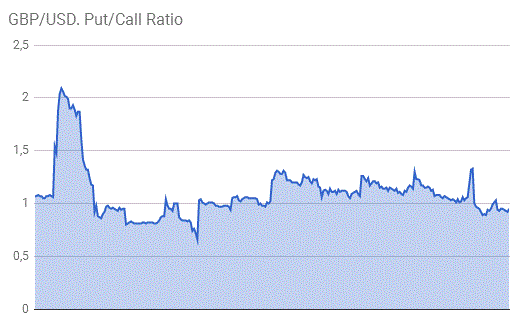
* - The Chicago Mercantile Exchange bulletin (CME) is used for the calculation.
** - Open interest takes into account the total number of option contracts that are open at the moment.
-
08:10
U.S. Fed's mortgage-backed securities sales were $0.25 billion from jul. 13-jul. 19 - NY Fed
-
08:09
U.S. House speaker Ryan says big six principals on tax reform have basically found where consensus lies on main issues of tax reform
-
08:08
RBA's Debelle says recent data has given us a little more confidence in the economy
-
Inflation targetting still useful
-
Aware rising power prices not good for household budget
-
Paying fair amount of attenton to underemployment
-
The rising AUD is complicating the economy's adjustment
-
Discussion of neutral rates had no implications for policy
-
-
08:05
10-year U.S. treasury yield at 2.262 percent vs U.S. close of 2.266 percent on Thursday
-
08:04
New Zealand visitor arrivals were up 33,900 to 230,100
In June 2017 compared with June 2016 visitor arrivals were up 33,900 to 230,100.
The biggest changes were in arrivals from:
-
United Kingdom (up 15,300)
-
Australia (up 8,400)
-
Indonesia (up 2,800)
-
United States (up 2,500)
-
Ireland (up 1,400).
Overseas trips by New Zealand residents were up 22,400 to 261,800.
The biggest changes were in departures to:
-
Australia (up 2,000)
-
China (up 1,600)
-
United States (up 1,600)
-
Fiji (up 1,500)
-
Philippines (up 1,100).
Permanent and long-term arrivals were up 1,000 to 9,200.
Permanent and long-term departures were up 600 to 5,100.
-
-
08:01
Billions of dollars in investments & thousands of new jobs in America! An initiative via Corning, Merck & Pfizer @realDonaldTrump
-
00:45
New Zealand: Visitor Arrivals, June 17.3%
-
00:27
Currencies. Daily history for Jul 20’2017:
(pare/closed(GMT +2)/change, %)
EUR/USD $1,1631 +0,99%
GBP/USD $1,2972 -0,38%
USD/CHF Chf0,95095 -0,43%
USD/JPY Y111,84 -0,02%
EUR/JPY Y130,10 +0,96%
GBP/JPY Y145,086 -0,41%
AUD/USD $0,7955 +0,05%
NZD/USD $0,7400 +0,60%
USD/CAD C$1,25873 -0,11%
-