Noticias del mercado
-
15:50
Option expiries for today's 10:00 ET NY cut
EURUSD: 1.1165-75 (EUR 672m) 1.1190-00 (485m)
USDJPY: 110.00 (USD 1.4bln)
GBPUSD: 1.3200 (GBP 558m)
-
14:33
US trade balance and wholesale inventories mixed in April. USD little changed
The international trade deficit was $67.6 billion in April, up $2.5 billion from $65.1 billion in March. Exports of goods for April were $125.9 billion, $1.1 billion less than March exports. Imports of goods for April were $193.4 billion, $1.4 billion more than March imports.
Wholesale inventories for April, adjusted for seasonal variations but not for price changes, were estimated at an end-of-month level of $592.0 billion, down 0.3 percent (±0.4 percent)* from March 2017, and were up 1.8 percent (±1.1 percent) from April 2016. The February 2017 to March 2017 percentage change was revised from up 0.2 percent (±0.4 percent)* to up 0.1 percent
-
14:31
US unemployment claims continue to decline
In the week ending May 20, the advance figure for seasonally adjusted initial claims was 234,000, an increase of 1,000 from the previous week's revised level. The previous week's level was revised up by 1,000 from 232,000 to 233,000.
The 4-week moving average was 235,250, a decrease of 5,750 from the previous week's revised average. This is the lowest level for this average since April 14, 1973 when it was 232,750. The previous week's average was revised up by 250 from 240,750 to 241,000.
-
14:30
U.S.: Continuing Jobless Claims, 1923 (forecast 1925)
-
14:30
U.S.: Goods Trade Balance, $ bln., April -67.55 (forecast -64.6)
-
14:30
U.S.: Initial Jobless Claims, 234 (forecast 238)
-
14:27
UK interior minister "confident" leaks about Manchester attack to the U.S. media will now end - BBC reporter on Twitter
-
13:59
Orders
EUR/USD
Offers: 1.1260 1.1275-80 1.1300 1.1320 1.1350 1.1400
Bids: 1.1220 1.1200 1.1180 1.1165 1.1140-50 1.1120 1.1100
GBP/USD
Offers: 1.3000 1.3020 1.3030 1.3050 1.3080 1.3100
Bids: 1.2970 1.2950 1.2930 1.2920 1.29001.2875-80 1.2850
EUR/JPY
Offers: 125.80 126.00 126.50 126.80 127.00
Bids: 125.20 125.00 124.50 124.30 124.00
EUR/GBP
Offers: 0.8665 0.8680 0.8700 0.8720 0.8750
Bids: 0.8650 0.8630 0.8600 0.8585 0.8570 0.8550
USD/JPY
Offers: 112.00 112.30 112.50 112.80 113.00
Bids: 111.60 111.50 111.30 111.00 110.80-85 110.50
AUD/USD
Offers: 0.7500 0.7530 0.7550 0.7570 0.7600
Bids: 0.7465 0.7450 0.7430 0.7400 0.7385 0.7350
-
13:15
Romania Fin Min sells planned 500 mln lei worth of June 2021 treasury bonds at 2.31 pct average yield - National Bank
-
11:31
Iraq OilMin: Oil Market Will Be Stabilised By 9-Month Extension @LiveSquawk
-
10:39
UK business investment was estimated to have increased by 0.6%, to £43.8 billion in Q1
Gross fixed capital formation (GFCF), in volume terms, was estimated to have increased by 1.2% to £79.0 billion in Quarter 1 (Jan to Mar) 2017 from £78.1 billion in Quarter 4 (Oct to Dec) 2016.
Business investment was estimated to have increased by 0.6%, to £43.8 billion between Quarter 4 2016 and Quarter 1 2017.
Between Quarter 1 2016 and Quarter 1 2017, GFCF was estimated to have increased by 2.2%, from £77.3 billion and business investment was estimated to have increased by 0.8% from £43.4 billion.
The sectors contributing most to GFCF growth between Quarter 4 2016 and Quarter 1 2017 were public corporations and private sector dwellings, and business investment. Dwellings and other buildings and structures were the assets which contributed most to the increase in GFCF for the same period.
-
10:38
UK services output increased by 0.2% between February and March 2017
Services output increased by 0.2% between February and March 2017.
The largest contribution to the month-on-month growth came from transport, storage and communication, which contributed 0.23 percentage points of which motion pictures contributed 0.16 percentage points.
The Index of Services increased by 0.2% in Quarter 1 (Jan to Mar) 2017 compared with Quarter 4 (Oct to Dec) 2016; following growth of 0.8% between Quarter 3 (July to Sept) 2016 and Quarter 4 2016.
The slowdown in growth in Quarter 1 2017 mainly came from the distribution, hotels and restaurants sector with notable falls in some consumer-focused industries such as retail.
Growth between Quarter 4 2016 and Quarter 1 2017 has been revised down 0.1% from the previous estimate used in the gross domestic product preliminary estimate, published on 28 April 2017; this was primarily due to the receipt of late data for January and February.
-
10:36
UK GDP up 0.2% in Q1, below estimates
UK gross domestic product (GDP) in volume terms was estimated to have increased by 0.2% between Quarter 4 (Oct to Dec) 2016 and Quarter 1 (Jan to Mar) 2017.
UK GDP growth in Quarter 1 2017 has been revised down by 0.1 percentage points from the preliminary estimate published on 28 April 2017; mainly due to broad-based downward revisions within the services sector.
UK GDP growth slowed to 0.2% in Quarter 1 2017 as consumer facing industries such as retail and accommodation fell and household spending slowed. This was partly due to rising prices. Construction and manufacturing also showed little growth, while business services & finance continued to grow strongly.
GDP in current prices increased by 0.7% between Quarter 4 2016 and Quarter 1 2017.
GDP per head in volume terms was flat between Quarter 4 2016 and Quarter 1 2017.
-
10:31
United Kingdom: BBA Mortgage Approvals, April 40.75 (forecast 40.8)
-
10:30
United Kingdom: Business Investment, y/y, Quarter I 0.8%
-
10:30
United Kingdom: GDP, y/y, Quarter I 2% (forecast 2.1%)
-
10:30
United Kingdom: Business Investment, q/q, Quarter I 0.6% (forecast 0.2%)
-
10:30
United Kingdom: GDP, q/q, Quarter I 0.2% (forecast 0.3%)
-
10:21
Italian industrial orders down 4.2% in March
In March 2017 the seasonally adjusted turnover index increased by 0.5% compared to the previous month (+1.1% in domestic market and -0.9% in non-domestic market). The percentage change of the average of the last three months compared to the previous three months was +0.4% (+1.0% in domestic market and -0.8% in non-domestic market).
In March 2017 the seasonally adjusted industrial new orders index decreased by 4.2% compared with February 2017 (-0.8% in domestic market and -8.3% in non-domestic market). The percentage change of the average of the last three months compared to the previous three months was +1.5% (-1.7% in domestic market and +6.1% in non-domestic market).
With respect to the same month of the previous year the calendar adjusted industrial turnover index increased by +7.2% (calendar working days in March 2017 being 23 versus 22 days in March 2016).
-
10:18
UK PM may to raise concerns over intelligence leaks on manchester attack with U.S. President Trump on thursday - UK government source says
-
10:02
Forex option contracts rolling off today at 14.00 GMT:
EURUSD: 1.1165-75 (EUR 672m) 1.1190-00 (485m)
USDJPY: 110.00 (USD 1.4bln)
GBPUSD: 1.3200 (GBP 558m)
-
09:21
Russian Central Bank governor Nabiullina says will build gold, forex reserves to $500 bln only if inflation, fx market are stable - RIA
-
08:42
Positive start of trading expected on the main European stock markets: DAX + 0.4%, CAC40 + 0.5%, FTSE + 0.3%
-
08:41
Fed's Kaplan repeats Fed makes policy without fear of political pressure
-
Will be advocating raising rates when he sees an opportunity to do so
-
He is not taking explicit account of new U.S policies as he makes his forecasts
-
-
08:40
New Zealand fin min says one of biggest risks is more isolationist economic policies being pushed in some parts of the world
-
Increased operating surpluses to be spent on new capital investments
-
New spending includes NZD7 bln over 4 yrs in public services, NZD11 bln on infrastructure
-
Medium term economic outlook positive
-
-
08:37
BoJ's Sakurai: BoJ may need to consider additional steps if timing for hitting price goal is delayed from what is forecast in april outlook report
-
Don't need to take additional easing steps to achieve inflation target earlier than what is forecast in april outlook report
-
Must ensure boj communicates well with markets to alleviate any worries about future exit from stimulus programme
-
Believe it would be fine to maintain for now boj's pledge to increase its bond holdings by around 80 trln yen per year
-
It is true boj's recent bond buying pace somewhat slower compared with its 80-trln-yen pledge
-
Fiscal consolidation is an important long-term goal
-
-
08:34
Fitch: China’s Finances And Track Record Underpin A+ Record - Imbalances Pose Risk To Economic Stability
-
08:29
Options levels on thursday, May 25, 2017
EUR/USD
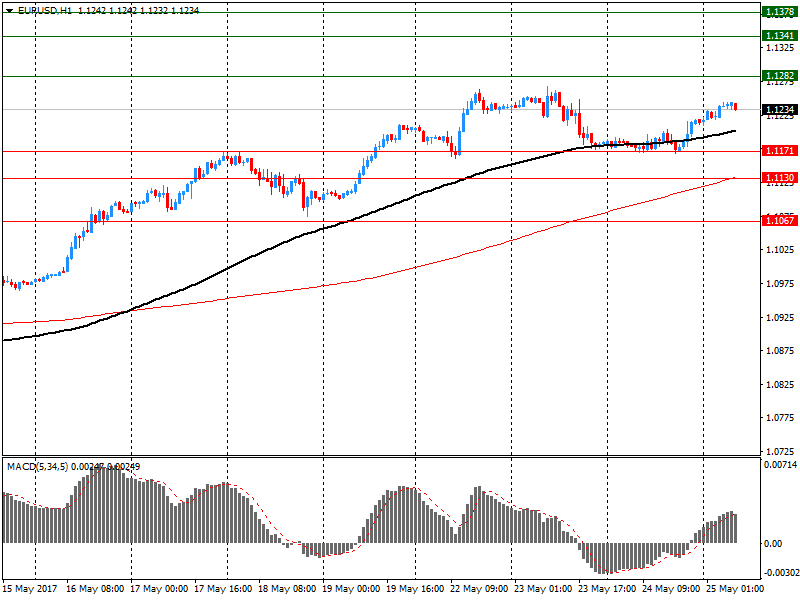
Resistance levels (open interest**, contracts)
$1.1378 (3017)
$1.1341 (5066)
$1.1282 (5628)
Price at time of writing this review: $1.1234
Support levels (open interest**, contracts):
$1.1171 (833)
$1.1130 (1157)
$1.1067 (2131)
Comments:
- Overall open interest on the CALL options with the expiration date June, 9 is 82063 contracts, with the maximum number of contracts with strike price $1,1000 (6104);
- Overall open interest on the PUT options with the expiration date June, 9 is 100131 contracts, with the maximum number of contracts with strike price $1,0700 (5492);
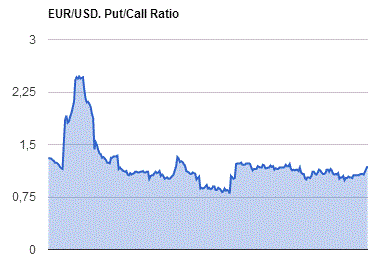
- The ratio of PUT/CALL was 1.22 versus 1.20 from the previous trading day according to data from May, 24

GBP/USD
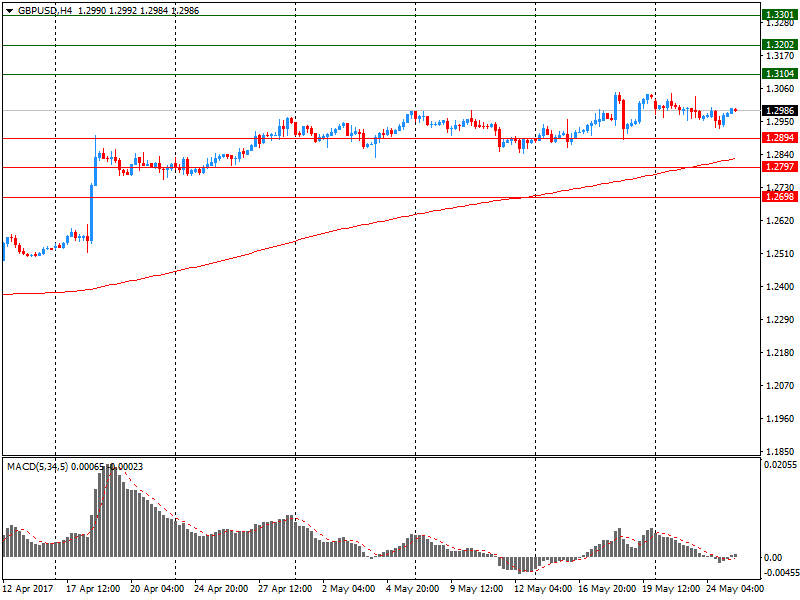
Resistance levels (open interest**, contracts)
$1.3301 (1043)
$1.3202 (2706)
$1.3104 (3157)
Price at time of writing this review: $1.2986
Support levels (open interest**, contracts):
$1.2894 (1291)
$1.2797 (2220)
$1.2698 (1756)
Comments:
- Overall open interest on the CALL options with the expiration date June, 9 is 35692 contracts, with the maximum number of contracts with strike price $1,3000 (4169);
- Overall open interest on the PUT options with the expiration date June, 9 is 36220 contracts, with the maximum number of contracts with strike price $1,1500 (3061);
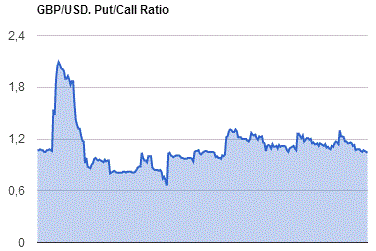
- The ratio of PUT/CALL was 1.01 versus 1.03 from the previous trading day according to data from May, 24

* - The Chicago Mercantile Exchange bulletin (CME) is used for the calculation.
** - Open interest takes into account the total number of option contracts that are open at the moment.
-
00:27
Currencies. Daily history for May 24’2017:
(pare/closed(GMT +2)/change, %)
EUR/USD $1,1214 +0,27%
GBP/USD $1,2968 +0,05%
USD/CHF Chf0,9735 -0,24%
USD/JPY Y111,56 -0,22%
EUR/JPY Y125,09 +0,04%
GBP/JPY Y144,66 -0,17%
AUD/USD $0,7498 +0,29%
NZD/USD $0,7042 +0,44%
USD/CAD C$1,3406 -0,79%
-

