Noticias del mercado
-
23:16
NZD/USD Price Analysis: Bears extend control as pair erases most recent gains
- NZD/USD posts a four-day losing streak and approaches the 20-day SMA.
- RSI trends lower in negative territory, reflecting a decline in bullish momentum.
- The pair is down by more than 1% over the week.
The NZD/USD pair continued its decline on Wednesday slightly below 0.5700, marking its fourth consecutive daily loss as sellers remained in control. The pair has now erased the majority of last week’s gains and is approaching a key technical threshold, the 20-day Simple Moving Average (SMA), which could determine the next directional move.
Technical indicators are turning increasingly bearish. The Relative Strength Index (RSI) is declining and approaching negative territory, suggesting that buyers are struggling to regain traction. Meanwhile, the Moving Average Convergence Divergence (MACD) histogram prints flat green bars, indicating a slowdown in upward momentum rather than a decisive shift towards renewed strength.
If the pair breaches the 20-day SMA, it could confirm a bearish outlook, potentially leading to further downside. However, if buyers manage to defend this support level, a corrective bounce may materialize. Market participants will be closely watching price action around this technical barrier for clues on the next move.
NZD/USD daily chart

-
22:23
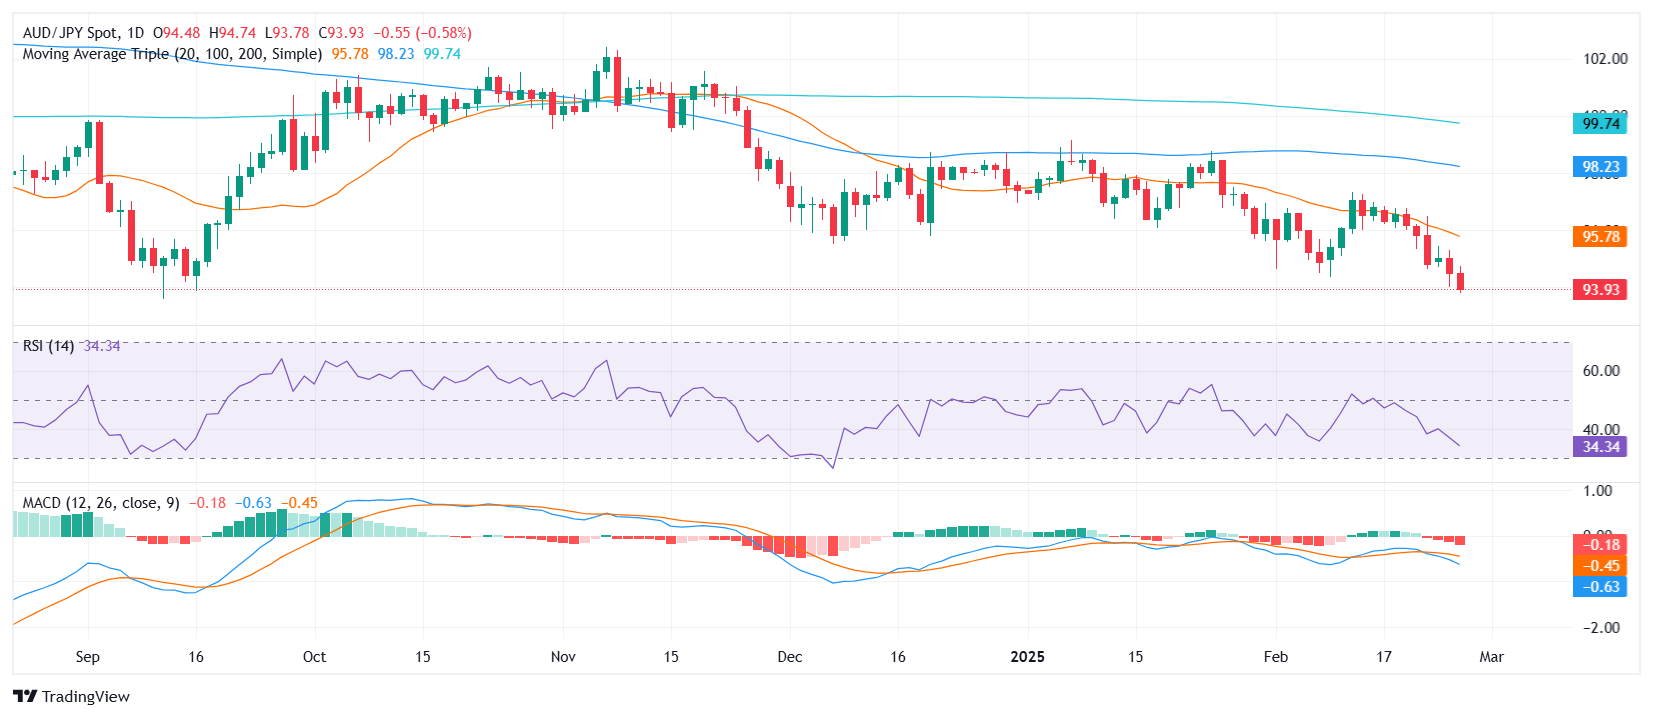
AUD/JPY Price Analysis: Bears extend control as cross nears multi-month lows
- AUD/JPY posts a second consecutive decline, hovering near its lowest levels since mid-September.
- RSI trends lower, approaching oversold territory, reinforcing bearish sentiment.
- MACD histogram prints rising red bars, signaling accelerating downward momentum.
The AUD/JPY pair extended its losses on Wednesday, marking a two-day losing streak as sellers maintained their grip on the market. The cross slipped closer to the 94.00 zone, a level not seen since mid-September, as bearish momentum continued to build.
From a technical standpoint, indicators point to further downside risks. The Relative Strength Index (RSI) is trending lower and is now nearing oversold territory, reflecting sustained selling pressure. Meanwhile, the Moving Average Convergence Divergence (MACD) histogram shows rising red bars, confirming the growing bearish bias.
With the pair trading near key support, a break below the 94.00 region could open the door for deeper losses. On the flip side, buyers would need to reclaim the 20-day SMA, currently sitting well above recent price action, to regain some control and shift the near-term outlook.
AUD/JPY daily chart
-
21:01
AUD/USD tumbles to near 0.6300 as US Dollar extends recovery, soft CPI
- Australian Dollar declines as subdued inflation dims hopes for aggressive rate cuts, pressuring the Aussie’s recent rally.
- US House of Representatives passes Trump’s tax cut bill, elevating the Greenback despite uncertain tariff developments.
- Softer growth in Australia’s Consumer Price Index intensifies speculation around potential monetary policy actions by the RBA.
- Donald Trump confirmed that tariffs on Mexico and Canada will take effect in April.
AUD/USD falls to near 0.6300 as the US Dollar (USD) extends its recovery. The United States (US) House of Representatives passed President Donald Trump’s tax cut bill, boosting the Greenback. Meanwhile, slower-than-expected inflation growth in Australia adds to the Aussie’s woes, following last week’s 25 basis points rate cut by the Reserve Bank of Australia (RBA).
Daily digest market movers: Aussie battles inflation slowdown and tariffs
- Market participants note subdued growth in the Australian Monthly Consumer Price Index at 2.5% year-on-year, softer than the 2.6% forecast, maintaining concerns about the RBA’s inflation outlook.
- The RBA recently lowered its Official Cash Rate to 4.10%, reiterating that controlling inflation is far from complete, and future actions will rely on persistent price and wage signals.
- Softer monthly CPI data fosters uncertainty over Australia’s economic resilience, while US President Donald Trump’s revived tariff threats keep investors alert to potential disruptions.
- Trump reiterated plans to impose a 25% levy on imports from Canada and Mexico but pushed them to April.
- Investor attention also turns to US Personal Consumption Expenditure Price Index data, a key inflation measure used by the Federal Reserve for guiding interest rate decisions.
AUD/USD technical outlook: RSI near midpoint, momentum falters as pair nears 20-day SMA
AUD/USD sees moderate losses on Wednesday, with the Aussie near 0.6315 after a four-day losing streak. The Relative Strength Index (RSI) hovers in a neutral region but is declining sharply, suggesting a weakening bullish momentum. Meanwhile, the Moving Average Convergence Divergence (MACD) histogram prints decreasing green bars, indicating a loss of upside traction.
Although the pair remains above the 20-day Simple Moving Average, failure to reclaim the 100-day SMA does not imply a major structural shift, and the Aussie may continue to trade within these moving average boundaries unless new data sparks a more decisive move.
Tariffs FAQs
Tariffs are customs duties levied on certain merchandise imports or a category of products. Tariffs are designed to help local producers and manufacturers be more competitive in the market by providing a price advantage over similar goods that can be imported. Tariffs are widely used as tools of protectionism, along with trade barriers and import quotas.
Although tariffs and taxes both generate government revenue to fund public goods and services, they have several distinctions. Tariffs are prepaid at the port of entry, while taxes are paid at the time of purchase. Taxes are imposed on individual taxpayers and businesses, while tariffs are paid by importers.
There are two schools of thought among economists regarding the usage of tariffs. While some argue that tariffs are necessary to protect domestic industries and address trade imbalances, others see them as a harmful tool that could potentially drive prices higher over the long term and lead to a damaging trade war by encouraging tit-for-tat tariffs.
During the run-up to the presidential election in November 2024, Donald Trump made it clear that he intends to use tariffs to support the US economy and American producers. In 2024, Mexico, China and Canada accounted for 42% of total US imports. In this period, Mexico stood out as the top exporter with $466.6 billion, according to the US Census Bureau. Hence, Trump wants to focus on these three nations when imposing tariffs. He also plans to use the revenue generated through tariffs to lower personal income taxes.
-
20:39
Forex Today: Markets’ attention remains on US economy and tariffs
The US Dollar regained some composure after bottoming out in fresh two-month lows, managing to stage a decent bounce despite persistent uncertainty surrounding US tariffs and renewed concerns over the US economy.
Here is what you need to know on Thursday, February 27:
The US Dollar Index (DXY) clocked acceptable gains soon after hitting new multi-week lows near 106.20 on Wednesday amid mixed US yields across the curve and steady speculation on the health of the US economy. The weekly Initial Jobless Claims wil be published along with Durable Goods Orders, and another estimate of Q4 GDP Growth Rate. Additionally, the Fed’s Bowman, Hammack and Harker are all due to speak.
Another failed attempt to trespass the 1.0500 barrier saw EUR/USD recede to the vicinity of 1.0470, fading part of Tuesday’s gains. The final EMU’s Consumer Confidence and Economic Sentiment are expected, seconded by the ECB’s M3 Money Supply.
GBP/USD could not sustain the early move past the 1.2700 mark, eventually clinging to modest gains near 1.2680. The annualised Car Production readings are next on tap on the UK calendar.
USD/JPY faded the initial bull run to the vicinity of 150, retracing that move and closing Wednesday’s session near 149.00. Next on the japanese docket will come the Tokyo inflation figures, along with Industrial Production, Retail Sales, Housing Starts, Construction Orders, and the weekly Foreign Bond Investment readings, all expected on February 28.
AUD/USD remained on the defensive for the fourth day in a row, putting the key 0.6300 level to the test on Wednesday. The quarterly Private Capital Expenditure will be released.
WTI prices succumbed to the stronger US Dollar and unabated fears surrounding US tariffs, extending the drop well below the $69.00 mark per barrel and adding to Tuesday’s pullback.
Prices of Gold added to the recent hiccup, although the precious has metal met solid contention around the $2,900 zone per ounce troy for the time being. Silver prices managed to reverse the initial bearish tone and ended up modestly just below the $32.00 mark per ounce.
-
20:13
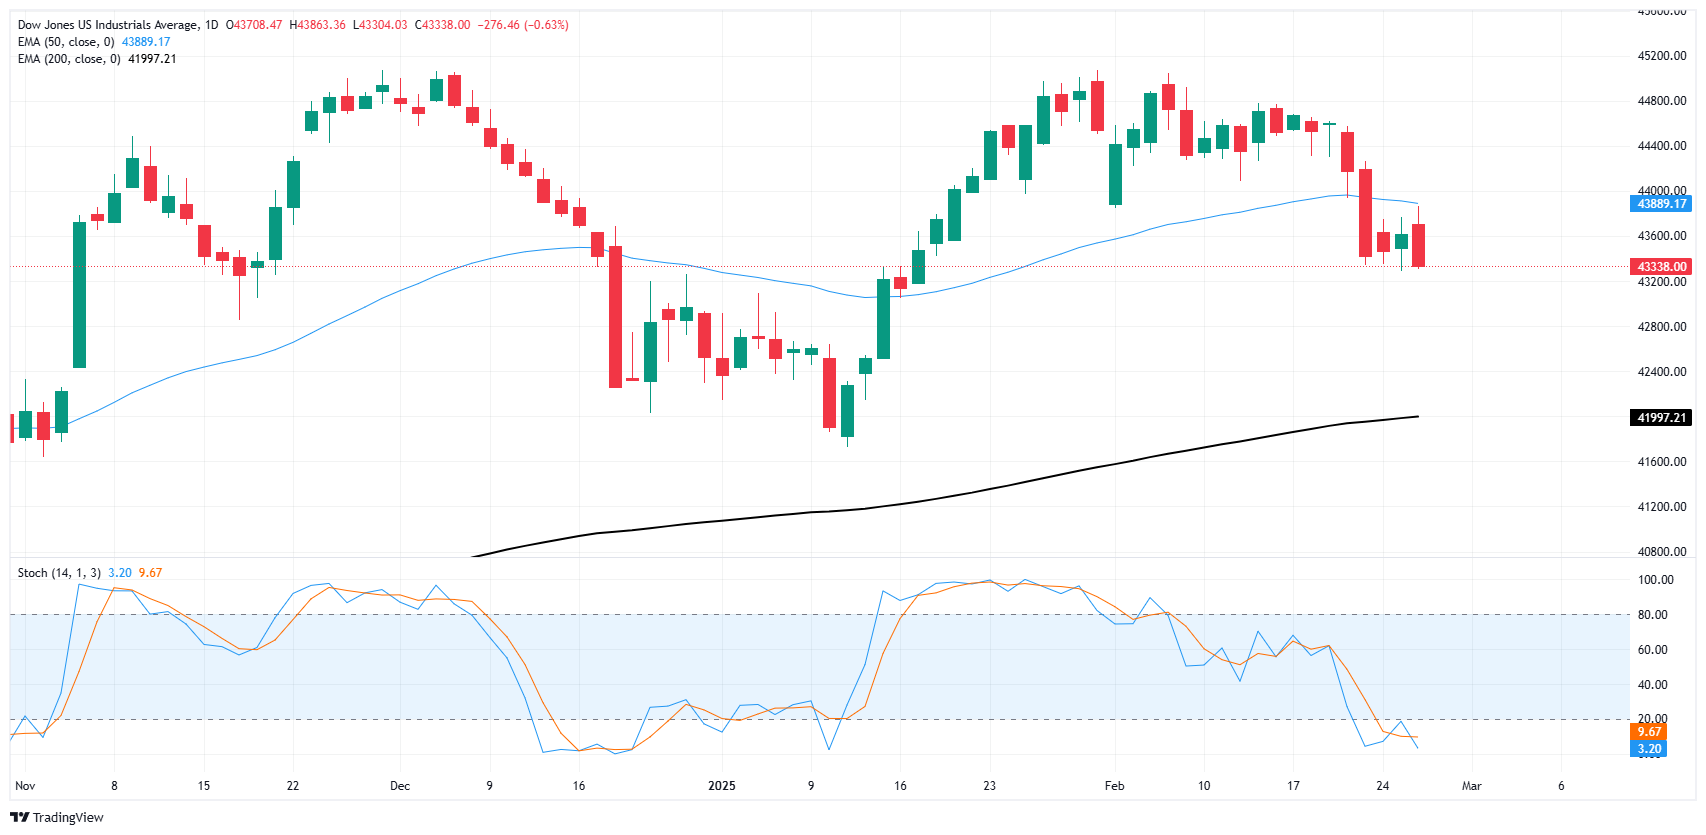
Dow Jones Industrial Average dips on choppy Wednesday
- The Dow Jones shed around 200 points on Wednesday.
- Fresh tariff threats from US President Trump, but the can has been kicked again.
- Tech sector its faces next challenge in Nvidia earnings due after the bell.
The Dow Jones Industrial Average (DJIA) missed out on slim gains found by other US equity indexes, backsliding around 200 points as investors remain uneasy in the face of renewed tariff threats from US President Donald Trump. Upcoming earnings figures from AI frontrunner Nvidia (NVDA) are also due during the overnight session after the market close on Wednesday, and pose the next bump in the road for the tech sector rally that has fizzled in recent weeks.
Read more: US President Donald Trump widens scope of tariffs, but pushes back timeline
Never one to miss an opportunity, President Trump hit markets with renewed tariff threats on Wednesday. He widened the scope of his planned import taxes to include a 25% tariff on European goods. Details remain elusive, but President Trump announced his intention to impose additional tariffs on European goods, including “cars and other things.” Donald Trump also re-reiterated his insistence that the US does not “need” Canadian Crude Oil or lumber, and that 25% tariff packages on both Canada and Mexico are still coming. However, President Trump once again kicked the can, declaring that his for-sure tariffs on Canada and Mexico will now be taking effect on April 2nd.
Dow Jones news
Nvidia has risen around 2% on Wednesday in the runup to its post-market Q4 earnings report, but bidders in the AI rally are still holding on tight for year-end results from 2024. As one of the frontrunners in the tech ecosystem that has sprouted up around delivering data solutions to AI services, Nvidia earnings could be a make-or-break bellwether of what kind of year the AI tech rally could be looking at. Market expectations of earnings on the back of AI-fueled growth have moonshot over the past year, with investors dissatisfied with anything less than triple-digit profit growth. Nvidia was last seen trading near $360 per share.
Dow Jones price forecast
The Dow Jones hit a three-day high near 43,860 early on Wednesday before the major equity index got knocked lower, chalking in a fresh technical rejection of the 50-day Exponential Moving Average (EMA) in the process. The Dow is still trading within a near-term consolidation pattern that kicked off with last Friday’s sharp downside correction, but a technical floor appears to be priced in from 43,200.
Dow Jones daily chart
Dow Jones FAQs
The Dow Jones Industrial Average, one of the oldest stock market indices in the world, is compiled of the 30 most traded stocks in the US. The index is price-weighted rather than weighted by capitalization. It is calculated by summing the prices of the constituent stocks and dividing them by a factor, currently 0.152. The index was founded by Charles Dow, who also founded the Wall Street Journal. In later years it has been criticized for not being broadly representative enough because it only tracks 30 conglomerates, unlike broader indices such as the S&P 500.
Many different factors drive the Dow Jones Industrial Average (DJIA). The aggregate performance of the component companies revealed in quarterly company earnings reports is the main one. US and global macroeconomic data also contributes as it impacts on investor sentiment. The level of interest rates, set by the Federal Reserve (Fed), also influences the DJIA as it affects the cost of credit, on which many corporations are heavily reliant. Therefore, inflation can be a major driver as well as other metrics which impact the Fed decisions.
Dow Theory is a method for identifying the primary trend of the stock market developed by Charles Dow. A key step is to compare the direction of the Dow Jones Industrial Average (DJIA) and the Dow Jones Transportation Average (DJTA) and only follow trends where both are moving in the same direction. Volume is a confirmatory criteria. The theory uses elements of peak and trough analysis. Dow’s theory posits three trend phases: accumulation, when smart money starts buying or selling; public participation, when the wider public joins in; and distribution, when the smart money exits.
There are a number of ways to trade the DJIA. One is to use ETFs which allow investors to trade the DJIA as a single security, rather than having to buy shares in all 30 constituent companies. A leading example is the SPDR Dow Jones Industrial Average ETF (DIA). DJIA futures contracts enable traders to speculate on the future value of the index and Options provide the right, but not the obligation, to buy or sell the index at a predetermined price in the future. Mutual funds enable investors to buy a share of a diversified portfolio of DJIA stocks thus providing exposure to the overall index.
-
19:30
US Dollar attempts a rebound but remains weak near yearly lows
- US Dollar Index stabilizes around 106.40, hovering near its lowest levels of 2025.
- Traders anticipate rate cuts, with Fed bets now pricing in two reductions for 2025.
- US President Trump confirms 25% tariffs on Canada, Mexico, and the EU but delays implementation until April.
- Markets await the Personal Consumption Expenditures (PCE) data, the Fed's preferred inflation gauge, on Friday.
The US Dollar Index (DXY), which tracks the performance of the US Dollar against a basket of six major currencies, is attempting a modest recovery on Wednesday but remains near yearly lows at 106.50. Traders continue to weigh increased Federal Reserve (Fed) rate cut expectations and the latest tariff developments from US President Donald Trump.
Daily digest market movers: US Dollar steadies as tariff tensions rise
- The US Dollar stabilizes around 106.40 as traders digest escalating tariff risks and growing Fed rate cut expectations.
- On the tariff front, President Trump confirms 25% tariffs on Canada, Mexico, and the EU but delays their implementation until April.
- On the Fed front, markets now expect two rate cuts in 2025, marking a shift from previous Fed guidance.
- Traders await Friday's Personal Consumption Expenditures (PCE) data, the Fed's preferred inflation gauge.
- Personal income and spending reports due this week could further shape market expectations.
- US Q4 GDP figures will provide insights into the economy’s momentum heading into 2025.
DXY technical outlook: Bulls struggle to gain control
The US Dollar Index is attempting to recover above 106.50, but momentum remains fragile. The 100-day Simple Moving Average (SMA) at 106.60 is proving a key resistance level, with technical indicators still favoring bearish conditions.
The Relative Strength Index (RSI) and Moving Average Convergence Divergence (MACD) both signal persistent downside pressure. If the DXY fails to reclaim 106.60, further declines toward 106.00 could materialize. Bulls need stronger catalysts to regain control, with the 107.00 level serving as the next key upside barrier.
Tariffs FAQs
Tariffs are customs duties levied on certain merchandise imports or a category of products. Tariffs are designed to help local producers and manufacturers be more competitive in the market by providing a price advantage over similar goods that can be imported. Tariffs are widely used as tools of protectionism, along with trade barriers and import quotas.
Although tariffs and taxes both generate government revenue to fund public goods and services, they have several distinctions. Tariffs are prepaid at the port of entry, while taxes are paid at the time of purchase. Taxes are imposed on individual taxpayers and businesses, while tariffs are paid by importers.
There are two schools of thought among economists regarding the usage of tariffs. While some argue that tariffs are necessary to protect domestic industries and address trade imbalances, others see them as a harmful tool that could potentially drive prices higher over the long term and lead to a damaging trade war by encouraging tit-for-tat tariffs.
During the run-up to the presidential election in November 2024, Donald Trump made it clear that he intends to use tariffs to support the US economy and American producers. In 2024, Mexico, China and Canada accounted for 42% of total US imports. In this period, Mexico stood out as the top exporter with $466.6 billion, according to the US Census Bureau. Hence, Trump wants to focus on these three nations when imposing tariffs. He also plans to use the revenue generated through tariffs to lower personal income taxes.
-
19:03
United States 7-Year Note Auction fell from previous 4.457% to 4.194%
-
18:43
US President Donald Trump widens scope of tariffs, but pushes back timeline
US President Donald Trump hit markets with fresh tariff headlines on Wednesday, re-reiterating his insistence on 25% tariffs on Canada and Mexico, as well as adding the European Union to the mixed bad of countries that he will penalize US consumers for importing from.
Despite a fresh doubling down on his plans to fund the US' deficit spending with import taxes, President Trump has also kicked his own tariff can down the road for a fourth straight time, deciding that tariffs on Canadian and Mexican imports won't go into effect until April.
Key highlights
Not stopping the tariffs.
Tariffs will go on, not all, but a lot of them.
Canada and Mexico tariffs go into effect April 2nd.
We don't need Canada's lumber.
Trump decision on tariffs on EU: 25%
Details on EU tariffs coming soon.
EU can try to retaliate on tariffs.
EU tariffs to be 25% on autos, and other things.
-
17:49
BoE's Dhingra: Monetary policy alone is not well-suited to dealing with price shocks
Bank of England (BoE) Monetary Policy Committee Member Swati Dhingra noted on Wednesday that there is only so much central bank policy can do in the face of trade-based supply shocks in order to keep prices stable.
Key highlights
Monetary policy action alone is not well-suited to address system price shocks in key sectors such as energy and food.
If the world economy fragments in an orderly way, monetary policy would likely not need to respond.
In a world where external supply shocks become more prevalent, an independent monetary authority with a clear inflation target is essential.
Higher US tariffs likely to cause a strengthening of the US Dollar in the short term would have some price-increasing effects in the UK.
On the overall impact on inflation in the UK from US tariffs, the direct effect of US import costs and US Dollar strengthening are likely to be offset by reduced global price pressures.
-
17:28
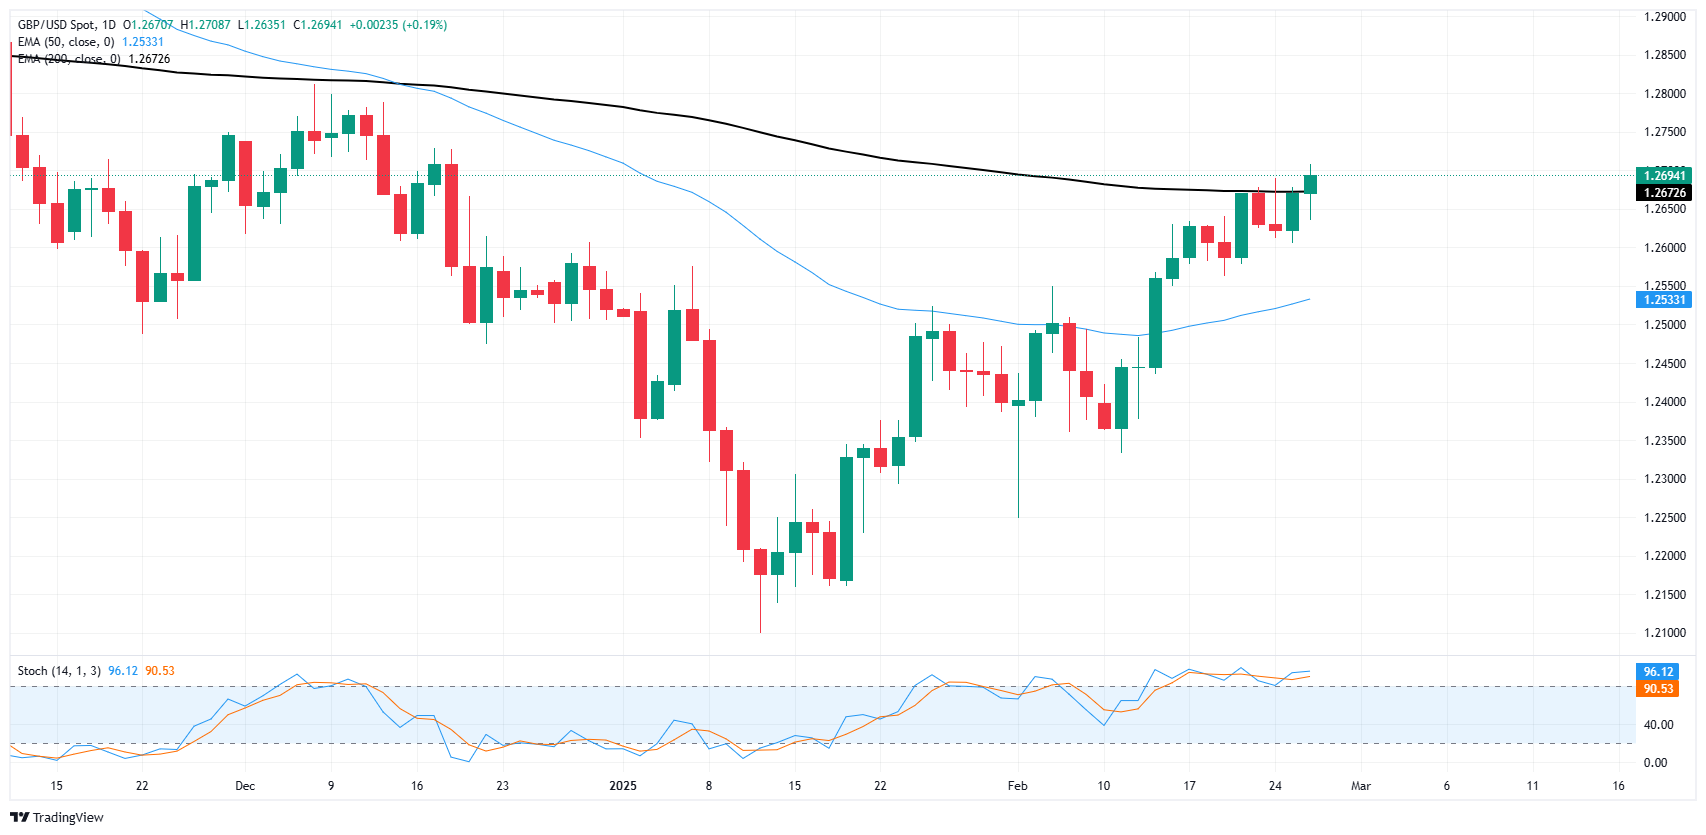
GBP/USD climbs to fresh 10-week highs on Wednesday
- GBP/USD climbs another quarter of a percent to reach new 10-week highs.
- Cable traders are pushing the pair into 1.2700 despite thin headlines.
- No news is good news as the UK looks set to continue coasting, BoE set for three more rate cuts.
GBP/USD coasted into a fresh 10-week high on Wednesday, clipping the 1.2700 handle for the first time since mid-December as hopeful bulls bid Cable higher for no other reason than there doesn't seem to be any bad news on the horizon, at least for now.
The Pound Sterling is enjoying a nice reprieve from any geopolitical or economic headlines: the UK looks set to continue missing the majority of US President Donald Trump's ire on trade or other factors, at least for the time being. The Bank of England's (BoE) current rate trajectory is still pointing at three more rate cuts in 2025, but further rate cuts from the BoE are fully priced in.
GBP/USD price forecast
Wednesday's bullish push behind the Pound Sterling has bolstered GBP/USD above the 200-day Exponential Moving Average (EMA) at 1.2670, marking the first time bids have traded north of the key moving average since tumbling south of it in the middle of November 2024. Price action still needs to secure a close before the technical signal could imply further room to the upside, but momenutm is firmly cooking to give the edsge to bulls as Cable extends its 5% climb from the last major swing low into 1.2100.
GBP/USD daily chart
Pound Sterling FAQs
The Pound Sterling (GBP) is the oldest currency in the world (886 AD) and the official currency of the United Kingdom. It is the fourth most traded unit for foreign exchange (FX) in the world, accounting for 12% of all transactions, averaging $630 billion a day, according to 2022 data. Its key trading pairs are GBP/USD, also known as ‘Cable’, which accounts for 11% of FX, GBP/JPY, or the ‘Dragon’ as it is known by traders (3%), and EUR/GBP (2%). The Pound Sterling is issued by the Bank of England (BoE).
The single most important factor influencing the value of the Pound Sterling is monetary policy decided by the Bank of England. The BoE bases its decisions on whether it has achieved its primary goal of “price stability” – a steady inflation rate of around 2%. Its primary tool for achieving this is the adjustment of interest rates. When inflation is too high, the BoE will try to rein it in by raising interest rates, making it more expensive for people and businesses to access credit. This is generally positive for GBP, as higher interest rates make the UK a more attractive place for global investors to park their money. When inflation falls too low it is a sign economic growth is slowing. In this scenario, the BoE will consider lowering interest rates to cheapen credit so businesses will borrow more to invest in growth-generating projects.
Data releases gauge the health of the economy and can impact the value of the Pound Sterling. Indicators such as GDP, Manufacturing and Services PMIs, and employment can all influence the direction of the GBP. A strong economy is good for Sterling. Not only does it attract more foreign investment but it may encourage the BoE to put up interest rates, which will directly strengthen GBP. Otherwise, if economic data is weak, the Pound Sterling is likely to fall.
Another significant data release for the Pound Sterling is the Trade Balance. This indicator measures the difference between what a country earns from its exports and what it spends on imports over a given period. If a country produces highly sought-after exports, its currency will benefit purely from the extra demand created from foreign buyers seeking to purchase these goods. Therefore, a positive net Trade Balance strengthens a currency and vice versa for a negative balance.
-
17:11
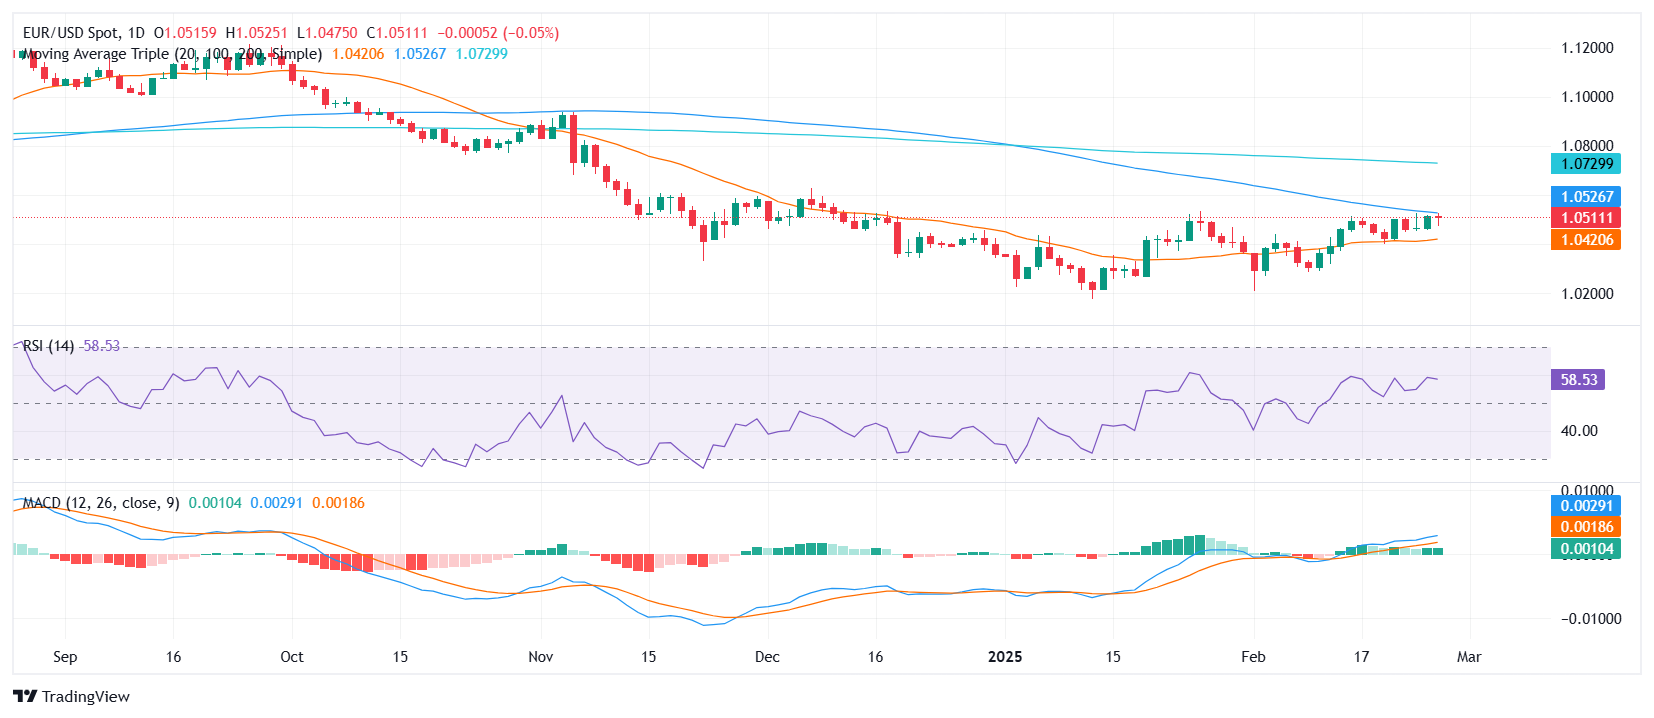
EUR/USD Price Analysis: Bulls struggle as key resistance holds firm
- EUR/USD registers another decline after facing its third rejection at the 100-day SMA.
- RSI remains in positive territory but declines sharply, signaling fading bullish momentum.
- The 100-day and 20-day SMAs are converging, hinting at a possible bearish crossover.
EUR/USD continued to struggle on Wednesday, retreating after failing to break above the 100-day Simple Moving Average (SMA) for a third time. This repeated rejection suggests that bullish attempts are losing traction, while sellers are gradually regaining control. The confluence of technical indicators now hints at a potential shift in the broader outlook.
Technical readings point to weakening momentum. The Relative Strength Index (RSI) remains in positive territory but has turned lower, indicating that buyers are losing confidence. Meanwhile, the Moving Average Convergence Divergence (MACD) histogram prints flat green bars, reflecting a lack of strong directional conviction.
A key development to watch is the approaching convergence of the 100-day and 20-day SMAs, which could form a bearish crossover if the trend persists. A successful break below the 20-day SMA near the 1.0450 zone could reinforce downside risks, while any renewed attempt to breach the 100-day SMA would be critical for bullish continuation.
EUR/USD daily chart
-
17:00
Russia Industrial Output below expectations (4.2%) in January: Actual (2.2%)
-
16:45
Below 11.00, EUR/SEK can return to levels last seen in early 2023 – Rabobank
The SEK is the best performing G10 currency in the month to date, Rabobank's FX analyst Jane Foley notes.
EUR/SEK hits a fresh 1 year low and bounces back
"At the end of last week EUR/SEK hit a fresh 1 year low and has since been bumping along close to the 11.12/11.14 support area. A break below could see the currency pair heading to the December 2023 low and Rabobank’s target at the 11.00 mark. A break below EUR/SEK11.00 would see the currency pair returning to levels last seen in early 2023."
-
16:30
United States EIA Crude Oil Stocks Change came in at -2.332M, below expectations (2.34M) in February 21
-
16:00
Mexican Peso tumbles on trade war fears, US high yields boost USD
- Mexican Peso weakens as Trump eyes copper tariffs, trade tensions escalate
- USD/MXN climbs past 20.50 as US Treasury yields rebound.
- US Treasury Secretary Bessent warns of economic fragility and supports tariffs as a revenue source.
- Mexico’s Balance of Trade and jobs data are in focus amid rising trade policy uncertainty.
The Mexican Peso (MXN) begins Wednesday's session on the backfoot against the US Dollar (USD) as US Treasury bond yields recover, underpinning the Greenback. The United States (US), imposing tariffs on its allies and adversaries, continued to grab the headlines, while US Treasury Secretary Scott Bessent noted the economy is “fragile.” At the time of writing, the USD/MXN pair trades at 20.51, up 0.24%.
A possible trade war spurred by US President Donald Trump keeps the Mexican Peso heavy. He had set his sights on copper and directed the Commerce Department to examine copper tariffs, with Mexico being one of the country's top importers. Meanwhile, US Treasury Secretary Bessent echoed some of his comments, saying that tariffs would be a source of revenue for the government.
Bessent warned that the economy is more fragile than economic indicators suggest, mentioning interest rate volatility, stickier inflation and reliance on government-sponsored job growth.
In the meantime, an absent economic docket in Mexico keeps USD/MXN traders leaning on dynamics linked to trade policies between the US and Mexico. Mexico’s Secretary of Commerce, Marcelo Ebrard, said that his first meeting with his counterpart, Howard Lutnick, was used to set the ground and establish general ideas about the importance of trade between both countries.
This week, Mexico’s docket will feature the Balance of Trade data for January alongside jobs data.
Daily digest market movers: Mexican Peso weakens ahead of Trump’s 30-day tariff deadline
- The Balance of Trade in Mexico is expected to show a deficit of $-3.8 billion, down from a surplus of $2.567 billion in December.
- Mexico’s Unemployment Rate in January is projected to rise three-tenths from 2.4% to 2.7%.
- Mexico’s February mid-month core inflation increased from 3.61% to 3.63% YoY. Headline prices rose by 3.74% YoY, as expected by analysts.
- Washington is pushing the Mexican government to levy tariffs on Chinese imports to the country.
- The swaps markets hint that the Federal Reserve might ease policy by 58 basis points, up from last week's 40 bps in 2025, via data from the Chicago Board of Trade (CBOT).
- Trade disputes between the US and Mexico remain front and center. Although the countries found common ground previously, USD/MXN traders should know that the 30-day pause is about to end, and tensions could trigger volatility in the pair during the rest of the week.
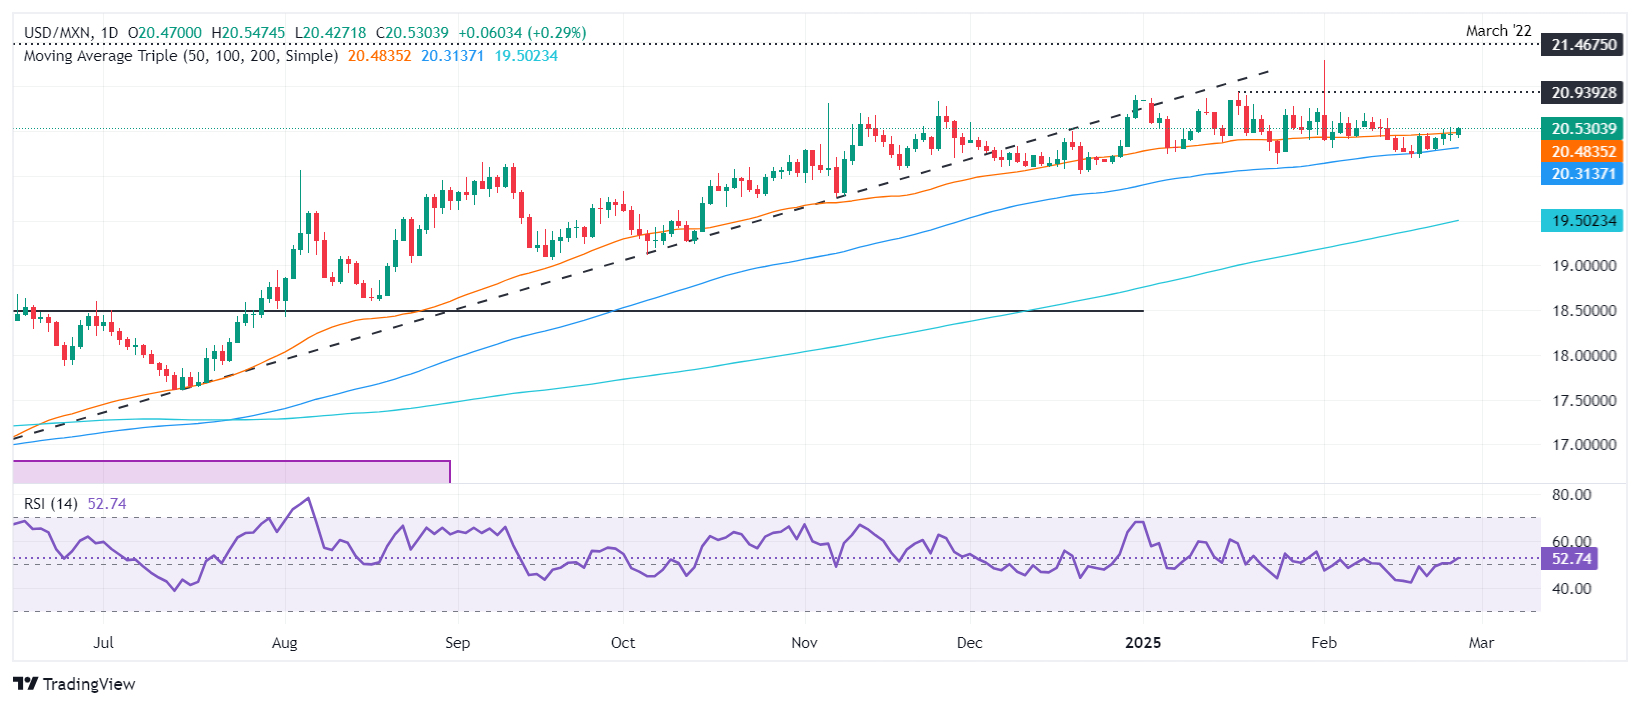
USD/MXN technical outlook: Mexican Peso drops as USD/MXN hurdles 50-day SMA
USD/MXN remains upward biased, and once it surpasses the 50-day Simple Moving Average (SMA) at 20.45, the path toward clearing 20.50 is on the cards. The Relative Strength Index (RSI), above 50, hit its highest peak in February, an indication that momentum favors buyers. They must clear the January 17 high of 20.93, followed by 21.00 and the year-to-date (YTD) high of 21.28.
Conversely, if USD/MXN struggles at the 50-day SMA, it could drop to the 100-day SMA at 20.24. On further weakness, the pair might surpass that dynamic support and head towards the 20.00 figure.
Mexican Peso FAQs
The Mexican Peso (MXN) is the most traded currency among its Latin American peers. Its value is broadly determined by the performance of the Mexican economy, the country’s central bank’s policy, the amount of foreign investment in the country and even the levels of remittances sent by Mexicans who live abroad, particularly in the United States. Geopolitical trends can also move MXN: for example, the process of nearshoring – or the decision by some firms to relocate manufacturing capacity and supply chains closer to their home countries – is also seen as a catalyst for the Mexican currency as the country is considered a key manufacturing hub in the American continent. Another catalyst for MXN is Oil prices as Mexico is a key exporter of the commodity.
The main objective of Mexico’s central bank, also known as Banxico, is to maintain inflation at low and stable levels (at or close to its target of 3%, the midpoint in a tolerance band of between 2% and 4%). To this end, the bank sets an appropriate level of interest rates. When inflation is too high, Banxico will attempt to tame it by raising interest rates, making it more expensive for households and businesses to borrow money, thus cooling demand and the overall economy. Higher interest rates are generally positive for the Mexican Peso (MXN) as they lead to higher yields, making the country a more attractive place for investors. On the contrary, lower interest rates tend to weaken MXN.
Macroeconomic data releases are key to assess the state of the economy and can have an impact on the Mexican Peso (MXN) valuation. A strong Mexican economy, based on high economic growth, low unemployment and high confidence is good for MXN. Not only does it attract more foreign investment but it may encourage the Bank of Mexico (Banxico) to increase interest rates, particularly if this strength comes together with elevated inflation. However, if economic data is weak, MXN is likely to depreciate.
As an emerging-market currency, the Mexican Peso (MXN) tends to strive during risk-on periods, or when investors perceive that broader market risks are low and thus are eager to engage with investments that carry a higher risk. Conversely, MXN tends to weaken at times of market turbulence or economic uncertainty as investors tend to sell higher-risk assets and flee to the more-stable safe havens.
-
16:00
United States New Home Sales (MoM) below forecasts (0.68M) in January: Actual (0.657M)
-
16:00
United States New Home Sales (MoM) above expectations (0.68M) in January: Actual (1.473M)
-
15:29
USD/CAD Price Forecast: Refreshes fortnight high around 1.4350
- USD/CAD posts a fresh 15-day high 1.4350 amid a strong recovery in the US Dollar.
- Investors expect Trump’s tax agenda to be pro-growth and inflationary for the economy.
- BoC dovish bets continue to weigh on the Canadian Dollar.
The USD/CAD pair extends its winning spree for the fourth trading day on Wednesday. The Loonie pair posts a fresh fortnight high near 1.4360 as the US Dollar (USD) gains further on expectations that United States (US) President Donald Trump’s $4.5 trillion, which passed by the House of Representatives on Tuesday, would boost inflation and growth in the economy.
The US Dollar Index (DXY), which gauges the Greenback’s value against six major currencies, jumps to near 106.60 after recovering from the 11-week low of 106.10 earlier in the day.
Higher inflation and upbeat economic growth would compel Federal Reserve (Fed) officials to maintain a restrictive monetary policy stance for a longer period.
Meanwhile, the Canadian Dollar (CAD) underperforms as investors expect the Bank of Canada (BoC) to further reduce interest rates. The BoC has already reduced its key borrowing rates to near 3% from the peak of 5% seen in May 2024.
Canadian inflation continues to remain below the BoC’s target of 2% due to sluggish economic growth.
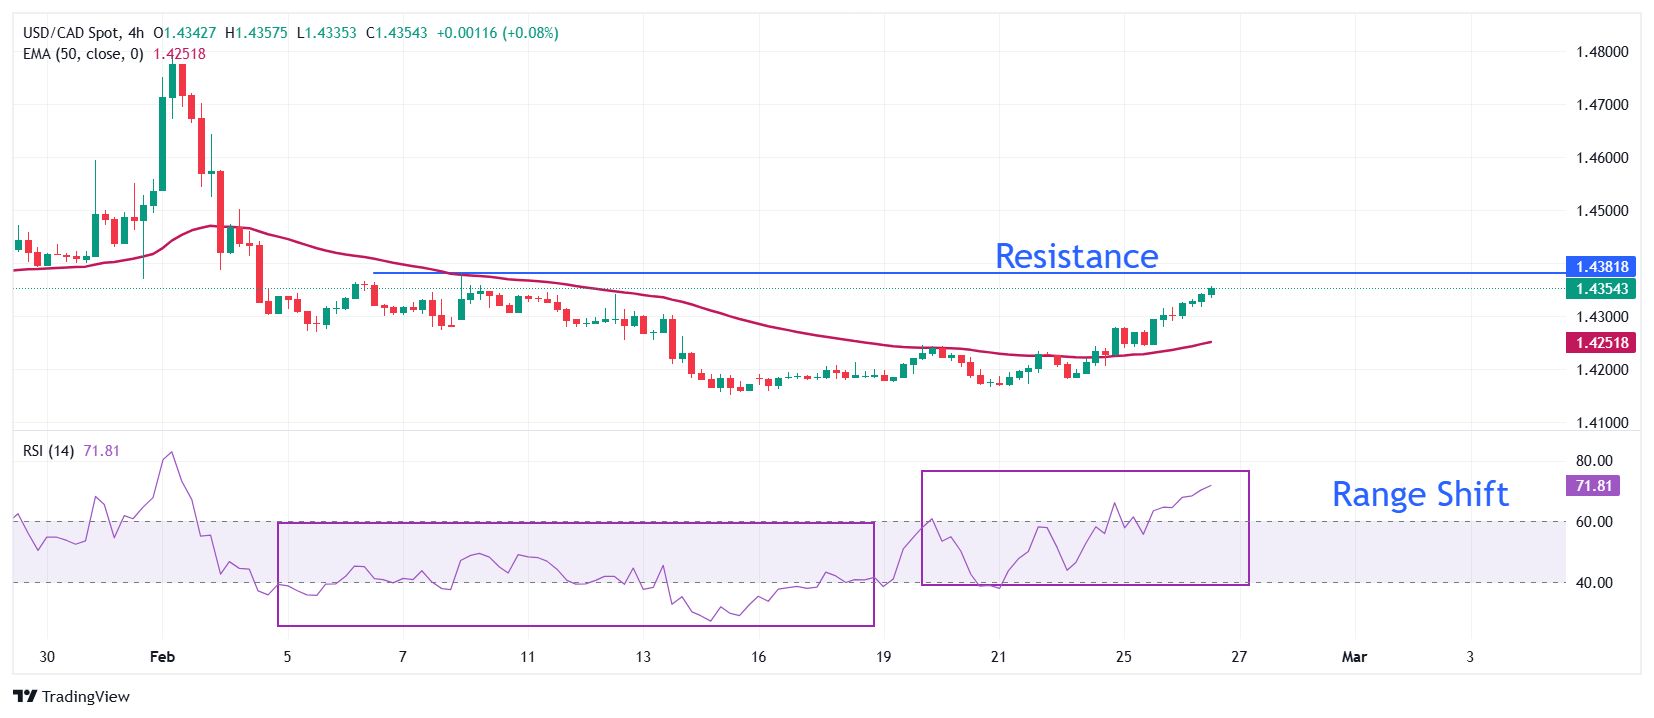
USD/CAD rallied to near 1.4350 after a strong recovery from the February 14 low of 1.4150. The Loonie pair climbed above the 50-period Exponential Moving Average (EMA), which is around 1.4250, suggesting that the near-term trend has turned bullish.
The 14-period Relative Strength Index (RSI) exhibits a range shift move from the 20.00-60.00 block to the 40.00-80.00 territory, which indicates a bullish reversal.
Going forward, a further upside move above the February 9 high of 1.4380 will open the door toward the round-level hurdle of 1.4400 and the psychological resistance of 1.4500.
On the contrary, if the pair breaks below its February 14 low of 1.4151, it will fall to its December 9 low of 1.4094, followed by its December 6 low of 1.4020.
USD/CAD four-hour chart
Canadian Dollar FAQs
The key factors driving the Canadian Dollar (CAD) are the level of interest rates set by the Bank of Canada (BoC), the price of Oil, Canada’s largest export, the health of its economy, inflation and the Trade Balance, which is the difference between the value of Canada’s exports versus its imports. Other factors include market sentiment – whether investors are taking on more risky assets (risk-on) or seeking safe-havens (risk-off) – with risk-on being CAD-positive. As its largest trading partner, the health of the US economy is also a key factor influencing the Canadian Dollar.
The Bank of Canada (BoC) has a significant influence on the Canadian Dollar by setting the level of interest rates that banks can lend to one another. This influences the level of interest rates for everyone. The main goal of the BoC is to maintain inflation at 1-3% by adjusting interest rates up or down. Relatively higher interest rates tend to be positive for the CAD. The Bank of Canada can also use quantitative easing and tightening to influence credit conditions, with the former CAD-negative and the latter CAD-positive.
The price of Oil is a key factor impacting the value of the Canadian Dollar. Petroleum is Canada’s biggest export, so Oil price tends to have an immediate impact on the CAD value. Generally, if Oil price rises CAD also goes up, as aggregate demand for the currency increases. The opposite is the case if the price of Oil falls. Higher Oil prices also tend to result in a greater likelihood of a positive Trade Balance, which is also supportive of the CAD.
While inflation had always traditionally been thought of as a negative factor for a currency since it lowers the value of money, the opposite has actually been the case in modern times with the relaxation of cross-border capital controls. Higher inflation tends to lead central banks to put up interest rates which attracts more capital inflows from global investors seeking a lucrative place to keep their money. This increases demand for the local currency, which in Canada’s case is the Canadian Dollar.
Macroeconomic data releases gauge the health of the economy and can have an impact on the Canadian Dollar. Indicators such as GDP, Manufacturing and Services PMIs, employment, and consumer sentiment surveys can all influence the direction of the CAD. A strong economy is good for the Canadian Dollar. Not only does it attract more foreign investment but it may encourage the Bank of Canada to put up interest rates, leading to a stronger currency. If economic data is weak, however, the CAD is likely to fall.
-
14:29
AUD/USD tumbles to near 0.6300 as US Dollar extends recovery
- AUD/USD falls sharply to near 0.6300 as the US Dollar extends its recovery.
- The US Dollar strengthens as the US House of Representatives passes Trump’s tax cut bill.
- Slower-than-expected growth in Aussie inflation weighs on the Australian Dollar.
The AUD/USD pair falls significantly to near the round-level support of 0.6300 in the North American session on Wednesday. The Aussie pair is down almost 0.6% as the US Dollar (USD) recovers further as the Republicans-controlled-United States (US) House of Representatives passed President Donald Trump’s tax cut bill on Tuesday.
The US Dollar Index (DXY), which tracks the Greenback’s value against six major currencies, extends its recovery to near 106.60. The USD Index rebounds in the Asian session after discovering buying interest near the 11-week low of around 106.10.
Investors expect President Trump’s $4.5 trillion tax cut bill to be pro-growth and inflationary for the economy. This scenario would force Federal Reserve (Fed) officials to maintain a restrictive monetary policy stance for longer.
To get cues about the current status of inflation, investors will focus on the US Personal Consumption Expenditure Price Index (PCE) data for January, which will be released on Friday. The underlying inflation data, which is the Fed’s preferred inflation gauge, is expected to influence market speculation about the Fed’s monetary policy outlook. According to the CME FedWatch tool, the Fed is expected to keep interest rates steady in the range of 4.25%-4.50%.
Meanwhile, the Australian Dollar (AUD) underperforms its peers on softer-than-expected growth in the Australian Monthly Consumer Price Index (CPI) data for January. Australian CPI rose by 2.5% year-on-year, slower than estimates of 2.6% but at a steady pace seen in December.
Australian Dollar PRICE Today
The table below shows the percentage change of Australian Dollar (AUD) against listed major currencies today. Australian Dollar was the strongest against the New Zealand Dollar.
USD EUR GBP JPY CAD AUD NZD CHF USD 0.23% 0.07% 0.28% 0.21% 0.46% 0.42% 0.25% EUR -0.23% -0.15% 0.05% -0.02% 0.24% 0.19% 0.02% GBP -0.07% 0.15% 0.19% 0.15% 0.40% 0.35% 0.19% JPY -0.28% -0.05% -0.19% -0.07% 0.18% 0.13% -0.01% CAD -0.21% 0.02% -0.15% 0.07% 0.25% 0.21% 0.06% AUD -0.46% -0.24% -0.40% -0.18% -0.25% -0.04% -0.19% NZD -0.42% -0.19% -0.35% -0.13% -0.21% 0.04% -0.15% CHF -0.25% -0.02% -0.19% 0.01% -0.06% 0.19% 0.15% The heat map shows percentage changes of major currencies against each other. The base currency is picked from the left column, while the quote currency is picked from the top row. For example, if you pick the Australian Dollar from the left column and move along the horizontal line to the US Dollar, the percentage change displayed in the box will represent AUD (base)/USD (quote).
Last week, the Reserve Bank of Australia (RBA) stated that the battle against inflation is far from over after reducing interest rates by 25 basis points (bps) to 4.1%.
Going forward, Trump’s tariff fears would keep the Aussie Dollar on its toes. Till now, Trump has imposed 10% tariffs on imports from China and has threatened a 100% levy on BRICS if they attempt to replace the US Dollar.
Australian Dollar FAQs
One of the most significant factors for the Australian Dollar (AUD) is the level of interest rates set by the Reserve Bank of Australia (RBA). Because Australia is a resource-rich country another key driver is the price of its biggest export, Iron Ore. The health of the Chinese economy, its largest trading partner, is a factor, as well as inflation in Australia, its growth rate and Trade Balance. Market sentiment – whether investors are taking on more risky assets (risk-on) or seeking safe-havens (risk-off) – is also a factor, with risk-on positive for AUD.
The Reserve Bank of Australia (RBA) influences the Australian Dollar (AUD) by setting the level of interest rates that Australian banks can lend to each other. This influences the level of interest rates in the economy as a whole. The main goal of the RBA is to maintain a stable inflation rate of 2-3% by adjusting interest rates up or down. Relatively high interest rates compared to other major central banks support the AUD, and the opposite for relatively low. The RBA can also use quantitative easing and tightening to influence credit conditions, with the former AUD-negative and the latter AUD-positive.
China is Australia’s largest trading partner so the health of the Chinese economy is a major influence on the value of the Australian Dollar (AUD). When the Chinese economy is doing well it purchases more raw materials, goods and services from Australia, lifting demand for the AUD, and pushing up its value. The opposite is the case when the Chinese economy is not growing as fast as expected. Positive or negative surprises in Chinese growth data, therefore, often have a direct impact on the Australian Dollar and its pairs.
Iron Ore is Australia’s largest export, accounting for $118 billion a year according to data from 2021, with China as its primary destination. The price of Iron Ore, therefore, can be a driver of the Australian Dollar. Generally, if the price of Iron Ore rises, AUD also goes up, as aggregate demand for the currency increases. The opposite is the case if the price of Iron Ore falls. Higher Iron Ore prices also tend to result in a greater likelihood of a positive Trade Balance for Australia, which is also positive of the AUD.
The Trade Balance, which is the difference between what a country earns from its exports versus what it pays for its imports, is another factor that can influence the value of the Australian Dollar. If Australia produces highly sought after exports, then its currency will gain in value purely from the surplus demand created from foreign buyers seeking to purchase its exports versus what it spends to purchase imports. Therefore, a positive net Trade Balance strengthens the AUD, with the opposite effect if the Trade Balance is negative.
-
13:10
US Dollar Index holds near yearly lows pressured by lower yields
- The US Dollar slightly recovers on Wednesday, looking for direction against most major peers.
- Traders are mulling rate cut bets by the Fed with Tump’s tariffs set to kick in at the start of March.
- The US Dollar Index (DXY) holds near yearly lows and looks sluggish.
The US Dollar Index (DXY), which tracks the performance of the US Dollar (USD) against six major currencies, edges slightly higher and trades around 106.50 at the time of writing on Wednesday after not breaking any pots or making any positive impressions in February. The DXY Index holds near yearly lows as traders shun the Greenback in a flight to safe havens from United States (US) President Donald Trump’s tariffs, which are set to kick in on March 4 for Mexico, Canada, and China.
Meanwhile, traders are seeing a second element of a weaker greenback. For the first time this year, Federal Reserve (Fed) rate cut bets are pricing in two rate cuts for 2025. The move comes as the interest rate gap between US yields and other countries narrowed, triggering a weaker US Dollar overall. It comes just days before the Fed’s preferred inflation gauge, the Personal Consumption Expenditures (PCE) data, which will be released on Friday.
Daily digest market movers: Trump ahead
- At 14:00 GMT, US President Donald Trump will be speaking with the media.
- At 15:00 GMT, New Home Sales are expected to slow down to 0.68 million units for January compared to the 0.698 million units a month earlier.
- At 17:00 GMT, President of the Federal Reserve Bank of Atlanta Raphael Bostic participates in a moderated discussion at the Urban Land Institute in Atlanta.
- At 18:00 GMT, Federal Reserve Bank of Richmond President Thomas Barkin delivers a speech, "Inflation Then and Now", at the Northern Virginia Chamber of Commerce, Arlington.
- Equities are brushing off the negative tone from Tuesday and are up across the board on Wednesday.
- The CME FedWatch tool shows an uptick in chances for an interest rate cut by the Federal Reserve (Fed) in June, backed by the drop in US yields this Wednesday. Currently, the tool projects a 66.2% chance of interest rates being lower than current levels compared to 33.8% for no rate cut
- The US 10-year yield trades around 4.30%, further down from last week’s high at 4.574%.
US Dollar Index Technical Analysis: Yields into the ground
Lower US Yields drive theUS Dollar Index (DXY) into the ground. The dive in US yields only picked up speed after US Treasury Secretary Scott Bessent said on Tuesday that US rates would come down anyway, even without the Fed. Expect to see the DXY dive lower to the long-awaited 106.00 barrier.
On the upside, the DXY index is trying to recover the 106.52 (April 16, 2024, high) level on Wednesday after breaking and closing below it the prior day. Further up, the 100-day Simple Moving Average (SMA) could limit bulls buying the Greenback near 106.71. From there, the next leg could go up to 107.35, a pivotal support from December 2024 and January 2025. In case US yields recover and head higher again, even 107.96 (55-day SMA) could be tested.
On the downside, if the DXY cannot recover the 106.52 level, another leg lower might be needed to entice those Dollar bulls to reenter near 105.89 or even 105.33.

US Dollar Index: Daily Chart
US Dollar FAQs
The US Dollar (USD) is the official currency of the United States of America, and the ‘de facto’ currency of a significant number of other countries where it is found in circulation alongside local notes. It is the most heavily traded currency in the world, accounting for over 88% of all global foreign exchange turnover, or an average of $6.6 trillion in transactions per day, according to data from 2022. Following the second world war, the USD took over from the British Pound as the world’s reserve currency. For most of its history, the US Dollar was backed by Gold, until the Bretton Woods Agreement in 1971 when the Gold Standard went away.
The most important single factor impacting on the value of the US Dollar is monetary policy, which is shaped by the Federal Reserve (Fed). The Fed has two mandates: to achieve price stability (control inflation) and foster full employment. Its primary tool to achieve these two goals is by adjusting interest rates. When prices are rising too quickly and inflation is above the Fed’s 2% target, the Fed will raise rates, which helps the USD value. When inflation falls below 2% or the Unemployment Rate is too high, the Fed may lower interest rates, which weighs on the Greenback.
In extreme situations, the Federal Reserve can also print more Dollars and enact quantitative easing (QE). QE is the process by which the Fed substantially increases the flow of credit in a stuck financial system. It is a non-standard policy measure used when credit has dried up because banks will not lend to each other (out of the fear of counterparty default). It is a last resort when simply lowering interest rates is unlikely to achieve the necessary result. It was the Fed’s weapon of choice to combat the credit crunch that occurred during the Great Financial Crisis in 2008. It involves the Fed printing more Dollars and using them to buy US government bonds predominantly from financial institutions. QE usually leads to a weaker US Dollar.
Quantitative tightening (QT) is the reverse process whereby the Federal Reserve stops buying bonds from financial institutions and does not reinvest the principal from the bonds it holds maturing in new purchases. It is usually positive for the US Dollar.
-
13:00
United States MBA Mortgage Applications: -1.2% (February 21) vs -6.6%
-
12:04
WTI trades cautiously near two-month low of $68.60 on peace deal, tariff fears
- The Oil price sees more downside as investors remain hopeful for Russia-Ukraine peace.
- A global economic slowdown by Trump’s tariffs in an unfavorable scenario on the Oil price.
- Investors await the US EIA crude stock data, which will be published at 15:30 GMT.
West Texas Intermediate (WTI), futures on NYMEX, trades with caution around two-month low of $68.60 in European trading hours on Wednesday. The Oil price struggles to gain ground as the Oil demand outlook has weakened due to growing optimism over Russia-Ukraine peace and fears of United States (US) President Donald Trump’s tariff agenda.
The White House has said that President is aiming to end war in Ukraine as early as possible. President Trump is also expected to meet Russian leader Vladimir Putin sooner to discuss more about negotiation terms.
Meanwhile, the US and Ukraine have agreed to terms of a draft minerals deal that doesn’t have U.S. security guarantees or continued flow of weapons, Reuters reported on Tuesday. Market participants have considered the move as a positive step towards peace in Ukraine.
Positive developments in Russia-Ukraine peace would an unfavorable scenario for the Oil price, assuming that the US and Europe would lift sanctions on Russia if it calls off war in Ukraine that will lead to an increase in seaborne oil flows in the global market.
Fears of a global slowdown from Trump’s tariff agenda has also kept the Oil price on the backboot. Till now, Trump has announced 10% tariffs on imports from China and 25% on aluminum and steel imports. He is planning to announce reciprocal tariffs and 25% levies on foreign cars, pharmaceuticals and semiconductors by April.
In today’s session, investors will focus on the US Energy Information Administration (EIA) crude inventory data for the week ending February 21. The US EIA is expected to have seen an increase in oil stockpiles by 2.34 million barrels.
WTI Oil FAQs
WTI Oil is a type of Crude Oil sold on international markets. The WTI stands for West Texas Intermediate, one of three major types including Brent and Dubai Crude. WTI is also referred to as “light” and “sweet” because of its relatively low gravity and sulfur content respectively. It is considered a high quality Oil that is easily refined. It is sourced in the United States and distributed via the Cushing hub, which is considered “The Pipeline Crossroads of the World”. It is a benchmark for the Oil market and WTI price is frequently quoted in the media.
Like all assets, supply and demand are the key drivers of WTI Oil price. As such, global growth can be a driver of increased demand and vice versa for weak global growth. Political instability, wars, and sanctions can disrupt supply and impact prices. The decisions of OPEC, a group of major Oil-producing countries, is another key driver of price. The value of the US Dollar influences the price of WTI Crude Oil, since Oil is predominantly traded in US Dollars, thus a weaker US Dollar can make Oil more affordable and vice versa.
The weekly Oil inventory reports published by the American Petroleum Institute (API) and the Energy Information Agency (EIA) impact the price of WTI Oil. Changes in inventories reflect fluctuating supply and demand. If the data shows a drop in inventories it can indicate increased demand, pushing up Oil price. Higher inventories can reflect increased supply, pushing down prices. API’s report is published every Tuesday and EIA’s the day after. Their results are usually similar, falling within 1% of each other 75% of the time. The EIA data is considered more reliable, since it is a government agency.
OPEC (Organization of the Petroleum Exporting Countries) is a group of 12 Oil-producing nations who collectively decide production quotas for member countries at twice-yearly meetings. Their decisions often impact WTI Oil prices. When OPEC decides to lower quotas, it can tighten supply, pushing up Oil prices. When OPEC increases production, it has the opposite effect. OPEC+ refers to an expanded group that includes ten extra non-OPEC members, the most notable of which is Russia.
-
11:58
USD/JPY: Inability to overcome 152.50 can lead to continuation in decline – BBH
USD/JPY has experienced a steady decline after carving out a lower high at 158.85 than the one achieved in 2024 at 162, BBH's FX analysts report.
Next potential supports might be at 147/146.85 and 145
"It recently gave up the 200-DMA and is now challenging December trough of 148.60, which is an interim support. Daily MACD has dipped below equilibrium line after posting negative divergence denoting prevalence of downward momentum."
"If a short-term bounce develops, the Moving Average at 152.50 could provide resistance. Inability to overcome 152.50 can lead to continuation in decline. Next potential supports could be located at projections of 147/146.85 and 145."
-
11:44
EU gas prices face pressure – ING
European natural gas prices faced significant pressure yesterday, with TTF ending the day 6% lower, ING’s commodity analysts Warren Patterson and Ewa Manthey notes.
EU gas storage is a little over 40% full
"The US-Ukraine minerals deal contributed to downward pressures. German utilities are calling for storage target rules to be eased ahead of next winter. This would reduce demand for gas storage through the injection season."
"Utilities favor lowering the storage target for 1 November from 90% to 80%. In addition, storage levels have been falling at a slower pace in recent days amid milder weather conditions. EU gas storage is a little over 40% full, down from 64% at the same stage last year, and below the 5-year average of 51%."
"However, this 5-year average is inflated by the milder winters seen in 2022/23 and 2023/24, along with Covid impacts in 2020."
-
11:41
USD/CNH: Strong support levels at 7.2420 and 7.2350 may stall the fall– UOB Group
US Dollar could edge lower vs Chinese Yuan (CNH), but there is a pair of strong support levels at 7.2420 and 7.2350. In the longer run, failure to hold below 7.2300 has diminished the likelihood of further USD decline, UOB Group’s FX analysts Quek Ser Leang and Peter Chia note.
The likelihood of further USD decline seems deminished
24-HOUR VIEW: "On Tuesday, USD fell to a low of 7.2264 before rebounding strongly. Yesterday (Wednesday), when USD was at 7.2550, we noted that 'the rebound gained some momentum.' We were of the view that 'there is a chance for USD to test the strong resistance at 7.2705.' Our view was correct as USD rose to 7.2703, pulling back to close largely unchanged at 7.2532 (-0.02%). This time around, the pullback has resulted in a slight increase in downward momentum. Today, USD could edge lower, but there are a pair of strong support levels at 7.2420 and 7.2350. Resistance levels are at 7.2570 and 7.2660."
1-3 WEEKS VIEW: "Last Friday (21 Feb, spot at 7.2400), we indicated that 'to continue to decline, USD must break and remain below 7.2300.' After USD fell to 7.2264 and rebounded, we indicated yesterday (25 Feb, spot at 7.2550) that “the failure to hold below 7.2300 has diminished the likelihood of further decline. Our view remains unchanged. Overall, only a breach of 7.2705 (no change in ‘strong resistance’ level) would indicate that the weakness in USD from the middle of the month has stabilised."
-
11:35
WTI comes below $70 – ING
Energy markets came under downward pressure yesterday. ICE Brent fell by 2.35%, while WTI is trading back below $70/bbl, ING’s commodity analysts Warren Patterson and Ewa Manthey notes.
Prospects for a peace deal between Russia and Ukraine are improving
"Lingering tariff risks and falling consumer confidence are fueling demand concerns. In addition, prospects for a peace deal between Russian and Ukraine are improving as the US and Ukraine agree on a minerals deal. It could be signed later this week. This would take us a step closer to Russian sanctions being lifted, removing much of the supply uncertainty hanging over the market."
"Meanwhile, American Petroleum Institute (API) data show that US crude oil inventories fell by 600k barrels last week. If confirmed by the EIA later today, it would mark the first decline in US crude oil inventories since mid-January. The market has been expecting a build of around 2.4m barrels."
"Last week’s output disruptions in North Dakota might’ve contributed to the stock decline. As for refined products, the API estimates that gasoline stocks increased by 500k barrels, while distillate inventories fell by 1.1m barrels."
-
11:32
USD/JPY has a chance to retest the 148.55 level – UOB Group
Chance for US Dollar (USD) to retest the 148.55 level vs Japanese Yen (JPY); a sustained break below this level is unlikely. In the longer run, USD weakness has not stabilised; pace of any further decline is likely slower. The next level to monitor is 147.70, UOB Group’s FX analysts Quek Ser Leang and Peter Chia note.
USD weakness has not stabilised
24-HOUR VIEW: "Following USD sharp rebound from a low of 148.63 two days ago, we highlighted yesterday that USD 'could rebound further, but any advance is unlikely to break above 150.55.' We were not wrong as USD rebounded to a high of 150.30. However, we did not anticipate the sharp selloff from the high, as USD plummeted to a low of 148.56 before rebounding to close at 149.02 (-0.46%). Despite the sharp drop from the high, there has been no significant increase in momentum. That said, as long as 149.70 (minor resistance is at 149.45) is not breached, there is a chance for USD to retest the 148.55 level. Given that momentum is not strong, a sustained break below this level is unlikely."
1-3 WEEKS VIEW: "We turned negative in USD early last week. After USD dropped to 148.63 and rebounded, we indicated yesterday (25 Feb, spot at 149.90) that 'downward momentum has slowed.' We also indicated that 'as long as 151.05 (‘strong resistance’ level) is not breached, there is still a slim chance for USD to drop to 148.63.' The subsequent price movements came as a surprise, as USD lurched lower during the NY session and reached a low of 148.56. Although the USD weakness has not stabilised, oversold conditions suggest the pace of any further decline is likely to be slower. The next level to monitor is 147.70. On the upside, the ‘strong resistance’ has
moved lower to 150.55 from 151.05." -
11:25
Copper tariff risk emerges – ING
COMEX Copper futures surged after President Trump ordered an investigation into Copper imports on national security concerns, paving the way for tariffs down the road, ING’s commodity analysts Warren Patterson and Ewa Manthey notes.
COMEX Copper futures up more than 3%
"The US imports roughly 45% of its Copper needs. As such, it’s not a surprise to see COMEX Copper futures up more than 3% at the time of writing. This move has also seen the COMEX/LME arbitrage widen back towards $900/t."
"The risk of Copper tariffs has the COMEX/LME arb behaving in a volatile manner in recent weeks. It briefly spiked above $1,000/t following the announcement of tariffs on steel and aluminium imports."
-
11:22
NZD/USD Price Forecast: Extends losing streak for fourth trading day
- NZD/USD slides further to near 0.5700 as the US Dollar gains ground recovering from the 11-week low.
- A green signal to US President Trump’s tax cut plan has supported the US Dollar.
- The RBNZ reduced its OCR by 50 bps to 3.75% last week, as expected.
The NZD/USD extends its losing spree for the fourth trading day on Wednesday and slides to near the key level of 0.5700 in European trading session. The Kiwi pair weakens further as the US Dollar (USD) bounces back after revisiting the 11-week low. The US Dollar Index (DXY), which gauges the Greenback’s value against six major currencies, recovers to near 106.50.
The Greenback discovers demand after the United States (US) House of Representatives approved US President Donald Trump’s $4.5 trillion tax cut plan with a narrow majority. Investors expect the Trump’s tax agenda would be inflationary for the economy. Such a scenario would force Federal Reserve (Fed) to maintain a restrictive monetary policy stance.
In the meantime, Fed dovish bets for the June policy meeting have escalated after the release of the weak US flash S&P Global PMI data for February released on Friday.
Meanwhile, the New Zealand Dollar (NZD) underperforms since Friday post the aftermath of the Reserve Bank of New Zealand’s (RBNZ) monetary policy announcement on February 19 in which the central bank reduced its Official Cash Rate (OCR) by 50 basis points (bps) to 3.75%, as expected, but guided a cautious stance on further monetary easing.
NZD/USD rebounds strongly from the support zone plotted around 0.5500 on a weekly timeframe. However, the 20-week Exponential Moving Average (EMA) near 0.5776 continues to remain a hurdle for the pair.
The 14-week Relative Strength Index (RSI) attempts to return inside the 40.00-60.00 range. A fresh bearish momentum would trigger if the RSI fails to do the same.
The Kiwi pair could decline to near round-level supports of 0.5400 and 0.5300 if it breaks below the 13-year low of 0.5470.
On the flip side, a decisive break above the February 21 high of 0.5773 could drive the pair to the December 10 high of 0.5867, followed by the November 29 high of 0.5930.
NZD/USD weekly chart

New Zealand Dollar FAQs
The New Zealand Dollar (NZD), also known as the Kiwi, is a well-known traded currency among investors. Its value is broadly determined by the health of the New Zealand economy and the country’s central bank policy. Still, there are some unique particularities that also can make NZD move. The performance of the Chinese economy tends to move the Kiwi because China is New Zealand’s biggest trading partner. Bad news for the Chinese economy likely means less New Zealand exports to the country, hitting the economy and thus its currency. Another factor moving NZD is dairy prices as the dairy industry is New Zealand’s main export. High dairy prices boost export income, contributing positively to the economy and thus to the NZD.
The Reserve Bank of New Zealand (RBNZ) aims to achieve and maintain an inflation rate between 1% and 3% over the medium term, with a focus to keep it near the 2% mid-point. To this end, the bank sets an appropriate level of interest rates. When inflation is too high, the RBNZ will increase interest rates to cool the economy, but the move will also make bond yields higher, increasing investors’ appeal to invest in the country and thus boosting NZD. On the contrary, lower interest rates tend to weaken NZD. The so-called rate differential, or how rates in New Zealand are or are expected to be compared to the ones set by the US Federal Reserve, can also play a key role in moving the NZD/USD pair.
Macroeconomic data releases in New Zealand are key to assess the state of the economy and can impact the New Zealand Dollar’s (NZD) valuation. A strong economy, based on high economic growth, low unemployment and high confidence is good for NZD. High economic growth attracts foreign investment and may encourage the Reserve Bank of New Zealand to increase interest rates, if this economic strength comes together with elevated inflation. Conversely, if economic data is weak, NZD is likely to depreciate.
The New Zealand Dollar (NZD) tends to strengthen during risk-on periods, or when investors perceive that broader market risks are low and are optimistic about growth. This tends to lead to a more favorable outlook for commodities and so-called ‘commodity currencies’ such as the Kiwi. Conversely, NZD tends to weaken at times of market turbulence or economic uncertainty as investors tend to sell higher-risk assets and flee to the more-stable safe havens.
-
11:02
EUR/USD declines as US House of Representatives passes Trump’s tax cut plan
- EUR/USD retraces below 1.0500 on Wednesday as the US Dollar gains amid a strong recovery in US bond yields.
- Republicans-controlled House of Representatives passed a $4.5 trillion tax cut plan on Tuesday.
- Investors await the preliminary German HICP for February and the US PCE inflation data for January, scheduled for Friday.
EUR/USD continues to face selling pressure above the psychological level of 1.0500 in Wednesday’s European session. The major currency pair falls due to a strong recovery in the US Dollar (USD). The US Dollar Index (DXY), which tracks the Greenback’s value against six major currencies, recovers sharply to near 106.50 after a weak opening around the 11-week low of 106.10 earlier in the day.
The Greenback capitalizes on a strong recovery in US bond yields, which had been sliding for almost a month. The 10-year US Treasury yields jump to near 4.33% after posting a fresh 13-week low at around 4.28% earlier in the day.
A green light to United States (US) President Donald Trump’s $4.5 trillion tax cut plan by the House of Representatives forced traders to dump government bonds, assuming that lower taxes on individuals would accelerate their purchasing power. Such a scenario would prompt inflationary pressures and force the Federal Reserve (Fed) to keep interest rates in the current range of 4.25%-4.50% for longer.
For fresh cues on the current status of inflation, investors await the US Personal Consumption Expenditures Price Index (PCE) data for January, which will be released on Friday. The core PCE inflation data – the Fed’s preferred inflation gauge as it excludes volatile food and energy items – is estimated to have decelerated to 2.6% year-over-year from 2.8% in December. Soft underlying inflation data would weigh on market expectations that the Fed will remain in the “waiting” mode for longer.
Daily digest market movers: EUR/USD drops amid recovery in US Dollar
- EUR/USD is down as investors have underpinned the US Dollar against the Euro (EUR). Meanwhile, the shared currency outperforms other peers as investors shift focus to the European Central Bank’s (ECB) policy meeting, which will be held next week.
- The ECB is almost certain to cut the Deposit Facility rate by 25 basis points (bps) to 2.5%. Therefore, investors will pay close attention to the ECB’s monetary policy guidance. A slew of ECB officials has been guiding that the central bank should continue reducing interest rates based on expectations that inflation will sustainably return to the 2% target.
- Soft Eurozone Q4 Negotiated Wage Rate data, a key measure of wage growth, has also boosted ECB dovish bets. On Tuesday, the ECB reported that the wage growth measure rose at a slower pace of 4.12% compared to the 5.43% increase seen in the third quarter of the previous year.
- However, ECB board member Isabel Schnabel seems to criticize dovish bets as she believes that Eurozone's economic weakness is “not due to overly high borrowing costs” but to “structural factors”. Her commentary indicated that she doesn’t support further policy easing. “It's no longer clear the current 2.75% rate is still holding back the eurozone economy,” Schnabel said.
- Going forward, investors will focus on the German flash Harmonized Index of Consumer Prices (HICP) data for February, which will be published on Friday.
Technical Analysis: EUR/USD wobbles around 1.0500
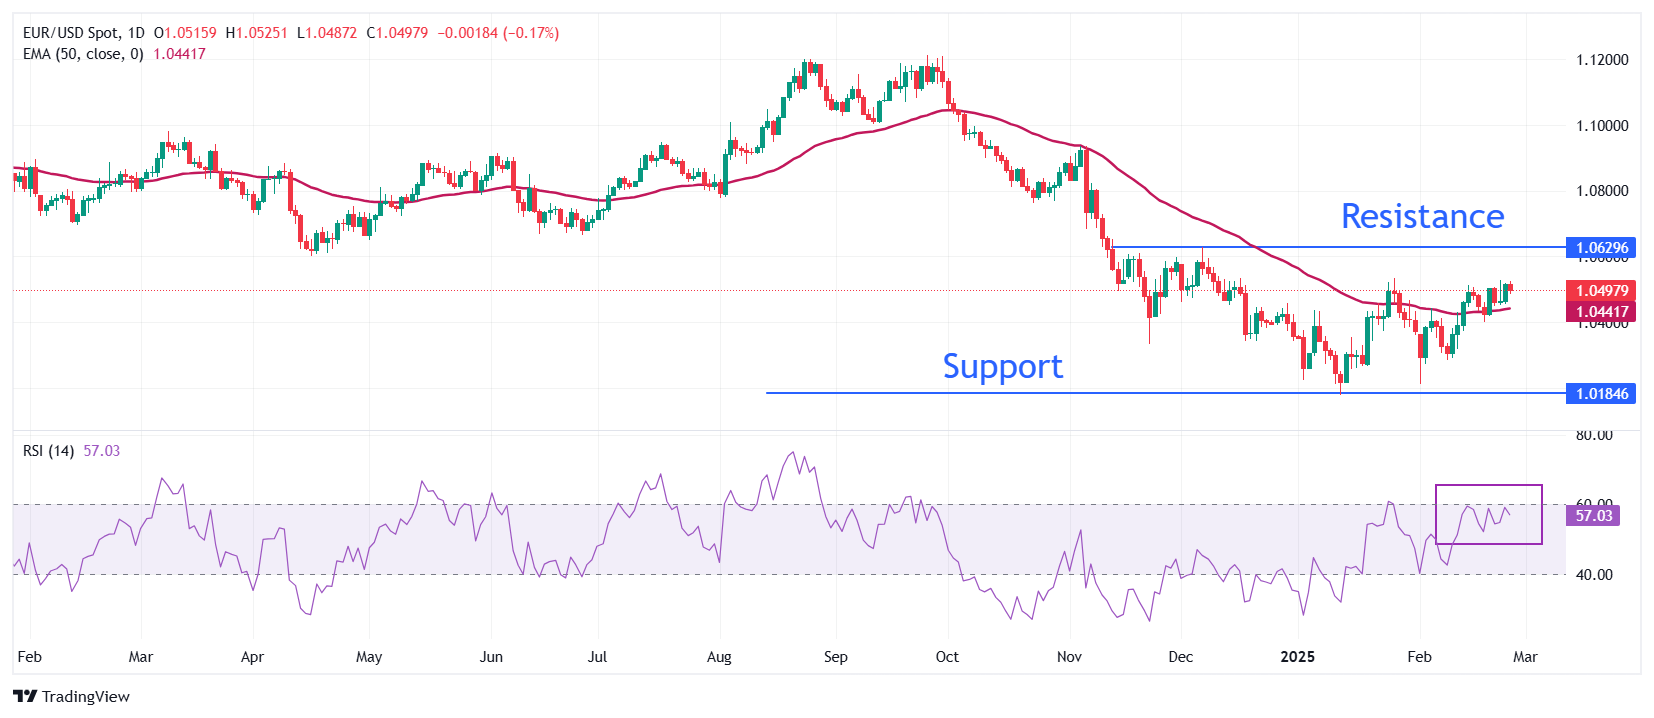
EUR/USD stays in a tight range at around 1.0500 on Wednesday. The 50-day Exponential Moving Average (EMA) continues to support the major currency pair around 1.0440.
The 14-day Relative Strength Index (RSI) wobbles just below 60.00. A bullish momentum would activate if the RSI (14) manages to sustain above that level.
Looking down, the February 10 low of 1.0285 will act as the major support zone for the pair. Conversely, the December 6 high of 1.0630 will be the key barrier for the Euro bulls.
Euro FAQs
The Euro is the currency for the 19 European Union countries that belong to the Eurozone. It is the second most heavily traded currency in the world behind the US Dollar. In 2022, it accounted for 31% of all foreign exchange transactions, with an average daily turnover of over $2.2 trillion a day. EUR/USD is the most heavily traded currency pair in the world, accounting for an estimated 30% off all transactions, followed by EUR/JPY (4%), EUR/GBP (3%) and EUR/AUD (2%).
The European Central Bank (ECB) in Frankfurt, Germany, is the reserve bank for the Eurozone. The ECB sets interest rates and manages monetary policy. The ECB’s primary mandate is to maintain price stability, which means either controlling inflation or stimulating growth. Its primary tool is the raising or lowering of interest rates. Relatively high interest rates – or the expectation of higher rates – will usually benefit the Euro and vice versa. The ECB Governing Council makes monetary policy decisions at meetings held eight times a year. Decisions are made by heads of the Eurozone national banks and six permanent members, including the President of the ECB, Christine Lagarde.
Eurozone inflation data, measured by the Harmonized Index of Consumer Prices (HICP), is an important econometric for the Euro. If inflation rises more than expected, especially if above the ECB’s 2% target, it obliges the ECB to raise interest rates to bring it back under control. Relatively high interest rates compared to its counterparts will usually benefit the Euro, as it makes the region more attractive as a place for global investors to park their money.
Data releases gauge the health of the economy and can impact on the Euro. Indicators such as GDP, Manufacturing and Services PMIs, employment, and consumer sentiment surveys can all influence the direction of the single currency. A strong economy is good for the Euro. Not only does it attract more foreign investment but it may encourage the ECB to put up interest rates, which will directly strengthen the Euro. Otherwise, if economic data is weak, the Euro is likely to fall. Economic data for the four largest economies in the euro area (Germany, France, Italy and Spain) are especially significant, as they account for 75% of the Eurozone’s economy.
Another significant data release for the Euro is the Trade Balance. This indicator measures the difference between what a country earns from its exports and what it spends on imports over a given period. If a country produces highly sought after exports then its currency will gain in value purely from the extra demand created from foreign buyers seeking to purchase these goods. Therefore, a positive net Trade Balance strengthens a currency and vice versa for a negative balance.
-
11:01
One-month skew for USD calls and CAD put options remains in favour of CAD puts – ING
And it now looks like USD/CAD is the FX market's lightning rod for the tariff story, ING’s FX analysts Chris Turner notes.
Tariffs are not merely negotiated away in Canada
"This is evident in the FX options market, where the one-month skew for USD calls and CAD put options remains high at 1.7% vols in favour of CAD puts – not far off the last January peak near 2.00% vols. Investors are clearly worried that tariffs are not merely negotiated away in Canada."
-
10:54
NZD/USD: Likely to trade in a range of 0.5715/0.5755 – UOB Group
New Zealand Dollar (NZD) is likely to trade in a range of 0.5715/0.5755. In the longer run, current price movements are likely part of a 0.5680/0.5780 range, UOB Group’s FX analysts Quek Ser Leang and Peter Chia note.
Current price movements are likely part of a range
24-HOUR VIEW: "The following are the excerpts from our update yesterday: 'Downward momentum has increased slightly. Today, NZD is likely to edge lower, but given the mild momentum, any decline is unlikely to break clearly below 0.5715.' However, NZD declined more than expected to 0.5707. Despite the decline, there has been no further increase in downward momentum. Instead, upward momentum has increased slightly, indicating that NZD is likely to trade in a higher range of 0.5715/0.5755 today."
1-3 WEEKS VIEW: "We indicated yesterday (25 Feb), when NZD was at 0.5735, that 'a breach of 0.5715 (no change in ‘strong support’ level) would indicate that 0.5790 is out of reach.' NZD then fell to a low of 0.5707. From here, we view the current price movements as part of a 0.5680/0.5780 range."
-
10:44
USD: Biding time ahead of the next tariff headlines – ING
Having been under pressure on a weak set of consumer confidence readings, the dollar has found a little support overnight on news that the House has passed a budget blueprint bill. While not detailing changes to particular spending or revenue plans, the bill is seen to pave the way for around $4tr of tax cuts – seemingly at the cost of a $2tr reduction in Medicaid spending. The bill would also seek to raise the debt ceiling by $4tr and kick the risk of a government shutdown down the road. In response, US 10-year Treasury yields are around 5bp above yesterday's lows and USD/JPY has found support under 149, ING’s FX analysts Chris Turner notes.
DXY to find support in the 106.00/106.30 area
"The return of the financial market focus on tax cuts can probably buy the dollar a little time before we return to the issue of trade. The tariff story is going to start heating up again next week as we approach the 4 March deadline for tariffs against Canada and Mexico. Recall this was the tariff threat in response to insecure borders and not the tariff threat related to steel and aluminium imports, nor the threat from reciprocal tariffs (likely coming in sometime in April)."
"Today's US data calendar is relatively quiet and merely contains January New Home Sales. On the Fed, the market is toying with Fed Funds being cut as low as 3.50% by the end of 2026 and has moved beyond pricing two 25bp Fed cuts for this year. The next important input into that pricing comes on Friday's release of the core PCE deflator for January, where a consensus 0.3% MoM reading might also put a brake on the momentum towards more Fed easing."
"We continue to expect DXY to find support in the 106.00/106.30 area and expect it to be trading back above 108 once the tariff story picks up again over the coming weeks."
-
10:35
Gold stabilizes above $2,900 after deep dive lower
- Weak US data and President Trump's tariff threats boost hopes for a Federal Reserve interest rate cut and increase haven demand.
- Gold price consolidates the prior day’s losses and is looking for support on Wednesday.
- Market sentiment tries to snap Tuesday’s negativeness and could support Gold price.
Gold’s price (XAU/USD) stabilizes and trades near $2,910 at the time of writing on Wednesday, following a 1.3% drop the previous day after markets got spooked by weak US consumer confidence data and more realistic tariff threats from President Trump’s administration. Meanwhile, United States (US) yields have plunged substantially, with markets projecting a 25 basis points (bps) rate cut in June from the Federal Reserve (Fed). This is supportive for the precious metal and should see price action bottoming out from here.
Markets are looking forward to March 4, when tariffs on Mexico and Canada are set to be enabled. Just ahead of that, the Fed’s preferred inflation gauge, the Personal Consumption Expenditures Price Index (PCE), will be released on Friday. Plenty of moving parts and elements might see traders keeping their powder dry before those events.
Daily digest market movers: March just around the corner
- Gold remained supported in recent days by weak US data that boosted hopes for a Federal Reserve interest rate cut as soon as June and President Donald Trump’s increasing tariff threats that have increased haven demand, Bloomberg reports.
- In an opinion piece from Bloomberg, Lee Baker (owner and president of Claris Financial Advisors, based in Atlanta, and a member of CNBC's Advisor Council) warned that current elevated levels in Gold are setting up markets for a harsh correction with investors willing to buy at any cost. That momentum is often seen as a greed move that usually proceeds to a broad washout, Bloomberg reports.
- The CME Fedwatch Tool sees that the chances of an interest rate cut in June only grow by the day. Currently, the tool projects a 66.2% chance of interest rates being lower than current levels compared to 33.8% for no rate cut.
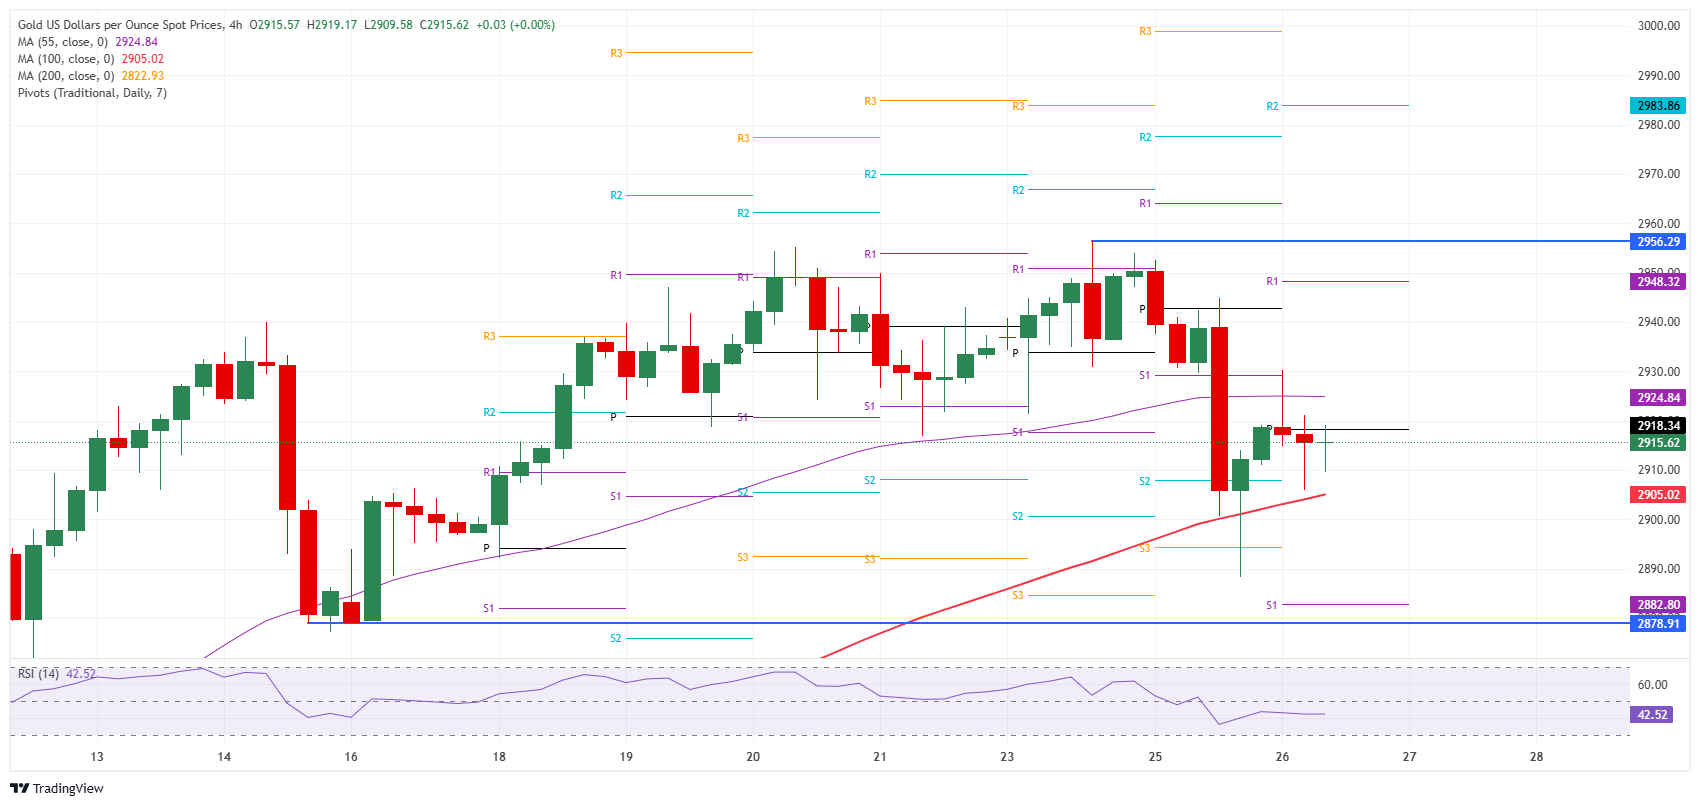
Technical Analysis: Again below pivot
For the second day in a row, Gold price trades below the daily Pivot Point. Although price action looks flat and consolidation is taking place, the risk still remains that more downside could materialize. The Relative Strength Index indicator in the 4-hour chart has room for more downside, so a drop to $2,880 could be possible if the market rout picks up again this Wednesday.
Looking up, the first level to recover is the daily Pivot Point at $2,918, which failed to provide support in the first hours of trading this Wednesday. In case Gold can get supported should US yields drop off further, the R1 resistance at $2,948 and the all-time high at $2,956 are the best levels to look for on the upside.
On the flip side, revisiting Tuesday’s low at $2,890 is a very plausible outcome. Seeing that the S1 support comes in lower at $2,882, there is really not much in the way for more downside. Further down, watch out for $2,878 (February 17 low), where some substantial support could kick in.
XAU/USD: 4-hour Chart
Gold FAQs
Gold has played a key role in human’s history as it has been widely used as a store of value and medium of exchange. Currently, apart from its shine and usage for jewelry, the precious metal is widely seen as a safe-haven asset, meaning that it is considered a good investment during turbulent times. Gold is also widely seen as a hedge against inflation and against depreciating currencies as it doesn’t rely on any specific issuer or government.
Central banks are the biggest Gold holders. In their aim to support their currencies in turbulent times, central banks tend to diversify their reserves and buy Gold to improve the perceived strength of the economy and the currency. High Gold reserves can be a source of trust for a country’s solvency. Central banks added 1,136 tonnes of Gold worth around $70 billion to their reserves in 2022, according to data from the World Gold Council. This is the highest yearly purchase since records began. Central banks from emerging economies such as China, India and Turkey are quickly increasing their Gold reserves.
Gold has an inverse correlation with the US Dollar and US Treasuries, which are both major reserve and safe-haven assets. When the Dollar depreciates, Gold tends to rise, enabling investors and central banks to diversify their assets in turbulent times. Gold is also inversely correlated with risk assets. A rally in the stock market tends to weaken Gold price, while sell-offs in riskier markets tend to favor the precious metal.
The price can move due to a wide range of factors. Geopolitical instability or fears of a deep recession can quickly make Gold price escalate due to its safe-haven status. As a yield-less asset, Gold tends to rise with lower interest rates, while higher cost of money usually weighs down on the yellow metal. Still, most moves depend on how the US Dollar (USD) behaves as the asset is priced in dollars (XAU/USD). A strong Dollar tends to keep the price of Gold controlled, whereas a weaker Dollar is likely to push Gold prices up.
-
10:30
Silver price today: Silver rises, according to FXStreet data
Silver prices (XAG/USD) rose on Wednesday, according to FXStreet data. Silver trades at $31.82 per troy ounce, up 0.48% from the $31.67 it cost on Tuesday.
Silver prices have increased by 10.12% since the beginning of the year.
Unit measure Silver Price Today in USD Troy Ounce 31.82 1 Gram 1.02
The Gold/Silver ratio, which shows the number of ounces of Silver needed to equal the value of one ounce of Gold, stood at 91.65 on Wednesday, down from 91.99 on Tuesday.
Silver FAQs
Silver is a precious metal highly traded among investors. It has been historically used as a store of value and a medium of exchange. Although less popular than Gold, traders may turn to Silver to diversify their investment portfolio, for its intrinsic value or as a potential hedge during high-inflation periods. Investors can buy physical Silver, in coins or in bars, or trade it through vehicles such as Exchange Traded Funds, which track its price on international markets.
Silver prices can move due to a wide range of factors. Geopolitical instability or fears of a deep recession can make Silver price escalate due to its safe-haven status, although to a lesser extent than Gold's. As a yieldless asset, Silver tends to rise with lower interest rates. Its moves also depend on how the US Dollar (USD) behaves as the asset is priced in dollars (XAG/USD). A strong Dollar tends to keep the price of Silver at bay, whereas a weaker Dollar is likely to propel prices up. Other factors such as investment demand, mining supply – Silver is much more abundant than Gold – and recycling rates can also affect prices.
Silver is widely used in industry, particularly in sectors such as electronics or solar energy, as it has one of the highest electric conductivity of all metals – more than Copper and Gold. A surge in demand can increase prices, while a decline tends to lower them. Dynamics in the US, Chinese and Indian economies can also contribute to price swings: for the US and particularly China, their big industrial sectors use Silver in various processes; in India, consumers’ demand for the precious metal for jewellery also plays a key role in setting prices.
Silver prices tend to follow Gold's moves. When Gold prices rise, Silver typically follows suit, as their status as safe-haven assets is similar. The Gold/Silver ratio, which shows the number of ounces of Silver needed to equal the value of one ounce of Gold, may help to determine the relative valuation between both metals. Some investors may consider a high ratio as an indicator that Silver is undervalued, or Gold is overvalued. On the contrary, a low ratio might suggest that Gold is undervalued relative to Silver.
(An automation tool was used in creating this post.)
-
10:20
Silver Price Forecast: XAG/USD edges higher toward $32.00 barrier near 14-day EMA
- Silver price may face initial resistance at the 14-day EMA near $32.12.
- Daily chart analysis suggests a growing bearish outlook, as the metal remains below the ascending channel.
- The initial support appears at the psychological level of $31.00.
Silver price (XAG/USD) halts its three-day losing streak, trading near $31.80 per troy ounce during the European session on Wednesday. Technical analysis on the daily chart indicates a developing bearish outlook, with the metal trading below the lower boundary of its ascending channel pattern.
Silver price also trades below the nine-day and 14-day Exponential Moving Averages (EMAs), signaling weakened short-term momentum. However, the 14-day Relative Strength Index (RSI) has bounced back above the 50 mark, indicating that bullish sentiment remains intact. Upcoming price action will provide clearer insight into the price’s directional trend.
To the downside, the XAG/USD pair may find initial support at the psychological level of $31.00. A decisive break below this mark could strengthen the bearish outlook, potentially pushing Silver's price toward the five-month low of $28.74, last seen on December 19.
Silver price could encounter initial resistance at the 14-day EMA around $32.12, followed by the nine-day EMA near $32.19. A move back into the ascending channel pattern would restore the bullish outlook, potentially pushing the pair toward the four-month high of $33.40. A breakout above this level would strengthen the bullish bias, opening the door for the metal price to test the ascending channel’s upper boundary near $35.00.
XAG/USD: Daily Chart
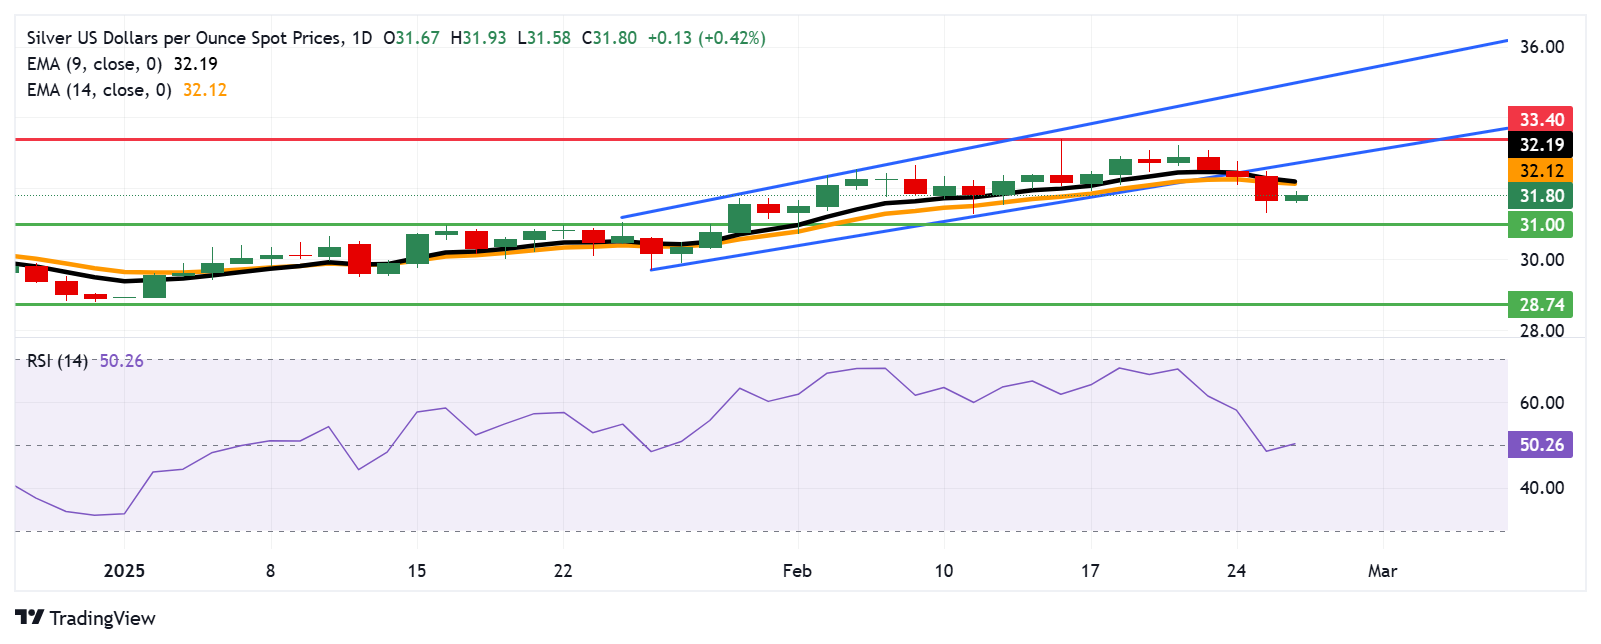
Silver FAQs
Silver is a precious metal highly traded among investors. It has been historically used as a store of value and a medium of exchange. Although less popular than Gold, traders may turn to Silver to diversify their investment portfolio, for its intrinsic value or as a potential hedge during high-inflation periods. Investors can buy physical Silver, in coins or in bars, or trade it through vehicles such as Exchange Traded Funds, which track its price on international markets.
Silver prices can move due to a wide range of factors. Geopolitical instability or fears of a deep recession can make Silver price escalate due to its safe-haven status, although to a lesser extent than Gold's. As a yieldless asset, Silver tends to rise with lower interest rates. Its moves also depend on how the US Dollar (USD) behaves as the asset is priced in dollars (XAG/USD). A strong Dollar tends to keep the price of Silver at bay, whereas a weaker Dollar is likely to propel prices up. Other factors such as investment demand, mining supply – Silver is much more abundant than Gold – and recycling rates can also affect prices.
Silver is widely used in industry, particularly in sectors such as electronics or solar energy, as it has one of the highest electric conductivity of all metals – more than Copper and Gold. A surge in demand can increase prices, while a decline tends to lower them. Dynamics in the US, Chinese and Indian economies can also contribute to price swings: for the US and particularly China, their big industrial sectors use Silver in various processes; in India, consumers’ demand for the precious metal for jewellery also plays a key role in setting prices.
Silver prices tend to follow Gold's moves. When Gold prices rise, Silver typically follows suit, as their status as safe-haven assets is similar. The Gold/Silver ratio, which shows the number of ounces of Silver needed to equal the value of one ounce of Gold, may help to determine the relative valuation between both metals. Some investors may consider a high ratio as an indicator that Silver is undervalued, or Gold is overvalued. On the contrary, a low ratio might suggest that Gold is undervalued relative to Silver.
-
10:00
Austria Purchasing Manager Index climbed from previous 45.7 to 46.7 in February
-
10:00
Switzerland ZEW Survey – Expectations down to 3.4 in February from previous 17.7
-
09:59
AUD/USD: Expected to trade in a 0.6325/0.6365 range – UOB Group
Australian Dollar (AUD) is expected to trade in a 0.6325/0.6365 range vs US Dollar (USD). In the longer run, upward momentum has largely faded; AUD is likely to consolidate between 0.6280 and 0.6410 for now, UOB Group's FX analysts Quek Ser Leang and Peter Chia note.
Upward momentum has largely faded
24-HOUR VIEW: "Yesterday, we detected 'a slight increase in downward momentum.' We expected AUD to 'edge lower,' but we indicated that 'any decline is unlikely to reach 0.6315.' Our view was correct, as AUD dipped to 0.6323, recovering to close largely unchanged at 0.6344 (-0.09%). The mild downward pressure has eased. Today, we expect AUD to trade in a 0.6325/0.6365 range."
1-3 WEEKS VIEW: "After holding a positive AUD view since early this month, we revised our view to neutral yesterday (25 Feb, spot at 0.6345). We pointed out that 'upward momentum has largely faded,' and we were of the view that AUD 'is likely to consolidate to between 0.6280 and 0.6410.' Our view remains unchanged."
-
09:55
GBP: Holding steady for the time being – ING
Pound Sterling (GBP) can start to underperform through March, but one has to be patient, ING's FX analyst Chris Turner notes.
GBP/USD might not hold onto gains in the high 1.26 area
"This week UK Prime Minister Starmer will be meeting Trump in Washington and presumably be generating some warm headlines after the UK committed to increasing defence spending by 2027. The UK is seen as a relative outperformer when it comes to a trade war and EUR/GBP risks are probably still skewed lower in the short term."
"However, we still like a lower GBP/USD and doubt it holds onto gains in the high 1.26 area."
-
09:53
Oil prices drop sharply due to deterioration in risk sentiment – Danske Bank
Oil prices dropped sharply yesterday, where Brent plunged below USD74/bbl, Danske Bank's analyst Jens Nærvig Pedersen notes.
US consumer confidence figures weigh on risk sentiment
"The drop seems to have followed a deterioration in risk sentiment that may partly owe to weaker US consumer confidence figures also released yesterday. The oil market continues to trade on a heavy note, where demand concerns amid trade war woes and weaker US key figures outweigh potential supply concerns from recent tightening of sanctions on Iran's oil export."
"The energy complex in general has been under pressure recently, where also European natural gas prices have dropped back from high levels."
-
09:51
GBP/USD does not appear to have enough momentum to reach 1.2730 – UOB Group
Room for further rebound, but Pound Sterling (GBP) does not appear to have enough momentum to reach 1.2730 vs US Dollar (USD). In the longer run, momentum is slowing; a breach of 1.2580 would indicate that 1.2730 is out of reach this time around, UOB Group's FX analysts Quek Ser Leang and Peter Chia note.
A breach of 1.2580 might indicate that 1.2730 is out of reach
24-HOUR VIEW: "GBP fell sharply from a high of 1.2690 two days ago. Yesterday, when it was at 1.2625, we highlighted that 'while the sharp drop could extend, any decline is likely to remain within a lower range of 1.2600/1.2670.' We added, 'a sustained break below 1.2600 is unlikely.' GBP then dropped to 1.2607 before rebounding to a high of 1.2678, closing at 1.2666 (+0.32%). While there is room for further rebound, GBP does not appear to have enough momentum to reach the major resistance at 1.2730. Note that there is another resistance level at 1.2700. Support is at 1.2655, followed by 1.2635."
1-3 WEEKS VIEW: "We have held a positive GBP view since the middle of the month (as annotated in the chart below). Yesterday (25 Feb, spot at 1.2625), we indicated that 'upward momentum is beginning to slow, and a breach of 1.2580 (‘strong support’ level) would indicate that 1.2730 is out of reach this time around.' There is no change in our view. Looking ahead, GBP must break clearly above 1.2730 before further advances can be expected."
-
09:35
USD/JPY drops below 149 and has further to go – Danske Bank
USD/JPY dropped below 149 yesterday, Danske Bank's FX analyst Jens Nærvig Pedersen reports.
USD/JPY is closing in a target of 147
"USD/JPY dropped below 149 yesterday in response to the sharp decline in oil prices and US bond yields that followed an overall deterioration in risk sentiment in financial markets."
"We recommended a short position in USD/JPY and the pair is closing in on our soft target of 147. Hence, the trade has performed well, but we think it has further to go."
-
09:31
USD/JPY advances to near 149.50, upside seems limited amid hawkish BoJ
- USD/JPY could encounter resistance as the likelihood of additional rate hikes by the Bank of Japan increases.
- Traders await a set of crucial Japanese economic reports due Friday, including industrial production, retail sales, and Tokyo inflation data.
- The US Dollar gains strength, driven by rising US Treasury yields.
USD/JPY retraces its recent losses from the previous session, trading around 149.40 during the European hours on Wednesday. However, the upside of the pair could be limited as the Japanese Yen (JPY) may find support amid rising odds of further interest rate hikes by the Bank of Japan (BoJ).
The BoJ is expected to raise rates from 0.50% to 0.75% this year. According to Bloomberg, overnight index swaps fully price in a rate hike by September, with a 50% chance of an earlier move as soon as June.
Meanwhile, traders in Japan are preparing for a series of key economic reports set to be released on Friday. These reports — covering industrial production, retail sales, and Tokyo inflation — could offer crucial insights into the BoJ’s future monetary policy direction.
The US Dollar (USD) strengthens amid rising US Treasury yields, with the US Dollar Index (DXY) — which measures the USD against six major currencies — approaching 106.50. At the time of writing, 2-year and 10-year US Treasury yields have climbed to 4.11% and 4.32%, respectively.
In recent developments, US President Donald Trump has ordered an investigation into potential tariffs on copper imports to support increased US production of this critical metal. Additionally, Trump confirmed that tariffs on Canada and Mexico will proceed once the current one-month delay period concludes next week.
On Tuesday, Thomas Barkin, President of the Federal Reserve Bank of Richmond, predicted another decline in Personal Consumption Expenditure (PCE) inflation later this week, emphasizing the Fed’s notable progress in curbing inflation. While maintaining an overall positive outlook, Barkin underscored the need for a cautious "wait and see" approach given ongoing policy uncertainties.
Japanese Yen FAQs
The Japanese Yen (JPY) is one of the world’s most traded currencies. Its value is broadly determined by the performance of the Japanese economy, but more specifically by the Bank of Japan’s policy, the differential between Japanese and US bond yields, or risk sentiment among traders, among other factors.
One of the Bank of Japan’s mandates is currency control, so its moves are key for the Yen. The BoJ has directly intervened in currency markets sometimes, generally to lower the value of the Yen, although it refrains from doing it often due to political concerns of its main trading partners. The BoJ ultra-loose monetary policy between 2013 and 2024 caused the Yen to depreciate against its main currency peers due to an increasing policy divergence between the Bank of Japan and other main central banks. More recently, the gradually unwinding of this ultra-loose policy has given some support to the Yen.
Over the last decade, the BoJ’s stance of sticking to ultra-loose monetary policy has led to a widening policy divergence with other central banks, particularly with the US Federal Reserve. This supported a widening of the differential between the 10-year US and Japanese bonds, which favored the US Dollar against the Japanese Yen. The BoJ decision in 2024 to gradually abandon the ultra-loose policy, coupled with interest-rate cuts in other major central banks, is narrowing this differential.
The Japanese Yen is often seen as a safe-haven investment. This means that in times of market stress, investors are more likely to put their money in the Japanese currency due to its supposed reliability and stability. Turbulent times are likely to strengthen the Yen’s value against other currencies seen as more risky to invest in.
-
09:26
EUR/USD: Upward momentum has slowed somewhat – UOB Group
Chance for Euro (EUR) to rise above 1.0530 vs US Dollar (USD); it is unclear whether it can maintain a foothold above this level. In the longer run, c, but only a breach of 1.0425 would indicate that EUR is not ready to rise above 1.0530, UOB Group's FX analysts Quek Ser Leang and Peter Chia note.
EUR has a chance to rise above 1.0530
24-HOUR VIEW: "EUR rose briefly to 1.0528 on Monday and then pulled back. Yesterday (Tuesday), we pointed out, “the price movements did not result in any increase in either downward or upward momentum.” We expected EUR to “trade in a sideways range of 1.0440/1.0495.” However, after dipping to a low of 1.0455, EUR soared and closed near a 2-1/2-month high (1.0513, +0.45%). Despite the relatively strong advance, upward momentum has not increased much. While there is a chance for EUR to rise above the major resistance at 1.0530 today, it is unclear whether it can maintain a foothold above this level. The next major at 1.0560 is unlikely to come into view. To sustain the increasing momentum, EUR must not break below 1.0480, with minor support level at 1.0495.
1-3 WEEKS VIEW: "Yesterday (25 Feb, spot at 1.0460), we noted that 'upward momentum has slowed somewhat.' We highlighted that 'only a breach of 1.0425 (‘strong support’ level) would indicate that EUR is not ready to rise above 1.0530.' While EUR subsequently rose and closed higher by 0.45% at 1.0513, there is no change in our view for now. Looking ahead, EUR has to break and remain above 1.0530 before a move to 1.0560 can be expected."
-
09:12
Pound Sterling weakens against US Dollar as Trump’s tax agenda advances
- The Pound Sterling falls to near 1.2640 against the US Dollar as the Greenback rebounds on a decent recovery in US bond yields.
- US Treasury yields bounce back as the US administration clears the $4.5 trillion tax cut plan.
- BoE’s Dhingra sees more than four interest rate cuts this year.
The Pound Sterling (GBP) declines to near 1.2640 against the US Dollar (USD) in European trading hours on Wednesday. The GBP/USD pair faces selling pressure as the US Dollar Index (DXY), which tracks the Greenback’s value against six major currencies, has shown a strong recovery move after sliding to near the 11-week low of 106.10 earlier in the day.
The Greenback bounces back strongly as bond yields gain ground after a five-day losing streak. 10-year US Treasury yields recover to near 4.33% after posting a fresh more than two-month low near 4.28% during the Asian session.
US bond yields find buyers’ interest after Republicans-controlled House of Representatives advances $4.5 trillion tax cut plan, which would also fund the deportation of migrants living in the US illegally, tighten border security, energy deregulation, and military spending, Reuters report. The injection of significant liquidity would boost inflationary pressures and force the Federal Reserve (Fed) to keep interest rates at their current levels for a prolonged period.
Meanwhile, traders have raised Fed dovish bets after weak flash United States (US) S&P Global PMI data for February showed on Friday that service sector activity contracted for the first time in over two years. According to the CME FedWatch tool, the possibility of the Fed cutting interest rates in June has increased to 65% from 47% a week ago. In the March and May policy meetings, the Fed is almost certain to keep borrowing rates steady in the range of 4.25%-4.50%.
Going forward, investors will focus on the US Durable Goods Orders and the Personal Consumption Expenditures Price Index (PCE) data for January, which will be released on Thursday and Friday, respectively. Investors will pay close attention to the US PCE inflation data as it will influence market speculation about the Fed’s monetary policy outlook.
Daily digest market movers: Pound Sterling consolidates against its major peers
- The overall performance of the Pound Sterling against its major peers is sideways on Wednesday as investors digest dovish guidance from Bank of England (BoE) Monetary Policy Committee (MPC) member Swati Dhingra in her speech at Birkbeck on Monday. Dhingra warned about “weakness in consumption” and didn’t see it going away sooner, which is why she favored the unwinding of “monetary policy restriction”.
- Traders have fully priced in two interest rate cuts by the BoE for the year. On the contrary, the commentary from Dhingra indicated that she favors more than four. "I know 'gradual' has been interpreted in the media as 25 basis points (bps) per quarter, but cutting interest rates at this pace for the remainder of 2025 would still leave monetary policy in an undesirable restrictive position at the end of the year,” Dhingra said.
- In the policy meeting earlier this month, the BoE reduced borrowing rates by 25 bps to 4.5% and guided a gradual policy easing. The BoE also halved its Gross Domestic Product (GDP) forecast for the year to 0.75% and warned that price pressures could temporarily increase in the third quarter due to higher energy prices.
- The outlook for the UK economy is uncertain due to potential tariffs from US President Donald Trump. Until now, Trump has imposed 10% tariffs on China and 25% on all steel and aluminum imports. He has also threatened to introduce reciprocal tariffs and 25% levies on all imports from Canada and Mexico, and he has proposed the same level of import duties on foreign cars, semiconductors, pharmaceuticals, and lumber and forest products.
Technical Analysis: Pound Sterling continues to face pressure near 200-day EMA
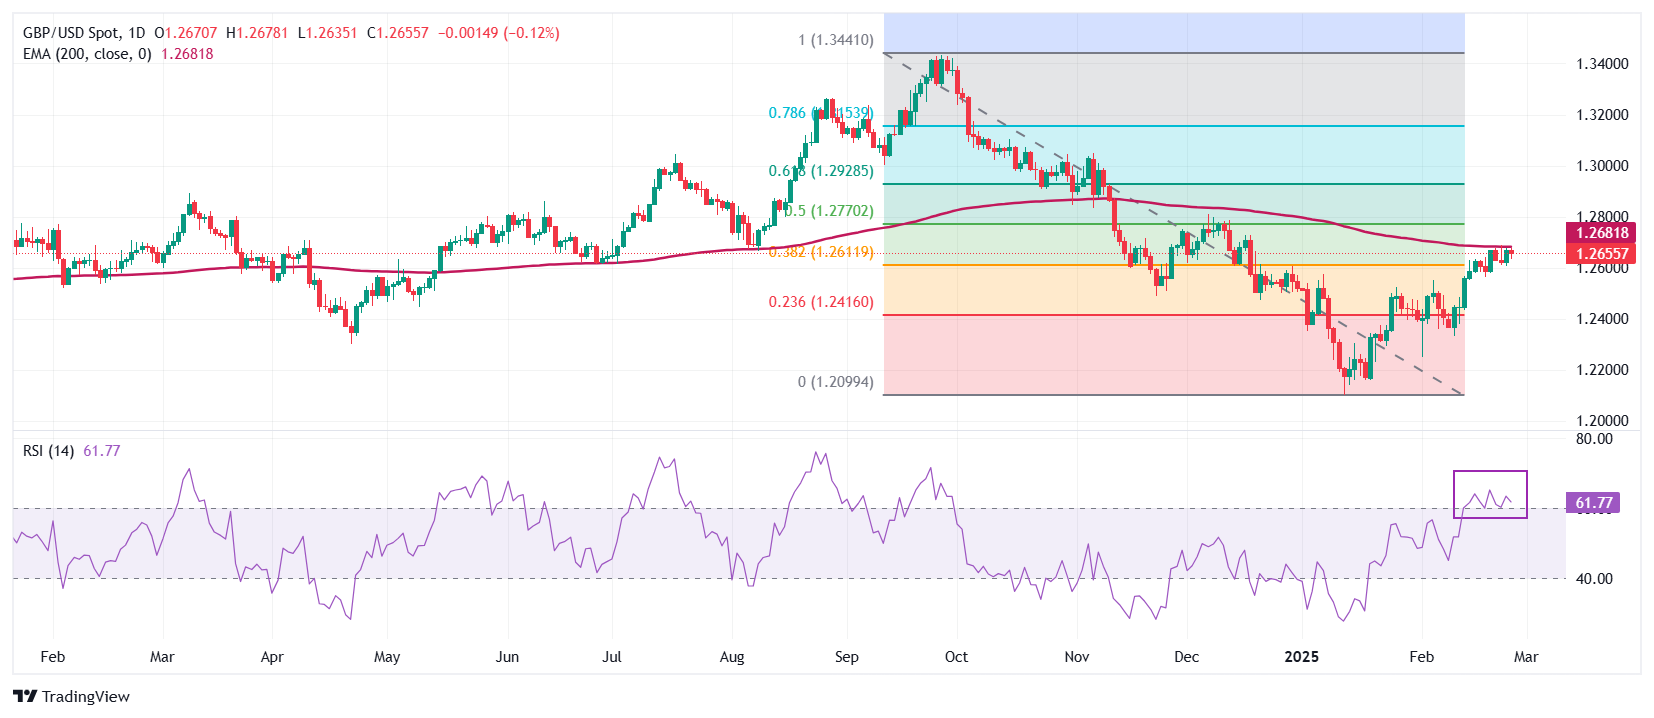
The Pound Sterling slides to near 1.2640 against the US Dollar in Wednesday’s European session. The GBP/USD pair continues to face pressure near the 200-day Exponential Moving Average (EMA), which stands at around 1.2680. The Cable holds above the 38.2% Fibonacci retracement from the end-September high to the mid-January low downtrend around 1.2620.
The 14-day Relative Strength Index (RSI) oscillates above 60.00. The bullish momentum remains intact if the RSI (14) holds above that level.
Looking down, the February 11 low of 1.2333 will act as a key support zone for the pair. On the upside, the 50% and 61.8% Fibonacci retracement at 1.2767 and 1.2927, respectively, will act as key resistance zones.
Pound Sterling FAQs
The Pound Sterling (GBP) is the oldest currency in the world (886 AD) and the official currency of the United Kingdom. It is the fourth most traded unit for foreign exchange (FX) in the world, accounting for 12% of all transactions, averaging $630 billion a day, according to 2022 data. Its key trading pairs are GBP/USD, also known as ‘Cable’, which accounts for 11% of FX, GBP/JPY, or the ‘Dragon’ as it is known by traders (3%), and EUR/GBP (2%). The Pound Sterling is issued by the Bank of England (BoE).
The single most important factor influencing the value of the Pound Sterling is monetary policy decided by the Bank of England. The BoE bases its decisions on whether it has achieved its primary goal of “price stability” – a steady inflation rate of around 2%. Its primary tool for achieving this is the adjustment of interest rates. When inflation is too high, the BoE will try to rein it in by raising interest rates, making it more expensive for people and businesses to access credit. This is generally positive for GBP, as higher interest rates make the UK a more attractive place for global investors to park their money. When inflation falls too low it is a sign economic growth is slowing. In this scenario, the BoE will consider lowering interest rates to cheapen credit so businesses will borrow more to invest in growth-generating projects.
Data releases gauge the health of the economy and can impact the value of the Pound Sterling. Indicators such as GDP, Manufacturing and Services PMIs, and employment can all influence the direction of the GBP. A strong economy is good for Sterling. Not only does it attract more foreign investment but it may encourage the BoE to put up interest rates, which will directly strengthen GBP. Otherwise, if economic data is weak, the Pound Sterling is likely to fall.
Another significant data release for the Pound Sterling is the Trade Balance. This indicator measures the difference between what a country earns from its exports and what it spends on imports over a given period. If a country produces highly sought-after exports, its currency will benefit purely from the extra demand created from foreign buyers seeking to purchase these goods. Therefore, a positive net Trade Balance strengthens a currency and vice versa for a negative balance.
-
09:11
EUR: What to make of the Ukraine mineral agreement? – ING
European currencies remain reasonably supported and are taking the Ukraine mineral agreement as a positive and very possibly some kind of move towards a US security guarantee, ING's FX analyst Chris Turner notes.
EUR/USD can be back to 1.04 and maybe lower
"The details are quite vague at this time but are being compared to the Lend-Lease agreements signed by President Roosevelt during the Second World War, where the US delivered military equipment to Europe in return for strategic military deals – such as new bases. European FX probably would get a further lift were this deal parlayed into a full US security guarantee, but that path remains very uncertain after the US foreign policy shift seen over the last month."
"EUR/USD continues to knock on the door of 1.05 and we continue to view this as the top of the trading range for the quarter. We think resistance in the 1.0530/50 area can hold and the return to the tariff story next week can drag EUR/USD back to 1.04 and maybe lower. It would be good to see EUR/USD trading sub 1.0450 to take a little pressure off the upside."
"For today, we've already seen a slight dip in German consumer confidence for March and see a whole host of consumer and business confidence readings across the region over the next couple of days."
-
09:01
South Africa Consumer Price Index (YoY) rose from previous 3% to 3.2% in January
-
09:00
South Africa Consumer Price Index (MoM) increased to 0.3% in January from previous 0.1%
-
08:51
Forex Today: US Dollar recovers modestly as markets assess latest headlines on Trump tariff policy
Here is what you need to know on Wednesday, February 26:
The US Dollar (USD) holds its ground against its rivals early Wednesday as markets adopt a cautious stance. The US economic calendar will feature New Home Sales data for January. Later in the American session, Atlanta Federal Reserve President Raphael Bostic and Richmond Federal Reserve President Thomas Barkin will be delivering speeches.
US Dollar PRICE This week
The table below shows the percentage change of US Dollar (USD) against listed major currencies this week. US Dollar was the weakest against the Swiss Franc.
USD EUR GBP JPY CAD AUD NZD CHF USD -0.32% -0.15% 0.22% 0.71% 0.43% 0.52% -0.41% EUR 0.32% 0.08% 0.38% 0.85% 0.74% 0.65% -0.26% GBP 0.15% -0.08% 0.32% 0.76% 0.68% 0.57% -0.34% JPY -0.22% -0.38% -0.32% 0.49% 0.29% 0.38% -0.53% CAD -0.71% -0.85% -0.76% -0.49% -0.33% -0.19% -1.09% AUD -0.43% -0.74% -0.68% -0.29% 0.33% -0.09% -0.99% NZD -0.52% -0.65% -0.57% -0.38% 0.19% 0.09% -0.90% CHF 0.41% 0.26% 0.34% 0.53% 1.09% 0.99% 0.90% The heat map shows percentage changes of major currencies against each other. The base currency is picked from the left column, while the quote currency is picked from the top row. For example, if you pick the US Dollar from the left column and move along the horizontal line to the Japanese Yen, the percentage change displayed in the box will represent USD (base)/JPY (quote).
Falling US Treasury bond yields after US Treasury Secretary Scott Bessen said that the Trump administration will find a way to reduce spending and ease monetary policy at the same time weighed on the USD on Tuesday. As the benchmark 10-year US T-bond yield fell more than 2% on the day, the USD Index lost about 0.4%. Early Wednesday, the 10-year yield stays in positive territory above 4.3% and the USD Index clings to recovery gains at around 106.50.
Meanwhile, US President Donald Trump's trade adviser, Peter Navarro, said that tariff negotiations are ongoing with Canada and Mexico and noted that they will set a reciprocal tariff for digital services tax. Additionally, Trump signed an executive order late Tuesday to launch an official probe into copper markets, specifically an investigation into pricing of futures and delivery markets, citing national security concerns.
EUR/USD rose more than 0.4% on Tuesday but lost its bullish momentum early Wednesday. At the time of press, the pair was trading marginally lower on the day, a few pips below 1.0500. Earlier in the day, the data from Germany showed that the GfK Consumer Confidence Index for March dropped to -24.7 from -22.6.
Following Monday's decline, GBP/USD registered small gains on Tuesday. In the European morning on Wednesday, the pair fluctuates in a tight channel at around 1.2650.
AUD/USD failed to benefit from the selling pressure surrounding the USD and closed in negative territory for the third consecutive trading day on Tuesday. The pair stays on the back foot early Wednesday and trades below 0.6350. In the Asian session, the data from Australia showed that the annual Consumer Price Index (CPI) rose 2.5% in January, matching December's increase.
USD/JPY lost nearly 0.5% on Tuesday and registered its lowest daily close since early October. The pair stages a rebound in the European morning on Wednesday and trades near 149.50.
Gold came under heavy selling pressure on Tuesday and lost more than 1% on the day. After touching its lowest level in over a week at $2,888, however, XAU/USD managed to erase a portion of its daily losses to close above $2,900. As of writing, the pair was moving up and down in a tight channel slightly above $2,910.
Risk sentiment FAQs
In the world of financial jargon the two widely used terms “risk-on” and “risk off'' refer to the level of risk that investors are willing to stomach during the period referenced. In a “risk-on” market, investors are optimistic about the future and more willing to buy risky assets. In a “risk-off” market investors start to ‘play it safe’ because they are worried about the future, and therefore buy less risky assets that are more certain of bringing a return, even if it is relatively modest.
Typically, during periods of “risk-on”, stock markets will rise, most commodities – except Gold – will also gain in value, since they benefit from a positive growth outlook. The currencies of nations that are heavy commodity exporters strengthen because of increased demand, and Cryptocurrencies rise. In a “risk-off” market, Bonds go up – especially major government Bonds – Gold shines, and safe-haven currencies such as the Japanese Yen, Swiss Franc and US Dollar all benefit.
The Australian Dollar (AUD), the Canadian Dollar (CAD), the New Zealand Dollar (NZD) and minor FX like the Ruble (RUB) and the South African Rand (ZAR), all tend to rise in markets that are “risk-on”. This is because the economies of these currencies are heavily reliant on commodity exports for growth, and commodities tend to rise in price during risk-on periods. This is because investors foresee greater demand for raw materials in the future due to heightened economic activity.
The major currencies that tend to rise during periods of “risk-off” are the US Dollar (USD), the Japanese Yen (JPY) and the Swiss Franc (CHF). The US Dollar, because it is the world’s reserve currency, and because in times of crisis investors buy US government debt, which is seen as safe because the largest economy in the world is unlikely to default. The Yen, from increased demand for Japanese government bonds, because a high proportion are held by domestic investors who are unlikely to dump them – even in a crisis. The Swiss Franc, because strict Swiss banking laws offer investors enhanced capital protection.
-
08:51
EUR/GBP holds losses near 0.8300 following German Consumer Confidence Survey
- EUR/GBP remains under pressure as Germany’s GfK Consumer Confidence Survey dropped to -24.7 for March.
- The Euro may face further headwinds with the ECB widely expected to cut interest rates next week.
- UK Prime Minister Keir Starmer has announced plans to raise defense spending to 3% of the country’s economic output.
EUR/GBP posts losses after registering gains in the previous two successive days, trading around 0.8300 during the early European hours on Wednesday. The currency cross holds losses following the release of Germany’s GfK Consumer Confidence Survey, which fell to -24.7 for March 2025, down from a slightly revised -22.6 in the prior period and below market expectations of -21.4. This represents the lowest level since April 2024, highlighting ongoing challenges for the new government, such as persistent cost pressures, political uncertainty, and a surge in corporate bankruptcies.
Traders closely monitor remarks from European Central Bank (ECB) officials ahead of next week’s policy meeting, where the ECB is widely expected to cut interest rates for the fifth consecutive time.
On Tuesday, ECB board member Isabel Schnabel argued that subdued growth should not be automatically interpreted as evidence of restrictive policy, according to a report from Reuters. Schnabel noted that "the natural rate of interest in the Euro area has increased appreciably over the past two years" and suggested that "the nature of the inflation process is likely to have changed lastingly."
ECB policymaker Martins Kazaks expressed support for continued rate cuts, emphasizing the need to approach them step by step. Meanwhile, ECB’s Joachim Nagel indicated that further rate cuts remain possible if inflation continues to ease toward the 2% target.
In the United Kingdom (UK), Prime Minister Keir Starmer has unveiled plans for a significant boost in defense spending, aiming to increase it to 3% of the nation’s economic output over the next decade, according to Bloomberg. This move comes as European governments work to strengthen their security amid uncertainty over US support under Donald Trump’s leadership.
Addressing the House of Commons on Tuesday, Starmer described the initiative as “the biggest sustained increase in defense spending since the end of the Cold War.” Ahead of his upcoming visit to Washington later this week, he confirmed that the initial funding for this increase would come from cuts to overseas development spending, with no plans to raise taxes or increase borrowing.
Economic Indicator
GfK Consumer Confidence Survey
The GfK Consumer Confidence is a leading index that measures the level of consumer confidence in economic activity. A high level of consumer confidence stimulates economic expansion while a low level drives to economic downturn. Generally speaking, a high reading is positive (or bullish) for the EUR, while a low reading is seen as negative (or bearish).
Read more.Last release: Wed Feb 26, 2025 07:00
Frequency: Monthly
Actual: -24.7
Consensus: -21
Previous: -22.4
Source: Growth from Knowledge
-
08:45
France Consumer Confidence in line with forecasts (93) in February
-
08:32
Crude oil price today: WTI price neutral, according to FXStreet data
West Texas Intermediate (WTI) Oil price is neutral on Wednesday, according to FXStreet data. WTI trades at $69.03 per barrel, not far from its Tuesday close at $69.02. Brent Oil Exchange Rate (Brent crude), however, advances from its previous close at $72.64 to trade at $72.68.
WTI Oil FAQs
WTI Oil is a type of Crude Oil sold on international markets. The WTI stands for West Texas Intermediate, one of three major types including Brent and Dubai Crude. WTI is also referred to as “light” and “sweet” because of its relatively low gravity and sulfur content respectively. It is considered a high quality Oil that is easily refined. It is sourced in the United States and distributed via the Cushing hub, which is considered “The Pipeline Crossroads of the World”. It is a benchmark for the Oil market and WTI price is frequently quoted in the media.
Like all assets, supply and demand are the key drivers of WTI Oil price. As such, global growth can be a driver of increased demand and vice versa for weak global growth. Political instability, wars, and sanctions can disrupt supply and impact prices. The decisions of OPEC, a group of major Oil-producing countries, is another key driver of price. The value of the US Dollar influences the price of WTI Crude Oil, since Oil is predominantly traded in US Dollars, thus a weaker US Dollar can make Oil more affordable and vice versa.
The weekly Oil inventory reports published by the American Petroleum Institute (API) and the Energy Information Agency (EIA) impact the price of WTI Oil. Changes in inventories reflect fluctuating supply and demand. If the data shows a drop in inventories it can indicate increased demand, pushing up Oil price. Higher inventories can reflect increased supply, pushing down prices. API’s report is published every Tuesday and EIA’s the day after. Their results are usually similar, falling within 1% of each other 75% of the time. The EIA data is considered more reliable, since it is a government agency.
OPEC (Organization of the Petroleum Exporting Countries) is a group of 12 Oil-producing nations who collectively decide production quotas for member countries at twice-yearly meetings. Their decisions often impact WTI Oil prices. When OPEC decides to lower quotas, it can tighten supply, pushing up Oil prices. When OPEC increases production, it has the opposite effect. OPEC+ refers to an expanded group that includes ten extra non-OPEC members, the most notable of which is Russia.
(An automation tool was used in creating this post.)
-
08:07
USD/CHF strengthens to near 0.8950 despite weak US economic data, tariff worries
- USD/CHF gains momentum to around 0.8950 in Wednesday’s early European session, adding 0.25% on the day.
- The cautious stance from the Fed supports the US Dollar.
- The risk-off mood and ongoing Russia-Ukraine conflicts could boost the safe-haven flows, benefiting the CHF.
The USD/CHF pair edges higher to near 0.8950, snapping the four-day losing streak on Wednesday during the early European trading hours. The US Dollar (USD) recovers from an 11-week low despite weak US economic data and tariff worries from US President Donald Trump.
The cautious stance from the US Federal Reserve (Fed) helps limit the USD’s losses. Richmond Fed President Thomas Barkin said late Tuesday that he will follow a wait-and-see approach regarding central bank interest rate policy until it is clear inflation is returning to the Fed's 2% goal. Meanwhile, Chicago Fed President Austan Goolsbee stated on Monday that the US central bank needs greater clarity before considering interest rate cuts.
However, the soft US Conference Board’s Consumer Confidence Index could weigh on investor sentiment and exert some selling pressure on the Greenback. The US Consumer Confidence Index dropped to 98.3 in February from 105.3 in January, its largest fall since August 2021. The result added to other weak data, pushing expectations toward two quarter-point interest rate cuts by the Fed this year, with the next likely coming in July, according to the CME FedWatch tool.
The uncertainty and ongoing Russia-Ukraine conflicts could boost the safe-haven currency like the Swiss Franc (CHF). Russian President Vladimir Putin said on Monday that Europe's participation in Ukraine peace talks will be needed eventually but Moscow first wants to build trust with Washington, adding that a deal to end the conflict may still be far off.Swiss Franc FAQs
The Swiss Franc (CHF) is Switzerland’s official currency. It is among the top ten most traded currencies globally, reaching volumes that well exceed the size of the Swiss economy. Its value is determined by the broad market sentiment, the country’s economic health or action taken by the Swiss National Bank (SNB), among other factors. Between 2011 and 2015, the Swiss Franc was pegged to the Euro (EUR). The peg was abruptly removed, resulting in a more than 20% increase in the Franc’s value, causing a turmoil in markets. Even though the peg isn’t in force anymore, CHF fortunes tend to be highly correlated with the Euro ones due to the high dependency of the Swiss economy on the neighboring Eurozone.
The Swiss Franc (CHF) is considered a safe-haven asset, or a currency that investors tend to buy in times of market stress. This is due to the perceived status of Switzerland in the world: a stable economy, a strong export sector, big central bank reserves or a longstanding political stance towards neutrality in global conflicts make the country’s currency a good choice for investors fleeing from risks. Turbulent times are likely to strengthen CHF value against other currencies that are seen as more risky to invest in.
The Swiss National Bank (SNB) meets four times a year – once every quarter, less than other major central banks – to decide on monetary policy. The bank aims for an annual inflation rate of less than 2%. When inflation is above target or forecasted to be above target in the foreseeable future, the bank will attempt to tame price growth by raising its policy rate. Higher interest rates are generally positive for the Swiss Franc (CHF) as they lead to higher yields, making the country a more attractive place for investors. On the contrary, lower interest rates tend to weaken CHF.
Macroeconomic data releases in Switzerland are key to assessing the state of the economy and can impact the Swiss Franc’s (CHF) valuation. The Swiss economy is broadly stable, but any sudden change in economic growth, inflation, current account or the central bank’s currency reserves have the potential to trigger moves in CHF. Generally, high economic growth, low unemployment and high confidence are good for CHF. Conversely, if economic data points to weakening momentum, CHF is likely to depreciate.
As a small and open economy, Switzerland is heavily dependent on the health of the neighboring Eurozone economies. The broader European Union is Switzerland’s main economic partner and a key political ally, so macroeconomic and monetary policy stability in the Eurozone is essential for Switzerland and, thus, for the Swiss Franc (CHF). With such dependency, some models suggest that the correlation between the fortunes of the Euro (EUR) and the CHF is more than 90%, or close to perfect.
-
08:00
Sweden Producer Price Index (YoY) up to 3.5% in January from previous 2%
-
08:00
Sweden Producer Price Index (MoM) rose from previous 0.1% to 1.7% in January
-
08:00
Germany GfK Consumer Confidence Survey below forecasts (-21) in March: Actual (-24.7)
-
07:49
USD/CAD climbs toward 1.4350 as the US Dollar strengthens, Oil prices weaken
- USD/CAD appreciates as the DXY advances toward 106.50, driven by rising US yields.
- Richmond Fed President Barkin emphasized the need for a cautious "wait and see" approach amid persistent policy uncertainties.
- The commodity-linked CAD faces headwinds due to falling crude Oil prices.
USD/CAD continues its upward momentum for the fourth straight session, trading around 1.4330 during Asian hours on Wednesday. The US Dollar (USD) strengthens amid rising US Treasury yields. The US Dollar Index (DXY), which tracks the USD against six major currencies, climbs near 106.50, with 2-year and 10-year US Treasury yields rising to 4.13% and 4.33%, respectively, at the time of writing.
On Tuesday, Thomas Barkin, President of the Federal Reserve Bank of Richmond, forecasted another decline in Personal Consumption Expenditure (PCE) inflation later this week, noting the Fed’s significant progress in managing inflation. Despite his generally positive outlook, Barkin stressed the importance of a cautious "wait and see" approach due to ongoing policy uncertainties.
The Canadian Dollar (CAD) remains under pressure following US President Donald Trump’s confirmation that tariffs on Canadian and Mexican imports will proceed as planned, despite both nations' efforts to enhance border security and combat fentanyl trafficking ahead of the March 4 deadline. Trump further claimed that the US does not need Canadian crude Oil or lumber, contradicting a long history of trade between the two countries.
Additionally, falling crude Oil prices weaken the commodity-linked CAD, given Canada’s status as the largest Oil exporter to the United States (US). West Texas Intermediate (WTI) Oil price declines to around $69.00 per barrel at the time of writing. Crude Oil prices face downward pressure due to US economic concerns and broader market uncertainty impacting the energy demand outlook. President Trump’s foreign policies further contribute to this pressure, with potential peace talks between Russia and Ukraine raising expectations of lifted Russian sanctions and increased Russian Oil exports.
Canadian Dollar FAQs
The key factors driving the Canadian Dollar (CAD) are the level of interest rates set by the Bank of Canada (BoC), the price of Oil, Canada’s largest export, the health of its economy, inflation and the Trade Balance, which is the difference between the value of Canada’s exports versus its imports. Other factors include market sentiment – whether investors are taking on more risky assets (risk-on) or seeking safe-havens (risk-off) – with risk-on being CAD-positive. As its largest trading partner, the health of the US economy is also a key factor influencing the Canadian Dollar.
The Bank of Canada (BoC) has a significant influence on the Canadian Dollar by setting the level of interest rates that banks can lend to one another. This influences the level of interest rates for everyone. The main goal of the BoC is to maintain inflation at 1-3% by adjusting interest rates up or down. Relatively higher interest rates tend to be positive for the CAD. The Bank of Canada can also use quantitative easing and tightening to influence credit conditions, with the former CAD-negative and the latter CAD-positive.
The price of Oil is a key factor impacting the value of the Canadian Dollar. Petroleum is Canada’s biggest export, so Oil price tends to have an immediate impact on the CAD value. Generally, if Oil price rises CAD also goes up, as aggregate demand for the currency increases. The opposite is the case if the price of Oil falls. Higher Oil prices also tend to result in a greater likelihood of a positive Trade Balance, which is also supportive of the CAD.
While inflation had always traditionally been thought of as a negative factor for a currency since it lowers the value of money, the opposite has actually been the case in modern times with the relaxation of cross-border capital controls. Higher inflation tends to lead central banks to put up interest rates which attracts more capital inflows from global investors seeking a lucrative place to keep their money. This increases demand for the local currency, which in Canada’s case is the Canadian Dollar.
Macroeconomic data releases gauge the health of the economy and can have an impact on the Canadian Dollar. Indicators such as GDP, Manufacturing and Services PMIs, employment, and consumer sentiment surveys can all influence the direction of the CAD. A strong economy is good for the Canadian Dollar. Not only does it attract more foreign investment but it may encourage the Bank of Canada to put up interest rates, leading to a stronger currency. If economic data is weak, however, the CAD is likely to fall.
-
07:16
EUR/JPY gathers strength to near 157.00 as Germany considers to boost defence spending
- EUR/JPY gains ground to around 156.95 in Wednesday’s early European session.
- The Euro found support from growing optimism following reports that Germany is considering a €200 billion emergency defense fund.
- The prospect that the BoJ would raise interest rates further supports the JPY.
The EUR/JPY cross gathers strength to near 156.95 during the early European trading hours on Wednesday. Growing optimism around increased fiscal spending in Germany provides some support to the Euro (EUR).
According to a source familiar with the discussions, Germany's chancellor-in-waiting, Friedrich Merz, has begun conversations with the Social Democrats to quickly approve up to €200 billion ($210 billion) in special defense spending.
The remarks from the European Central Bank (ECB) officials will be closely watched ahead of the policy meeting next week. ECB policymaker Joachim Nagel said on Tuesday that the central bank has room to cut its interest rates further if inflation eases to its 2% target this year as it expects. Meanwhile, ECB board member Isabel Schnabel noted the ECB may be approaching a point where it needs to pause or halt rate reductions.
The ECB is widely expected to cut rates for a fifth straight time next week after seeing inflation fall from double digits to just over 2% in recent months. This might drag the shared currency lower against the Japanese Yen (JPY).
The Bank of Japan (BoJ) is expected to raise the interest rate from 0.50% to 0.75% this year, which could influence investor sentiment and underpin the JPY. "The market has interpreted this as the government tacitly accepting the rise in domestic interest rates, fueling speculation the BOJ might raise rates sooner than expected," said Yuzo Sakai, chief manager of business planning at Ueda Totan Forex Ltd.Euro FAQs
The Euro is the currency for the 19 European Union countries that belong to the Eurozone. It is the second most heavily traded currency in the world behind the US Dollar. In 2022, it accounted for 31% of all foreign exchange transactions, with an average daily turnover of over $2.2 trillion a day. EUR/USD is the most heavily traded currency pair in the world, accounting for an estimated 30% off all transactions, followed by EUR/JPY (4%), EUR/GBP (3%) and EUR/AUD (2%).
The European Central Bank (ECB) in Frankfurt, Germany, is the reserve bank for the Eurozone. The ECB sets interest rates and manages monetary policy. The ECB’s primary mandate is to maintain price stability, which means either controlling inflation or stimulating growth. Its primary tool is the raising or lowering of interest rates. Relatively high interest rates – or the expectation of higher rates – will usually benefit the Euro and vice versa. The ECB Governing Council makes monetary policy decisions at meetings held eight times a year. Decisions are made by heads of the Eurozone national banks and six permanent members, including the President of the ECB, Christine Lagarde.
Eurozone inflation data, measured by the Harmonized Index of Consumer Prices (HICP), is an important econometric for the Euro. If inflation rises more than expected, especially if above the ECB’s 2% target, it obliges the ECB to raise interest rates to bring it back under control. Relatively high interest rates compared to its counterparts will usually benefit the Euro, as it makes the region more attractive as a place for global investors to park their money.
Data releases gauge the health of the economy and can impact on the Euro. Indicators such as GDP, Manufacturing and Services PMIs, employment, and consumer sentiment surveys can all influence the direction of the single currency. A strong economy is good for the Euro. Not only does it attract more foreign investment but it may encourage the ECB to put up interest rates, which will directly strengthen the Euro. Otherwise, if economic data is weak, the Euro is likely to fall. Economic data for the four largest economies in the euro area (Germany, France, Italy and Spain) are especially significant, as they account for 75% of the Eurozone’s economy.
Another significant data release for the Euro is the Trade Balance. This indicator measures the difference between what a country earns from its exports and what it spends on imports over a given period. If a country produces highly sought after exports then its currency will gain in value purely from the extra demand created from foreign buyers seeking to purchase these goods. Therefore, a positive net Trade Balance strengthens a currency and vice versa for a negative balance.
-
06:59
FX option expiries for Feb 26 NY cut
FX option expiries for Feb 26 NY cut at 10:00 Eastern Time via DTCC can be found below.
EUR/USD: EUR amounts
- 1.0350 1.2b
- 1.0400 2b
- 1.0420 1.1b
- 1.0430 2b
- 1.0450 3.2b
- 1.0500 2b
- 1.0515 1b
- 1.0520 1.2b
- 1.0525 2b
- 1.0530 2b
- 1.0550 2.4b
- 1.0600 3.6b
GBP/USD: GBP amounts
- 1.2450 456m
- 1.2500 588m
- 1.2675 773m
USD/JPY: USD amounts
- 149.00 1b
- 150.00 1.9b
- 151.00 1.5b
USD/CHF: USD amounts
- 0.8955 1.1b
AUD/USD: AUD amounts
- 0.6325 581m
- 0.6400 1.1b
USD/CAD: USD amounts
- 1.4200 695m
- 1.4300 1.2b
- 1.4390 579m
- 1.4400 918m
-
06:23
US Dollar Price Forecast: Remains capped below the 100-period EMA near 106.50
- The US Dollar Index recovers to near 106.50 in Wednesday’s early European session.
- The bearish outlook of the DXY remains intact below the 100-period EMA.
- The first downside target to watch is 106.20; the immediate resistance level emerges at 106.85.
The US Dollar Index (DXY) rebounds to around 106.50 during the early European session on Wednesday. Analysts expect that US President Donald Trump’s plans for higher tariffs have raised inflation worries at the US Federal Reserve (Fed), which might lead the Fed to keep interest rates higher for longer. This might support the US Dollar against its rivals.
Investors await the US Personal Consumption Expenditures (PCE) data, the Fed's preferred inflation gauge, on Friday for fresh impetus. This report might offer some hints about the US interest rate path.
Technically, the DXY keeps the bearish vibe on the 4-hour chart as the index remains capped below the key 100-period Exponential Moving Average (EMA). Additionally, the Relative Strength Index (RSI) stands below the 50-midline near 46.40, indicating that further downside cannot be ruled out in the near term.
The lower limit of the Bollinger Band at 106.20 acts as an initial support level for the US Dollar Index. A breach of this level could expose the 105.41, the low of December 6, 2024. The next contention level to watch is 104.19, the low of November 7, 2024.
On the bright side, the first upside barrier is located at 106.85, the upper boundary of the Bollinger Band. Extended gains could pave the way to the 107.15, the 100-period EMA. The next hurdle is seen at the 108.00 psychological level.US Dollar (DXY) 4-hour chart
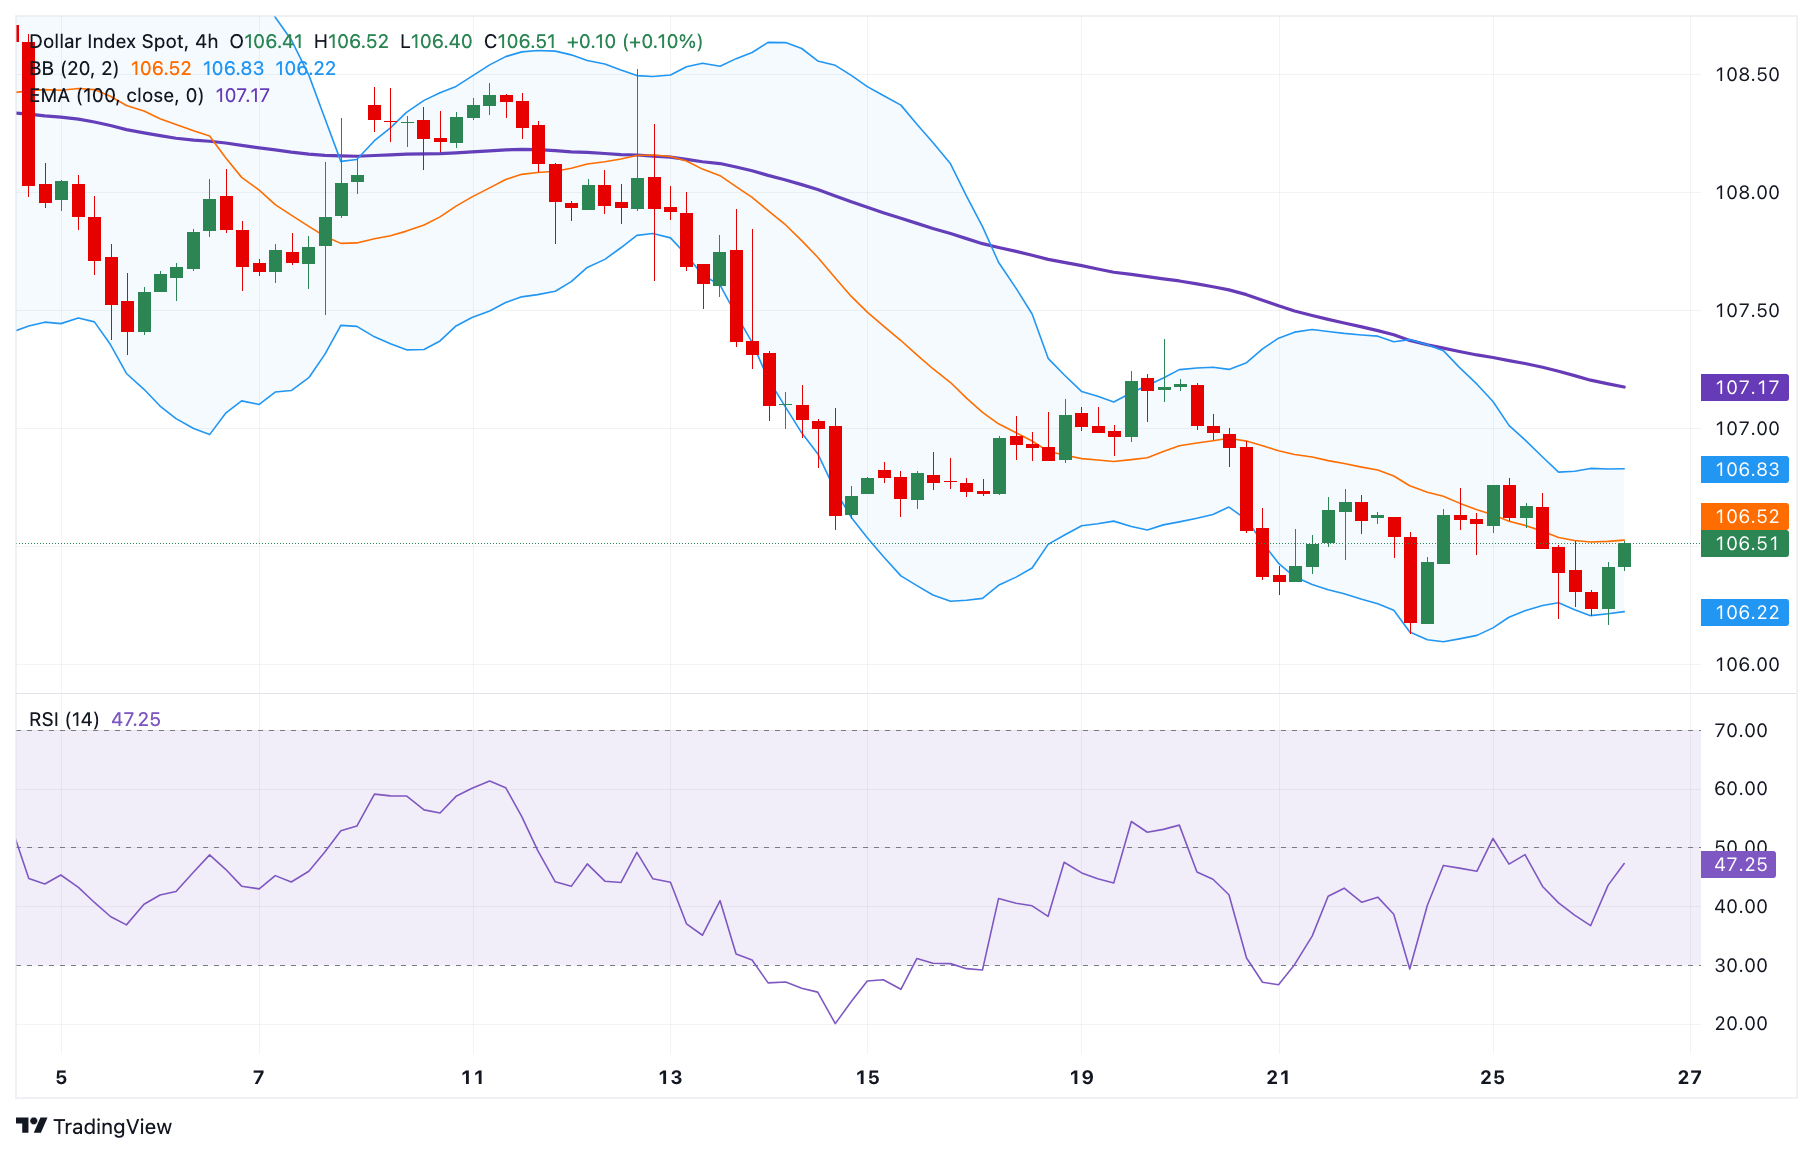
US Dollar FAQs
The US Dollar (USD) is the official currency of the United States of America, and the ‘de facto’ currency of a significant number of other countries where it is found in circulation alongside local notes. It is the most heavily traded currency in the world, accounting for over 88% of all global foreign exchange turnover, or an average of $6.6 trillion in transactions per day, according to data from 2022. Following the second world war, the USD took over from the British Pound as the world’s reserve currency. For most of its history, the US Dollar was backed by Gold, until the Bretton Woods Agreement in 1971 when the Gold Standard went away.
The most important single factor impacting on the value of the US Dollar is monetary policy, which is shaped by the Federal Reserve (Fed). The Fed has two mandates: to achieve price stability (control inflation) and foster full employment. Its primary tool to achieve these two goals is by adjusting interest rates. When prices are rising too quickly and inflation is above the Fed’s 2% target, the Fed will raise rates, which helps the USD value. When inflation falls below 2% or the Unemployment Rate is too high, the Fed may lower interest rates, which weighs on the Greenback.
In extreme situations, the Federal Reserve can also print more Dollars and enact quantitative easing (QE). QE is the process by which the Fed substantially increases the flow of credit in a stuck financial system. It is a non-standard policy measure used when credit has dried up because banks will not lend to each other (out of the fear of counterparty default). It is a last resort when simply lowering interest rates is unlikely to achieve the necessary result. It was the Fed’s weapon of choice to combat the credit crunch that occurred during the Great Financial Crisis in 2008. It involves the Fed printing more Dollars and using them to buy US government bonds predominantly from financial institutions. QE usually leads to a weaker US Dollar.
Quantitative tightening (QT) is the reverse process whereby the Federal Reserve stops buying bonds from financial institutions and does not reinvest the principal from the bonds it holds maturing in new purchases. It is usually positive for the US Dollar.
-
06:01
Japan Leading Economic Index below expectations (108.9) in December: Actual (108.3)
-
06:00
Japan Coincident Index dipped from previous 116.8 to 116.4 in December
-
06:00
Singapore Industrial Production (MoM) above forecasts (-3.4%) in January: Actual (4.5%)
-
06:00
Singapore Industrial Production (YoY) above forecasts (9%) in January: Actual (9.1%)
-
05:43
EUR/USD depreciates to near 1.0500 as US Dollar strengthens, supported by rising yields
- EUR/USD slips as the DXY climbs toward 106.50, driven by rising US yields.
- The US Dollar faced headwinds due to weakening US consumer confidence.
- The Euro found support from growing optimism following reports that Germany considers a €200 billion emergency defense fund.
EUR/USD retraces its recent gains registered in the previous session, trading around 1.0500 during the Asian hours on Wednesday. The currency pair loses ground as the US Dollar (USD) appreciates amid improving US Treasury yields.
The US Dollar Index (DXY), which measures the USD against six major currencies, rises to near 106.50 with 2-year and 10-year yields on US Treasury bonds improving to 4.12% and 4.32%, respectively, at the time of writing.
However, weakening US economic data put pressure on the Greenback. The Conference Board’s consumer confidence index fell by 7 points in February to 98.3, marking its third consecutive decline, according to data released on Tuesday.
Meanwhile, Federal Reserve (Fed) Bank of Richmond President Thomas Barkin predicted another drop in Personal Consumption Expenditure (PCE) inflation later this week, highlighting the Fed’s significant progress in controlling inflation. Despite his generally optimistic outlook, Barkin emphasized the need for a "wait and see" approach amid ongoing policy uncertainty.
The EUR/USD pair gained traction as the Euro found support from growing optimism around increased fiscal spending in Germany, following reports that Europe’s largest economy is considering a €200 billion emergency defense fund.
Adding to the bullish sentiment, Frederich Merz, leader of the Christian Democratic Union (CDU) and Germany’s soon-to-be chancellor, has not ruled out the possibility of reforming the debt brake to finance key initiatives such as tax relief, lower energy prices, and a significant boost in military spending.
Meanwhile, investors closely monitored remarks from European Central Bank (ECB) officials ahead of next week’s policy meeting, where the ECB is widely expected to cut interest rates for the fifth time in a row. ECB policymaker Joachim Nagel suggested that further rate cuts remain possible if inflation continues to ease toward the 2% target. However, his colleague Isabel Schnabel cautioned that the ECB may be approaching a point where it needs to pause or halt rate reductions.
Euro FAQs
The Euro is the currency for the 19 European Union countries that belong to the Eurozone. It is the second most heavily traded currency in the world behind the US Dollar. In 2022, it accounted for 31% of all foreign exchange transactions, with an average daily turnover of over $2.2 trillion a day. EUR/USD is the most heavily traded currency pair in the world, accounting for an estimated 30% off all transactions, followed by EUR/JPY (4%), EUR/GBP (3%) and EUR/AUD (2%).
The European Central Bank (ECB) in Frankfurt, Germany, is the reserve bank for the Eurozone. The ECB sets interest rates and manages monetary policy. The ECB’s primary mandate is to maintain price stability, which means either controlling inflation or stimulating growth. Its primary tool is the raising or lowering of interest rates. Relatively high interest rates – or the expectation of higher rates – will usually benefit the Euro and vice versa. The ECB Governing Council makes monetary policy decisions at meetings held eight times a year. Decisions are made by heads of the Eurozone national banks and six permanent members, including the President of the ECB, Christine Lagarde.
Eurozone inflation data, measured by the Harmonized Index of Consumer Prices (HICP), is an important econometric for the Euro. If inflation rises more than expected, especially if above the ECB’s 2% target, it obliges the ECB to raise interest rates to bring it back under control. Relatively high interest rates compared to its counterparts will usually benefit the Euro, as it makes the region more attractive as a place for global investors to park their money.
Data releases gauge the health of the economy and can impact on the Euro. Indicators such as GDP, Manufacturing and Services PMIs, employment, and consumer sentiment surveys can all influence the direction of the single currency. A strong economy is good for the Euro. Not only does it attract more foreign investment but it may encourage the ECB to put up interest rates, which will directly strengthen the Euro. Otherwise, if economic data is weak, the Euro is likely to fall. Economic data for the four largest economies in the euro area (Germany, France, Italy and Spain) are especially significant, as they account for 75% of the Eurozone’s economy.
Another significant data release for the Euro is the Trade Balance. This indicator measures the difference between what a country earns from its exports and what it spends on imports over a given period. If a country produces highly sought after exports then its currency will gain in value purely from the extra demand created from foreign buyers seeking to purchase these goods. Therefore, a positive net Trade Balance strengthens a currency and vice versa for a negative balance.
-
05:35
India Gold price today: Gold steadies, according to FXStreet data
Gold prices remained broadly unchanged in India on Wednesday, according to data compiled by FXStreet.
The price for Gold stood at 8,171.53 Indian Rupees (INR) per gram, broadly stable compared with the INR 8,163.88 it cost on Tuesday.
The price for Gold was broadly steady at INR 95,311.41 per tola from INR 95,221.84 per tola a day earlier.
Unit measure Gold Price in INR 1 Gram 8,171.53 10 Grams 81,715.55 Tola 95,311.41 Troy Ounce 254,166.60 FXStreet calculates Gold prices in India by adapting international prices (USD/INR) to the local currency and measurement units. Prices are updated daily based on the market rates taken at the time of publication. Prices are just for reference and local rates could diverge slightly.
Gold FAQs
Gold has played a key role in human’s history as it has been widely used as a store of value and medium of exchange. Currently, apart from its shine and usage for jewelry, the precious metal is widely seen as a safe-haven asset, meaning that it is considered a good investment during turbulent times. Gold is also widely seen as a hedge against inflation and against depreciating currencies as it doesn’t rely on any specific issuer or government.
Central banks are the biggest Gold holders. In their aim to support their currencies in turbulent times, central banks tend to diversify their reserves and buy Gold to improve the perceived strength of the economy and the currency. High Gold reserves can be a source of trust for a country’s solvency. Central banks added 1,136 tonnes of Gold worth around $70 billion to their reserves in 2022, according to data from the World Gold Council. This is the highest yearly purchase since records began. Central banks from emerging economies such as China, India and Turkey are quickly increasing their Gold reserves.
Gold has an inverse correlation with the US Dollar and US Treasuries, which are both major reserve and safe-haven assets. When the Dollar depreciates, Gold tends to rise, enabling investors and central banks to diversify their assets in turbulent times. Gold is also inversely correlated with risk assets. A rally in the stock market tends to weaken Gold price, while sell-offs in riskier markets tend to favor the precious metal.
The price can move due to a wide range of factors. Geopolitical instability or fears of a deep recession can quickly make Gold price escalate due to its safe-haven status. As a yield-less asset, Gold tends to rise with lower interest rates, while higher cost of money usually weighs down on the yellow metal. Still, most moves depend on how the US Dollar (USD) behaves as the asset is priced in dollars (XAU/USD). A strong Dollar tends to keep the price of Gold controlled, whereas a weaker Dollar is likely to push Gold prices up.
(An automation tool was used in creating this post.)
-
05:19
Silver Price Forecast: XAG/USD keeps the bullish vibe above $31.50
- Silver price edges higher to near $31.75 in Wednesday’s Asian session, adding 0.35% on the day.
- The positive view of Silver prevails above the key 100-day EMA with the bullish RSI indicator.
- The immediate resistance level emerges at $33.00; the first downside target to watch is 31.25.
Silver price (XAG/USD) attracts some buyers to around $31.75, snapping the three-day losing streak during the Asian trading hours on Wednesday. The uncertainty and worries about US President Donald Trump's tariffs boost the Silver price, a safe-haven asset.
Technically, the bullish trend of Silver remains in place as the commodity is well-supported above the key 100-day Exponential Moving Average (EMA) on the daily chart. However, further consolidation cannot be ruled out as the 14-day Relative Strength Index (RSI) hovers around the midline near 50.0, displaying a neutral momentum in the near term.
The first upside target for white metal emerges at $33.00, representing the psychological level and the upper boundary of the Bollinger Band. Any follow-through buying above this level could pave the way to $33.40, the high of February 14. Further north, the next hurdle to watch is 34.55, the high of October 29, 2024.
On the flip side, the initial support level for Silver price is seen at 31.25, the lower limit of the Bollinger Band. Sustained trading below the mentioned level could see a drop to the key contention level at $31.00, the round mark and the 100-day EMA. The additional downside filter to watch is $29.70, the low of January 27.Silver price (XAG/USD) Daily Chart
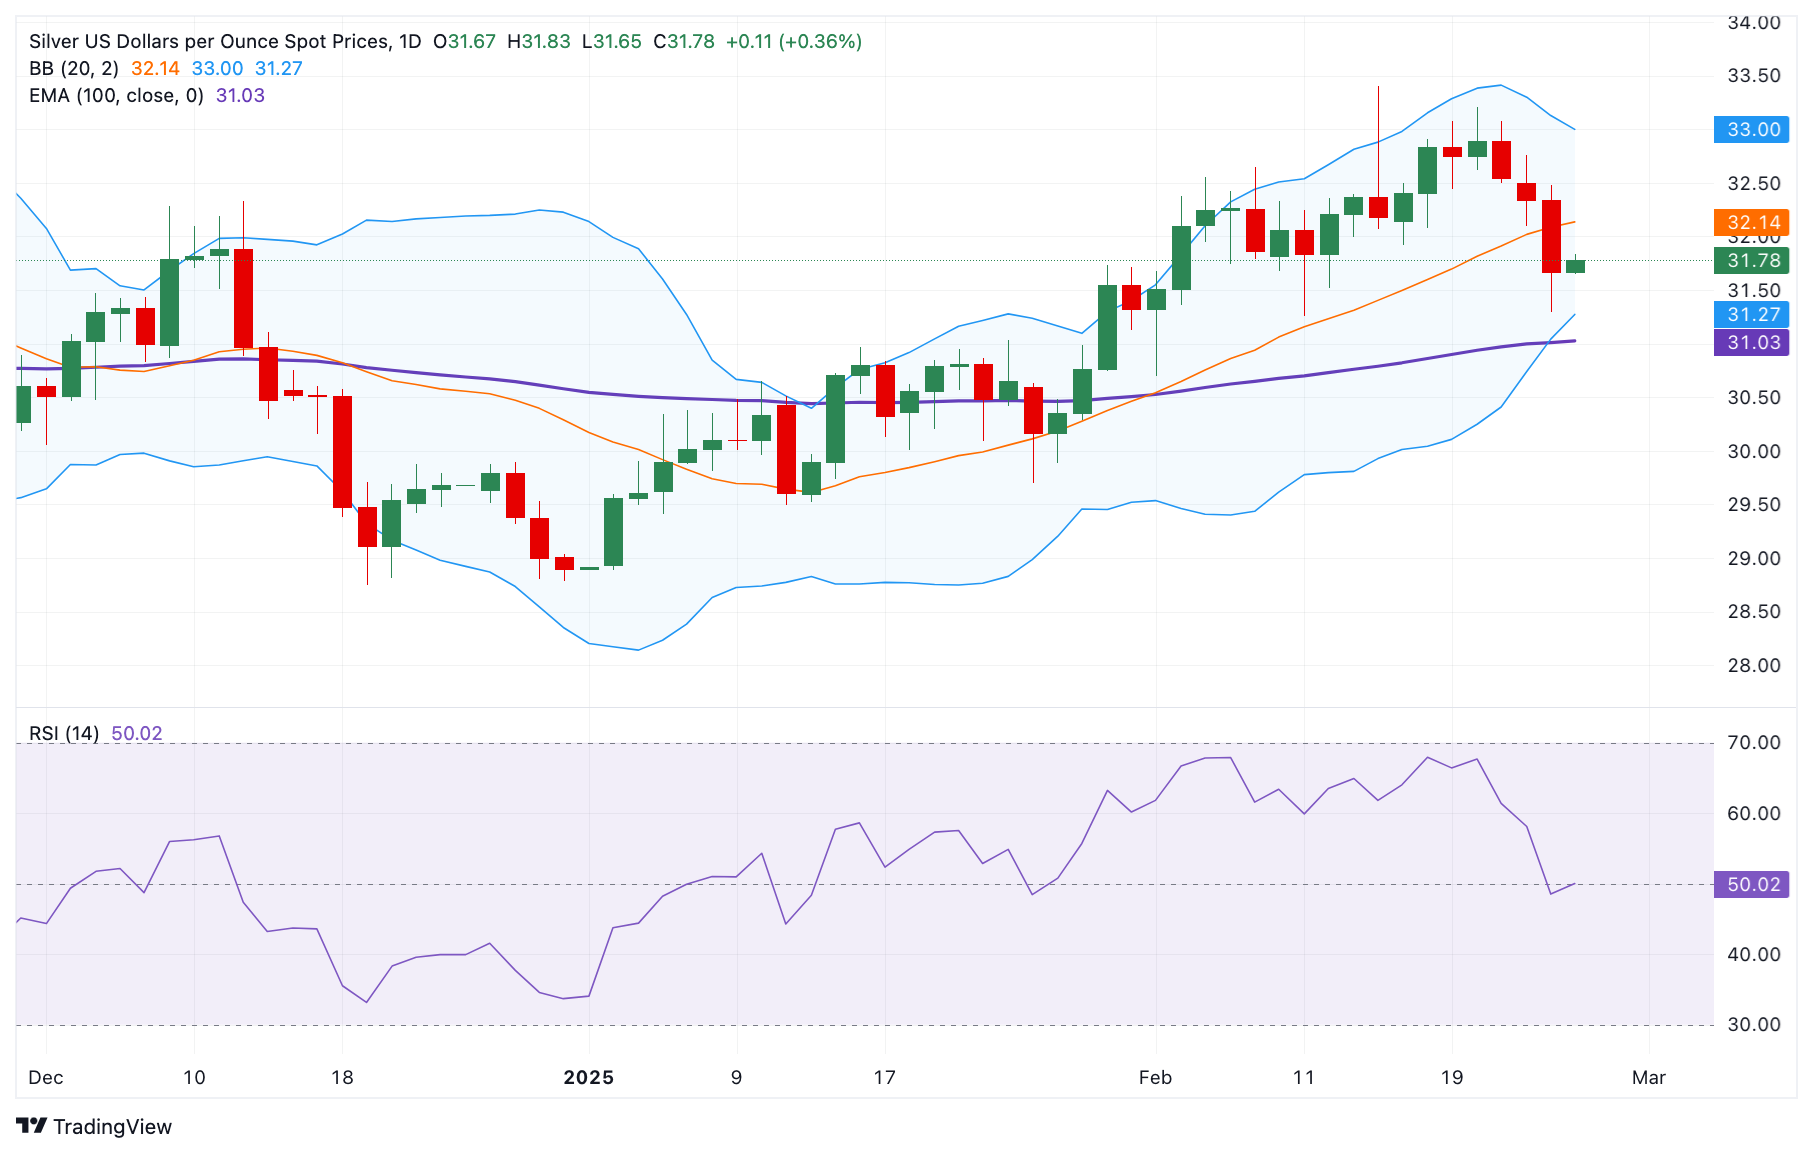
Silver FAQs
Silver is a precious metal highly traded among investors. It has been historically used as a store of value and a medium of exchange. Although less popular than Gold, traders may turn to Silver to diversify their investment portfolio, for its intrinsic value or as a potential hedge during high-inflation periods. Investors can buy physical Silver, in coins or in bars, or trade it through vehicles such as Exchange Traded Funds, which track its price on international markets.
Silver prices can move due to a wide range of factors. Geopolitical instability or fears of a deep recession can make Silver price escalate due to its safe-haven status, although to a lesser extent than Gold's. As a yieldless asset, Silver tends to rise with lower interest rates. Its moves also depend on how the US Dollar (USD) behaves as the asset is priced in dollars (XAG/USD). A strong Dollar tends to keep the price of Silver at bay, whereas a weaker Dollar is likely to propel prices up. Other factors such as investment demand, mining supply – Silver is much more abundant than Gold – and recycling rates can also affect prices.
Silver is widely used in industry, particularly in sectors such as electronics or solar energy, as it has one of the highest electric conductivity of all metals – more than Copper and Gold. A surge in demand can increase prices, while a decline tends to lower them. Dynamics in the US, Chinese and Indian economies can also contribute to price swings: for the US and particularly China, their big industrial sectors use Silver in various processes; in India, consumers’ demand for the precious metal for jewellery also plays a key role in setting prices.
Silver prices tend to follow Gold's moves. When Gold prices rise, Silver typically follows suit, as their status as safe-haven assets is similar. The Gold/Silver ratio, which shows the number of ounces of Silver needed to equal the value of one ounce of Gold, may help to determine the relative valuation between both metals. Some investors may consider a high ratio as an indicator that Silver is undervalued, or Gold is overvalued. On the contrary, a low ratio might suggest that Gold is undervalued relative to Silver.
-
04:57
GBP/USD Price Forecast: Tests 1.2650 support near nine-day EMA
- The GBP/USD pair could target the nine-day EMA support at 1.2613.
- The 14-day RSI remains above the 50 level, indicating sustained bullish momentum.
- The initial resistance appears at the two-month high of 1.2690.
The GBP/USD pair gives up part of its recent gains from the prior session, hovering around 1.2650 during Wednesday’s Asian session. Despite this pullback, technical analysis of the daily chart indicates a sustained bullish outlook, as the pair remains within an ascending channel pattern.
The 14-day Relative Strength Index (RSI) stays above the 50 mark, reflecting strengthened bullish momentum. Additionally, the pair continues to trade above the nine- and 14-day Exponential Moving Averages (EMAs), highlighting robust short-term price dynamics and confirming the prevailing upward trend.
The GBP/USD pair faces immediate resistance at the two-month high of 1.2690, reached on February 24, followed by the ascending channel’s upper boundary around the 1.2750 level. A decisive break above this level could strengthen the bullish outlook, paving the way for a test of the three-month high at 1.2811, last seen on December 6.
On the downside, the GBP/USD pair may find immediate support at the nine-day EMA of 1.2613, followed by the 14-day EMA at 1.2581. A break below these levels could undermine short-term price momentum, pushing the pair toward the ascending channel’s lower boundary around the 1.2500 mark.
GBP/USD: Daily Chart
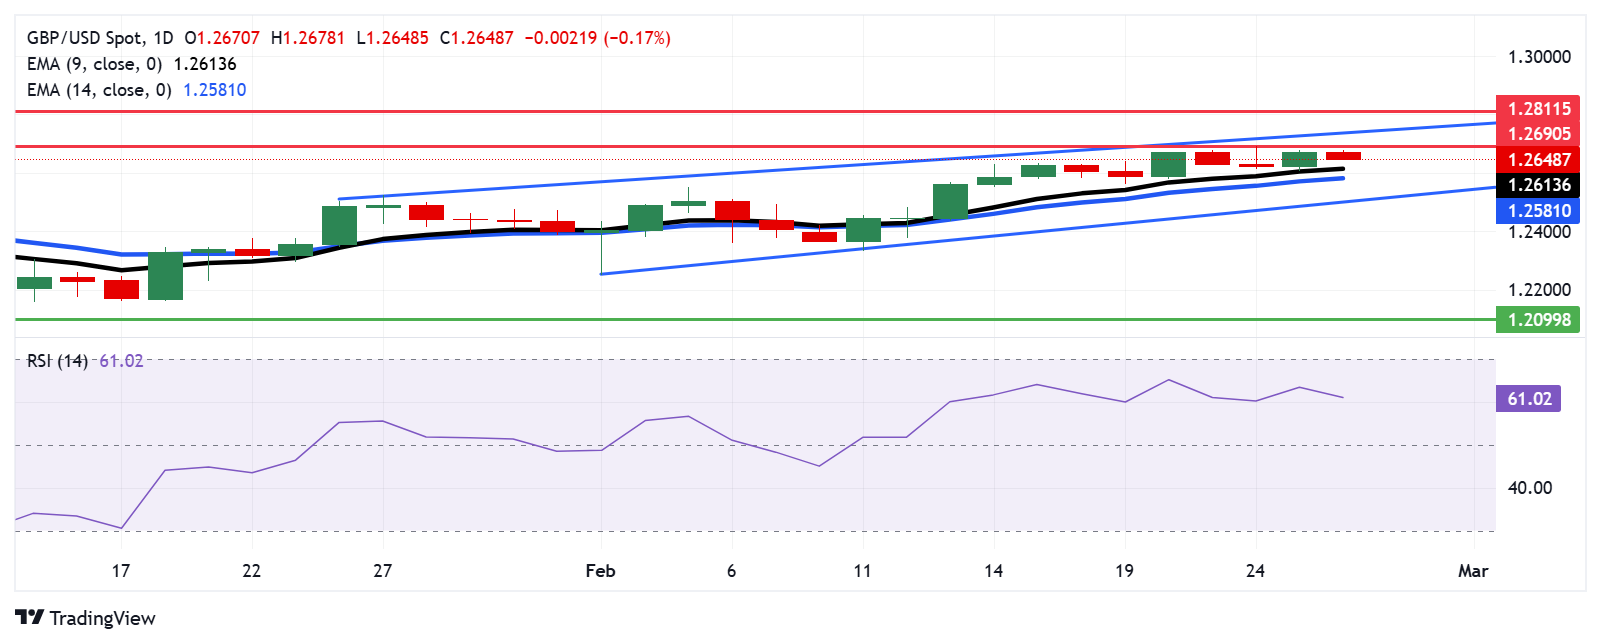
British Pound PRICE Today
The table below shows the percentage change of British Pound (GBP) against listed major currencies today. British Pound was the weakest against the US Dollar.
USD EUR GBP JPY CAD AUD NZD CHF USD 0.11% 0.17% 0.30% 0.08% 0.26% 0.19% 0.10% EUR -0.11% 0.06% 0.19% -0.03% 0.14% 0.08% -0.01% GBP -0.17% -0.06% 0.11% -0.08% 0.09% 0.03% -0.06% JPY -0.30% -0.19% -0.11% -0.21% -0.04% -0.11% -0.18% CAD -0.08% 0.03% 0.08% 0.21% 0.17% 0.10% 0.03% AUD -0.26% -0.14% -0.09% 0.04% -0.17% -0.06% -0.14% NZD -0.19% -0.08% -0.03% 0.11% -0.10% 0.06% -0.08% CHF -0.10% 0.01% 0.06% 0.18% -0.03% 0.14% 0.08% The heat map shows percentage changes of major currencies against each other. The base currency is picked from the left column, while the quote currency is picked from the top row. For example, if you pick the British Pound from the left column and move along the horizontal line to the US Dollar, the percentage change displayed in the box will represent GBP (base)/USD (quote).
-
03:58
AUD/JPY steadies around 96.50, focus shifts to potential US tariff updates on China
- AUD/JPY holds ground following the release of the monthly Consumer Price Index.
- Australia’s monthly CPI rose by 2.5% YoY in January, compared to an anticipated 2.6% growth.
- The Japanese Yen may find support from rising bets of more BoJ’s rate hikes.
AUD/JPY maintains its position after registering losses in the previous session, trading around 96.50 during the Asian hours on Wednesday. However, the upside of the currency cross could be restrained after Australia’s monthly Consumer Price Index (CPI) showed a 2.5% year-over-year rise in January but fell short of market expectations for 2.6% growth.
Attention turns to potential updates from China’s Ministry of Commerce on talks between China’s Vice Commerce Minister and US business leaders regarding tariffs. A Bloomberg report on Tuesday revealed that the Trump administration plans to tighten chip export controls on China — a key trading partner for Australia. The US is reportedly considering stricter restrictions on Nvidia chip exports and additional limitations on Chinese firms like SMIC and CXMT.
The Japanese Yen (JPY) may find support amid a global risk-off mood and growing expectations of further interest rate hikes by the Bank of Japan (BoJ). The BoJ is expected to raise rates from 0.50% to 0.75% this year. According to Bloomberg, overnight index swaps fully price in a rate hike by September, with a 50% chance of an earlier move as soon as June.
Meanwhile, traders in Japan are preparing for a series of key economic reports set to be released on Friday. These reports — covering industrial production, retail sales, and Tokyo inflation — could offer crucial insights into the BoJ’s future monetary policy direction.
Tariffs FAQs
Tariffs are customs duties levied on certain merchandise imports or a category of products. Tariffs are designed to help local producers and manufacturers be more competitive in the market by providing a price advantage over similar goods that can be imported. Tariffs are widely used as tools of protectionism, along with trade barriers and import quotas.
Although tariffs and taxes both generate government revenue to fund public goods and services, they have several distinctions. Tariffs are prepaid at the port of entry, while taxes are paid at the time of purchase. Taxes are imposed on individual taxpayers and businesses, while tariffs are paid by importers.
There are two schools of thought among economists regarding the usage of tariffs. While some argue that tariffs are necessary to protect domestic industries and address trade imbalances, others see them as a harmful tool that could potentially drive prices higher over the long term and lead to a damaging trade war by encouraging tit-for-tat tariffs.
During the run-up to the presidential election in November 2024, Donald Trump made it clear that he intends to use tariffs to support the US economy and American producers. In 2024, Mexico, China and Canada accounted for 42% of total US imports. In this period, Mexico stood out as the top exporter with $466.6 billion, according to the US Census Bureau. Hence, Trump wants to focus on these three nations when imposing tariffs. He also plans to use the revenue generated through tariffs to lower personal income taxes.
-
03:21
USD/JPY recovers above 149.00 on modest US Dollar strength
- USD/JPY climbs to around 149.30 in Wednesday’s Asian session, up 0.23% on the day.
- Risk-off mood and and rising bet of more rate hikes from the BoJ could support the JPY and cap the pair’s upside.
- Investors await the speeches from Fed’s Bostic and Barkin later on Wednesday.
The USD/JPY pair rebounds to near 149.30 during the Asian trading hours on Wednesday. However, the global risk-off sentiment and rising bet of more interest-rate hikes from the Bank of Japan (BoJ) might boost the Japanese Yen (JPY) and cap the upside for the pair.
The BOJ is anticipated to raise rates from 0.50% to 0.75% this year, which could influence investor sentiment and support the JPY. Overnight index swaps are fully pricing an increase in borrowing costs by September and pricing in a 50% odd move as soon as June, according to Bloomberg.
Japan's Services Producer Pricing Index (PPI) released on Tuesday, supports the case of the BoJ rate hike. This comes on top of Japan's robust consumer inflation numbers, reaffirming the prospect that the BoJ would raise interest rates further, which continues to support the JPY.
The US Conference Board’s Consumer Confidence fell the most since August 2021, declining to 98.3 in February versus 105.3 prior. This, in turn, could weigh on the Greenback against the JPY. Traders will take more cues from the Fedspeak later this week. Any hawkish comments from Federal Reserve (Fed) officials could lift the US Dollar in the near term.Japanese Yen FAQs
The Japanese Yen (JPY) is one of the world’s most traded currencies. Its value is broadly determined by the performance of the Japanese economy, but more specifically by the Bank of Japan’s policy, the differential between Japanese and US bond yields, or risk sentiment among traders, among other factors.
One of the Bank of Japan’s mandates is currency control, so its moves are key for the Yen. The BoJ has directly intervened in currency markets sometimes, generally to lower the value of the Yen, although it refrains from doing it often due to political concerns of its main trading partners. The BoJ ultra-loose monetary policy between 2013 and 2024 caused the Yen to depreciate against its main currency peers due to an increasing policy divergence between the Bank of Japan and other main central banks. More recently, the gradually unwinding of this ultra-loose policy has given some support to the Yen.
Over the last decade, the BoJ’s stance of sticking to ultra-loose monetary policy has led to a widening policy divergence with other central banks, particularly with the US Federal Reserve. This supported a widening of the differential between the 10-year US and Japanese bonds, which favored the US Dollar against the Japanese Yen. The BoJ decision in 2024 to gradually abandon the ultra-loose policy, coupled with interest-rate cuts in other major central banks, is narrowing this differential.
The Japanese Yen is often seen as a safe-haven investment. This means that in times of market stress, investors are more likely to put their money in the Japanese currency due to its supposed reliability and stability. Turbulent times are likely to strengthen the Yen’s value against other currencies seen as more risky to invest in.
-
03:18
NZD/USD remains subdued near 0.5700, awaits possible news on US tariffs against China
- NZD/USD depreciates as traders adopt caution as the February consumer confidence report looms.
- China’s Vice Commerce Minister has met with US business leaders to discuss tariffs.
- The Trump administration plans to tighten chip export controls on China.
NZD/USD continues its losing streak for the fourth successive session, trading around 0.5720 during the Asian hours on Wednesday. Traders remain cautious ahead of New Zealand’s February consumer confidence report due Friday, while the official PMI reading from key trading partner China is expected over the weekend.
Market focus stays on the interest rate outlook following the Reserve Bank of New Zealand’s (RBNZ) recent rate cut. Strong retail sales data reinforced expectations of a slower pace of rate cuts, supporting the RBNZ’s view that future reductions would likely be smaller and the easing cycle was nearing its end.
Attention also turns to potential updates from China’s Ministry of Commerce on talks between China’s Vice Commerce Minister and US business leaders regarding tariffs. A Bloomberg report on Tuesday revealed that the Trump administration plans to tighten chip export controls on China — a key trading partner for New Zealand. The US is reportedly considering stricter restrictions on Nvidia chip exports and additional limitations on Chinese firms like SMIC and CXMT.
The NZD/USD pair struggles amid rising risk sentiment after US President Donald Trump stated late Monday that broad US tariffs on imports from Canada and Mexico “will go forward” after the current month-long delay ends next week. Trump claimed the US had “been taken advantage of” by foreign countries and reaffirmed his intent to impose so-called reciprocal tariffs.
Investor sentiment toward New Zealand remains under pressure, given the economy’s reliance on resource exports and its sensitivity to global trade war risks.
Tariffs FAQs
Tariffs are customs duties levied on certain merchandise imports or a category of products. Tariffs are designed to help local producers and manufacturers be more competitive in the market by providing a price advantage over similar goods that can be imported. Tariffs are widely used as tools of protectionism, along with trade barriers and import quotas.
Although tariffs and taxes both generate government revenue to fund public goods and services, they have several distinctions. Tariffs are prepaid at the port of entry, while taxes are paid at the time of purchase. Taxes are imposed on individual taxpayers and businesses, while tariffs are paid by importers.
There are two schools of thought among economists regarding the usage of tariffs. While some argue that tariffs are necessary to protect domestic industries and address trade imbalances, others see them as a harmful tool that could potentially drive prices higher over the long term and lead to a damaging trade war by encouraging tit-for-tat tariffs.
During the run-up to the presidential election in November 2024, Donald Trump made it clear that he intends to use tariffs to support the US economy and American producers. In 2024, Mexico, China and Canada accounted for 42% of total US imports. In this period, Mexico stood out as the top exporter with $466.6 billion, according to the US Census Bureau. Hence, Trump wants to focus on these three nations when imposing tariffs. He also plans to use the revenue generated through tariffs to lower personal income taxes.
-
03:07
China’s Vice Commerce Minister meets with US business leaders to discuss tariffs
China's Commerce Ministry said on Wednesday that the country’s International Trade Representative and Vice Minister of Commerce, Wang Shouwe, has met with US business leaders.
The main agenda of the meeting was discussing tariffs.
No further details are provided about the same.
Market reaction
At the time of writing, AUD/USD is losing 0.09% on the day to trade near 0.6335, little impressed by these above headlines.
US-China Trade War FAQs
Generally speaking, a trade war is an economic conflict between two or more countries due to extreme protectionism on one end. It implies the creation of trade barriers, such as tariffs, which result in counter-barriers, escalating import costs, and hence the cost of living.
An economic conflict between the United States (US) and China began early in 2018, when President Donald Trump set trade barriers on China, claiming unfair commercial practices and intellectual property theft from the Asian giant. China took retaliatory action, imposing tariffs on multiple US goods, such as automobiles and soybeans. Tensions escalated until the two countries signed the US-China Phase One trade deal in January 2020. The agreement required structural reforms and other changes to China’s economic and trade regime and pretended to restore stability and trust between the two nations. However, the Coronavirus pandemic took the focus out of the conflict. Yet, it is worth mentioning that President Joe Biden, who took office after Trump, kept tariffs in place and even added some additional levies.
The return of Donald Trump to the White House as the 47th US President has sparked a fresh wave of tensions between the two countries. During the 2024 election campaign, Trump pledged to impose 60% tariffs on China once he returned to office, which he did on January 20, 2025. With Trump back, the US-China trade war is meant to resume where it was left, with tit-for-tat policies affecting the global economic landscape amid disruptions in global supply chains, resulting in a reduction in spending, particularly investment, and directly feeding into the Consumer Price Index inflation.
-
02:38
Gold price attracts some buyers amid trade war concerns
- Gold price drifts higher in Wednesday’s early Asian session.
- Trade war concerns among investors boost the safe-haven flows, benefiting the Gold price.
- Investors brace for The US January New Home Sales and Fedspeak later on Wednesday.
The Gold price (XAU/USD) recovers some lost ground after reaching a one-week low in the previous session. The uncertainty and ongoing fears of instability around US President Donald Trump's tariff plans provide some support to the yellow metal, a traditional safe-haven asset.
Nonetheless, analysts believe that Trump’s plans for higher tariffs have raised inflation worries at the US Federal Reserve (Fed), which might convince the US central bank to keep interest rates higher for longer. This, in turn, might cap the upside for the precious metal as higher interest rates tarnish non-yielding gold's appeal.
The US New Home Sales for January will be released later on Wednesday. Also, the Fed officials, including Raphael Bostic and Thomas Barkin are set to speak on the same day. On Friday, all eyes will be on the release of the US Personal Consumption Expenditures (PCE) - Price Index for January.Gold price gains traction as trade war fears persist
- Trump signed another Executive Order late Tuesday, signaling for the US Commerce Department to launch an official "probe" into Copper markets.
- Trump stated late Monday that tariffs on Canadian and Mexican imports were "on time and on schedule" despite efforts by the countries to beef up border security and halt the flow of fentanyl into the US ahead of a March 4 deadline, per Reuters,
- The US consumer confidence fell the most since August 2021, declining to 98.3 in February versus 105.3 prior, according to the Conference Board.
- Richmond Fed President Thomas Barkin said late Tuesday that he will follow a wait-and-see approach regarding central bank interest rate policy until it is clear inflation is returning to the Fed's 2% goal.
- Dallas Fed President Lorie Logan stated that it would be appropriate in the medium term for the Fed to buy more shorter-term securities than longer-term ones so that its portfolio can more quickly mirror the composition of Treasury issuance, per Bloomberg.
Gold price keeps the bullish tone despite consolidation in the shorter term
Gold price edges higher on the day. In the near term, the precious metal remains capped in the narrow trading range. However, the bullish outlook of the Gold price remains intact on the daily chart, with the price holding above the key 100-day Exponential Moving Average (EMA). Furthermore, the 14-day Relative Strength Index (RSI) stands above the midline near 64.0, indicating that the path of least resistance is to the upside.
The all-time high of $2,957 appears to be a tough nut to crack for the Gold bulls. An upside break from the mentioned level could set off a move to the next bullish levels at $2,980, the upper boundary of the Bollinger Band, en route to the $3,000 psychological level.
In the bearish case, the low of February 25 at $2,888 acts as an initial support level for the yellow metal. Extended losses could pave the way to $2,795, the lower limit of the Bollinger Band. The key contention level to watch is $2,718, the 100-day EMA.Gold FAQs
Gold has played a key role in human’s history as it has been widely used as a store of value and medium of exchange. Currently, apart from its shine and usage for jewelry, the precious metal is widely seen as a safe-haven asset, meaning that it is considered a good investment during turbulent times. Gold is also widely seen as a hedge against inflation and against depreciating currencies as it doesn’t rely on any specific issuer or government.
Central banks are the biggest Gold holders. In their aim to support their currencies in turbulent times, central banks tend to diversify their reserves and buy Gold to improve the perceived strength of the economy and the currency. High Gold reserves can be a source of trust for a country’s solvency. Central banks added 1,136 tonnes of Gold worth around $70 billion to their reserves in 2022, according to data from the World Gold Council. This is the highest yearly purchase since records began. Central banks from emerging economies such as China, India and Turkey are quickly increasing their Gold reserves.
Gold has an inverse correlation with the US Dollar and US Treasuries, which are both major reserve and safe-haven assets. When the Dollar depreciates, Gold tends to rise, enabling investors and central banks to diversify their assets in turbulent times. Gold is also inversely correlated with risk assets. A rally in the stock market tends to weaken Gold price, while sell-offs in riskier markets tend to favor the precious metal.
The price can move due to a wide range of factors. Geopolitical instability or fears of a deep recession can quickly make Gold price escalate due to its safe-haven status. As a yield-less asset, Gold tends to rise with lower interest rates, while higher cost of money usually weighs down on the yellow metal. Still, most moves depend on how the US Dollar (USD) behaves as the asset is priced in dollars (XAU/USD). A strong Dollar tends to keep the price of Gold controlled, whereas a weaker Dollar is likely to push Gold prices up.
-
02:37
Australian Dollar holds losses following monthly CPI
- The Australian Dollar remains tepid following the release of the monthly Consumer Price Index.
- Australia’s monthly CPI rose by 2.5% YoY in January, compared to an anticipated 2.6% growth.
- Trump administration considers to tighten chip export controls on China.
The Australian Dollar (AUD) remains subdued against the US Dollar (USD) for the fourth consecutive day on Wednesday. The AUD/USD pair remains under pressure after Australia’s monthly Consumer Price Index (CPI) showed a 2.5% year-over-year rise in January, matching December’s increase. This fell short of market expectations for 2.6% growth.
The AUD/USD pair struggles amid growing risk sentiment after US President Donald Trump stated late Monday that broad US tariffs on imports from Canada and Mexico “will go forward” once the month-long implementation delay ends next week. Trump asserted that the US has “been taken advantage of” by foreign countries and reaffirmed his intention to impose so-called reciprocal tariffs.
A Bloomberg report early Tuesday revealed that the Trump administration plans to tighten chip export controls on China, a key trading partner of Australia. The US is reportedly considering stricter restrictions on Nvidia chip exports and may introduce additional limitations on Chinese companies such as SMIC and CXMT.
The People’s Bank of China (PBOC) injected CNY300 billion on Tuesday via the one-year Medium-term Lending Facility (MLF), maintaining the rate at 2%. Additionally, the PBOC injected CNY318.5 billion through seven-day reverse repos at 1.50%, consistent with the prior rate. Given the close trade relationship between China and Australia, any shifts in the Chinese economy could impact the Australian Dollar.
Australian Dollar depreciates amid increased risk aversion
- The US Dollar Index (DXY), which measures the USD against six major currencies, falls to near 106.00 with 2-year and 10-year yields on US Treasury bonds declining to 4.09% and 4.28%, respectively, at the time of writing.
- Federal Reserve Bank of Chicago President Austan Goolsbee remarked on Monday that the US central bank needs greater clarity before considering interest rate cuts.
- The US Composite PMI fell to 50.4 in February, down from 52.7 in the previous month. In contrast, the Manufacturing PMI rose to 51.6 in February from 51.2 in January, surpassing the forecast of 51.5. Meanwhile, the Services PMI declined to 49.7 in February from 52.9 in January, falling short of the expected 53.0.
- US Initial Jobless Claims for the week ending February 14 rose to 219,000, exceeding the expected 215,000. Meanwhile, Continuing Jobless Claims increased to 1.869 million, slightly below the forecast of 1.87 million.
- President Trump signed a memorandum on Friday instructing the Committee on Foreign Investment in the United States (CFIUS) to limit Chinese investments in strategic sectors. Reuters cited a White House official saying that the national security memorandum seeks to encourage foreign investment while safeguarding US national security interests from potential threats posed by foreign adversaries like China.
- China released its annual policy statement for 2025 on Sunday. The statement details strategies to advance rural reforms and promote comprehensive rural revitalization. Additionally, China’s state-supported developers are aggressively increasing land purchases at premium prices, driven by the government’s relaxation of home price restrictions to revitalize the troubled property market.
- The Reserve Bank of Australia (RBA) lowered its Official Cash Rate (OCR) by 25 basis points to 4.10% last week—the first rate cut in four years. Reserve Bank of Australia (RBA) Governor Michele Bullock acknowledged the impact of high interest rates but cautioned that it was too soon to declare victory over inflation. She also emphasized the labor market's strength and clarified that future rate cuts are not guaranteed, despite market expectations.
Australian Dollar moves toward 14-day EMA barrier after breaking below 0.6350
AUD/USD trades near 0.6340 on Wednesday, breaking below the ascending channel that reflects a weakening bullish market bias. However, the 14-day Relative Strength Index (RSI) remains above 50, supporting the positive outlook is still in play.
On the upside, the AUD/USD pair tests the immediate barrier at a nine-day Exponential Moving Average (EMA) of 0.6342. A successful break above this level could improve the short-term price momentum and support the pair to test the key psychological resistance at 0.6400, with the next hurdle at the ascending channel’s upper boundary around 0.6450.
The AUD/USD pair tests immediate support at the 14-day EMA of 0.6331. A decisive break below this level could cause the emergence of the bearish bias and lead the pair to test the psychological level of 0.6300.
AUD/USD: Daily Chart

Australian Dollar PRICE Today
The table below shows the percentage change of Australian Dollar (AUD) against listed major currencies today. Australian Dollar was the weakest against the Canadian Dollar.
USD EUR GBP JPY CAD AUD NZD CHF USD -0.00% 0.05% 0.10% -0.03% 0.18% 0.12% -0.03% EUR 0.00% 0.05% 0.13% -0.03% 0.18% 0.13% -0.03% GBP -0.05% -0.05% 0.06% -0.07% 0.14% 0.09% -0.05% JPY -0.10% -0.13% -0.06% -0.10% 0.10% 0.04% -0.09% CAD 0.03% 0.03% 0.07% 0.10% 0.21% 0.15% 0.02% AUD -0.18% -0.18% -0.14% -0.10% -0.21% -0.05% -0.19% NZD -0.12% -0.13% -0.09% -0.04% -0.15% 0.05% -0.14% CHF 0.03% 0.03% 0.05% 0.09% -0.02% 0.19% 0.14% The heat map shows percentage changes of major currencies against each other. The base currency is picked from the left column, while the quote currency is picked from the top row. For example, if you pick the Australian Dollar from the left column and move along the horizontal line to the US Dollar, the percentage change displayed in the box will represent AUD (base)/USD (quote).
Economic Indicator
Monthly Consumer Price Index (YoY)
The Monthly Consumer Price Index (CPI), released by the Australian Bureau of Statistics on a monthly basis, measures the changes in the price of a fixed basket of goods and services acquired by household consumers. The indicator was developed to provide inflation data at a higher frequency than the quarterly CPI. The YoY reading compares prices in the reference month to the same month a year earlier. A high reading is seen as bullish for the Australian Dollar (AUD), while a low reading is seen as bearish.
Read more.Last release: Wed Feb 26, 2025 00:30
Frequency: Monthly
Actual: 2.5%
Consensus: 2.6%
Previous: 2.5%
Source: Australian Bureau of Statistics
-
02:27
PBOC sets USD/CNY reference rate at 7.1732 vs. 7.1726 previous
The People’s Bank of China (PBOC) set the USD/CNY central rate for the trading session ahead on Wednesday at 7.1732 as compared to the previous day's fix of 7.1726.
-
01:34
Australia’s monthly CPI inflation steadies at 2.5% YoY in January vs. 2.6% expected
Australia’s monthly Consumer Price Index (CPI) rose by 2.5% in the year to January, compared to a 2.5% increase seen in December, according to the data published by the Australian Bureau of Statistics (ABS) on Wednesday.
The market forecast was for 2.6% growth in the reported period.Market reaction to Australia’s monthly CPI inflation
At the time of writing, the AUD/USD pair is trading 0.14% higher on the day to trade at 0.6351.
Australian Dollar FAQs
One of the most significant factors for the Australian Dollar (AUD) is the level of interest rates set by the Reserve Bank of Australia (RBA). Because Australia is a resource-rich country another key driver is the price of its biggest export, Iron Ore. The health of the Chinese economy, its largest trading partner, is a factor, as well as inflation in Australia, its growth rate and Trade Balance. Market sentiment – whether investors are taking on more risky assets (risk-on) or seeking safe-havens (risk-off) – is also a factor, with risk-on positive for AUD.
The Reserve Bank of Australia (RBA) influences the Australian Dollar (AUD) by setting the level of interest rates that Australian banks can lend to each other. This influences the level of interest rates in the economy as a whole. The main goal of the RBA is to maintain a stable inflation rate of 2-3% by adjusting interest rates up or down. Relatively high interest rates compared to other major central banks support the AUD, and the opposite for relatively low. The RBA can also use quantitative easing and tightening to influence credit conditions, with the former AUD-negative and the latter AUD-positive.
China is Australia’s largest trading partner so the health of the Chinese economy is a major influence on the value of the Australian Dollar (AUD). When the Chinese economy is doing well it purchases more raw materials, goods and services from Australia, lifting demand for the AUD, and pushing up its value. The opposite is the case when the Chinese economy is not growing as fast as expected. Positive or negative surprises in Chinese growth data, therefore, often have a direct impact on the Australian Dollar and its pairs.
Iron Ore is Australia’s largest export, accounting for $118 billion a year according to data from 2021, with China as its primary destination. The price of Iron Ore, therefore, can be a driver of the Australian Dollar. Generally, if the price of Iron Ore rises, AUD also goes up, as aggregate demand for the currency increases. The opposite is the case if the price of Iron Ore falls. Higher Iron Ore prices also tend to result in a greater likelihood of a positive Trade Balance for Australia, which is also positive of the AUD.
The Trade Balance, which is the difference between what a country earns from its exports versus what it pays for its imports, is another factor that can influence the value of the Australian Dollar. If Australia produces highly sought after exports, then its currency will gain in value purely from the surplus demand created from foreign buyers seeking to purchase its exports versus what it spends to purchase imports. Therefore, a positive net Trade Balance strengthens the AUD, with the opposite effect if the Trade Balance is negative.
-
01:30
Australia Construction Work Done below forecasts (1%) in 4Q: Actual (0.5%)
-
01:30
Australia Construction Work Done below forecasts (1%) in 4Q: Actual (0.5%)
-
01:15
Currencies. Daily history for Tuesday, February 25, 2025
Pare Closed Change, % AUDUSD 0.63445 -0.09 EURJPY 156.68 0.05 EURUSD 1.05141 0.45 GBPJPY 188.744 -0.07 GBPUSD 1.26663 0.32 NZDUSD 0.57256 -0.09 USDCAD 1.43125 0.39 USDCHF 0.89282 -0.45 USDJPY 149.01 -0.42 -
00:55
WTI falls below $70.00 amid worries about US economy, Trump tariffs
- WTI price edges lower to around $69.00 in Wednesday's early Asian session.
- Worries about Trump's push for trade tariffs weigh on the WTI price.
- Crude oil inventories in the US fell by 640,000 barrels last week, according to the API.
West Texas Intermediate (WTI), the US crude oil benchmark, is trading around $69.00 during the early Asian session on Wednesday. The WTI price faces some selling pressure to a two-month low amid the fears of slower energy demand and worries about US President Donald Trump's tariffs.
Analysts said Trump's stated plans for higher tariffs have raised inflation worries at the US Federal Reserve (Fed). This might convince the US central bank to keep interest rates higher, which in turn could slow economic growth and energy demand. On Monday, Trump said that sweeping US tariffs on imports from Canada and Mexico “will go forward” when a month-long delay on their implementation expires next week.
The American Petroleum Institute (API) weekly report showed crude oil stockpiles in the United States for the week ending February 21 declined by 640,000 barrels, compared to a rise of 3.34 million barrels in the previous week. The market consensus estimated that stocks would increase by 2.3 million barrels.
Additionally, the possible peace talks on the Russia-Ukraine war might cap the upside for the WTI price. “Also weighing on oil prices was the possibility of a peace deal between Russia and Ukraine that foreshadows the lifting of Russian sanctions, potentially welcoming unfettered Russian supply back to the market," said Tamas Varga at oil broker PVM.WTI Oil FAQs
WTI Oil is a type of Crude Oil sold on international markets. The WTI stands for West Texas Intermediate, one of three major types including Brent and Dubai Crude. WTI is also referred to as “light” and “sweet” because of its relatively low gravity and sulfur content respectively. It is considered a high quality Oil that is easily refined. It is sourced in the United States and distributed via the Cushing hub, which is considered “The Pipeline Crossroads of the World”. It is a benchmark for the Oil market and WTI price is frequently quoted in the media.
Like all assets, supply and demand are the key drivers of WTI Oil price. As such, global growth can be a driver of increased demand and vice versa for weak global growth. Political instability, wars, and sanctions can disrupt supply and impact prices. The decisions of OPEC, a group of major Oil-producing countries, is another key driver of price. The value of the US Dollar influences the price of WTI Crude Oil, since Oil is predominantly traded in US Dollars, thus a weaker US Dollar can make Oil more affordable and vice versa.
The weekly Oil inventory reports published by the American Petroleum Institute (API) and the Energy Information Agency (EIA) impact the price of WTI Oil. Changes in inventories reflect fluctuating supply and demand. If the data shows a drop in inventories it can indicate increased demand, pushing up Oil price. Higher inventories can reflect increased supply, pushing down prices. API’s report is published every Tuesday and EIA’s the day after. Their results are usually similar, falling within 1% of each other 75% of the time. The EIA data is considered more reliable, since it is a government agency.
OPEC (Organization of the Petroleum Exporting Countries) is a group of 12 Oil-producing nations who collectively decide production quotas for member countries at twice-yearly meetings. Their decisions often impact WTI Oil prices. When OPEC decides to lower quotas, it can tighten supply, pushing up Oil prices. When OPEC increases production, it has the opposite effect. OPEC+ refers to an expanded group that includes ten extra non-OPEC members, the most notable of which is Russia.
-
00:50
EUR/USD poised for a bullish breakout?
- EUR/USD rose on Tuesday, but still capped by recent congestion.
- Market sentiment was knocked off-balance by US consumer sentiment figures.
- Investors are still holding on for key US inflation figures, and another Trump pivot.
The EUR/USD pair saw a rally on Tuesday, increasing by half a percent and surpassing 1.0500 as Fiber confronts a significant technical hurdle for the eighth consecutive day. US consumer sentiment fell in February, intensifying concerns about an economic slowdown. Additionally, President Donald Trump has reiterated his plans to enforce hefty import taxes on American citizens, which serve as a trade war threat to the US's closest trade partners.
Forex Today: Concerns over the US economy are picking up pace
Despite the decline in consumer sentiment, primarily influenced by concerns over Trump’s tariff policies, the Cable showed resilience on Tuesday. Even with Trump’s ongoing trade war maneuvers, the market remains optimistic that he might find a last-minute excuse to defer his tariff threats.
Wednesday presents a sparse economic data schedule for both the US and EU, but the focus is shifting toward Thursday's expected release of US Gross Domestic Product (GDP) figures. The week will conclude with Friday’s update on US Personal Consumption Expenditure (PCE) inflation, a crucial report that investors believe will indicate whether the recent spike in headline Consumer Price Index (CPI) inflation will affect core inflation figures.
EUR/USD price forecast
EUR/USD is holding above the 50-day Exponential Moving Average (EMA) near 1.0440, but only just. Bidding momentum remains limited and has yet to reclaim the 1.0550 level, though the pair is holding well above mid-January’s swing low into the 1.0200 handle.
Even if bidders successfully wrestle Fiber price action back above 1.0550, the 200-day EMA is descending below 1.0650 and represents a hard technical barrier to an extended bull run.
EUR/USD daily chart
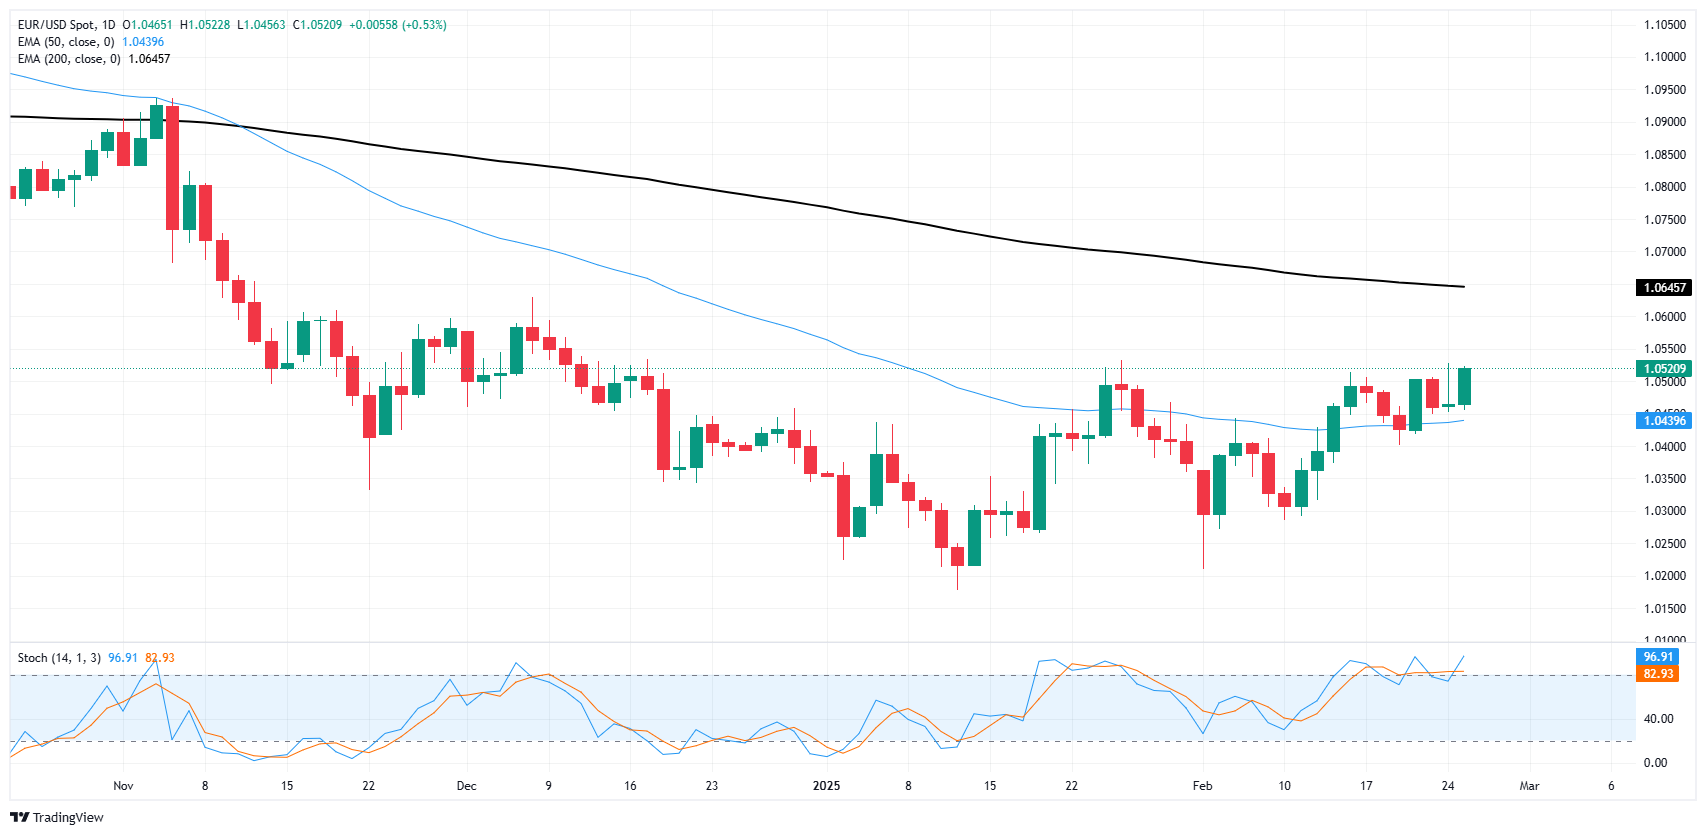
Euro FAQs
The Euro is the currency for the 19 European Union countries that belong to the Eurozone. It is the second most heavily traded currency in the world behind the US Dollar. In 2022, it accounted for 31% of all foreign exchange transactions, with an average daily turnover of over $2.2 trillion a day. EUR/USD is the most heavily traded currency pair in the world, accounting for an estimated 30% off all transactions, followed by EUR/JPY (4%), EUR/GBP (3%) and EUR/AUD (2%).
The European Central Bank (ECB) in Frankfurt, Germany, is the reserve bank for the Eurozone. The ECB sets interest rates and manages monetary policy. The ECB’s primary mandate is to maintain price stability, which means either controlling inflation or stimulating growth. Its primary tool is the raising or lowering of interest rates. Relatively high interest rates – or the expectation of higher rates – will usually benefit the Euro and vice versa. The ECB Governing Council makes monetary policy decisions at meetings held eight times a year. Decisions are made by heads of the Eurozone national banks and six permanent members, including the President of the ECB, Christine Lagarde.
Eurozone inflation data, measured by the Harmonized Index of Consumer Prices (HICP), is an important econometric for the Euro. If inflation rises more than expected, especially if above the ECB’s 2% target, it obliges the ECB to raise interest rates to bring it back under control. Relatively high interest rates compared to its counterparts will usually benefit the Euro, as it makes the region more attractive as a place for global investors to park their money.
Data releases gauge the health of the economy and can impact on the Euro. Indicators such as GDP, Manufacturing and Services PMIs, employment, and consumer sentiment surveys can all influence the direction of the single currency. A strong economy is good for the Euro. Not only does it attract more foreign investment but it may encourage the ECB to put up interest rates, which will directly strengthen the Euro. Otherwise, if economic data is weak, the Euro is likely to fall. Economic data for the four largest economies in the euro area (Germany, France, Italy and Spain) are especially significant, as they account for 75% of the Eurozone’s economy.
Another significant data release for the Euro is the Trade Balance. This indicator measures the difference between what a country earns from its exports and what it spends on imports over a given period. If a country produces highly sought after exports then its currency will gain in value purely from the extra demand created from foreign buyers seeking to purchase these goods. Therefore, a positive net Trade Balance strengthens a currency and vice versa for a negative balance.
-
00:25
GBP/USD continues to churn near key technical levels
- GBP/USD churns near familiar territory as markets await developments.
- Cable caught an early lift on Tuesday, and shrugged off near-term risk fears.
- US data continues to point to a worsening economic outlook.
GBP/USD caught a small lift on Tuesday, bolstering Cable back into the high end of near-term consolidation and keeping bids pinned close to the 200-day Exponential Moving Average (EMA). US consumer sentiment dipped in February, adding more weight to economic slowdown concerns, and US President Donald Trump has reaffirmed his intent to impose stiff import taxes on his own citizens as a trade war threat against the US’ closest trading partners.
Forex Today: Concerns over the US economy are picking up pace
Despite weakening consumer sentiment, driven largely by fears of President Trump’s own tariff packages, Cable maintained a positive tilt on Tuesday. Despite a fresh go around the wheel of President Trump’s trade war attempts, markets continue to believe that the US President will find an 11th hour reason to kick the can down the road on his own tariff threats.
Wednesday is a relatively thin showing on the data calendar for both the US and UK sides of the docket, though markets are looking ahead to this week’s US Gross Domestic Product (GDP) print, due on Thursday. Friday will close out the week with an update on US Personal Consumption Expenditure (PCE) inflation, a key print that investors are hoping will show a recent upturn in headline Consumer Price Index (CPI) inflation won’t reach core inflation metrics.
GBP/USD price forecast
Tuesday’s bullish tilt in Cable trading leaves GBP/USD hamstrung near the 200-day EMA around 1.2680. Bulls have managed to keep the pair buoyed on the high end after a remarkable 4.7% recovery from mid-January’s swing low near 1.2100, however a hard technical ceiling is priced in just south of thew 1.2700 handle.
GBP/USD daily
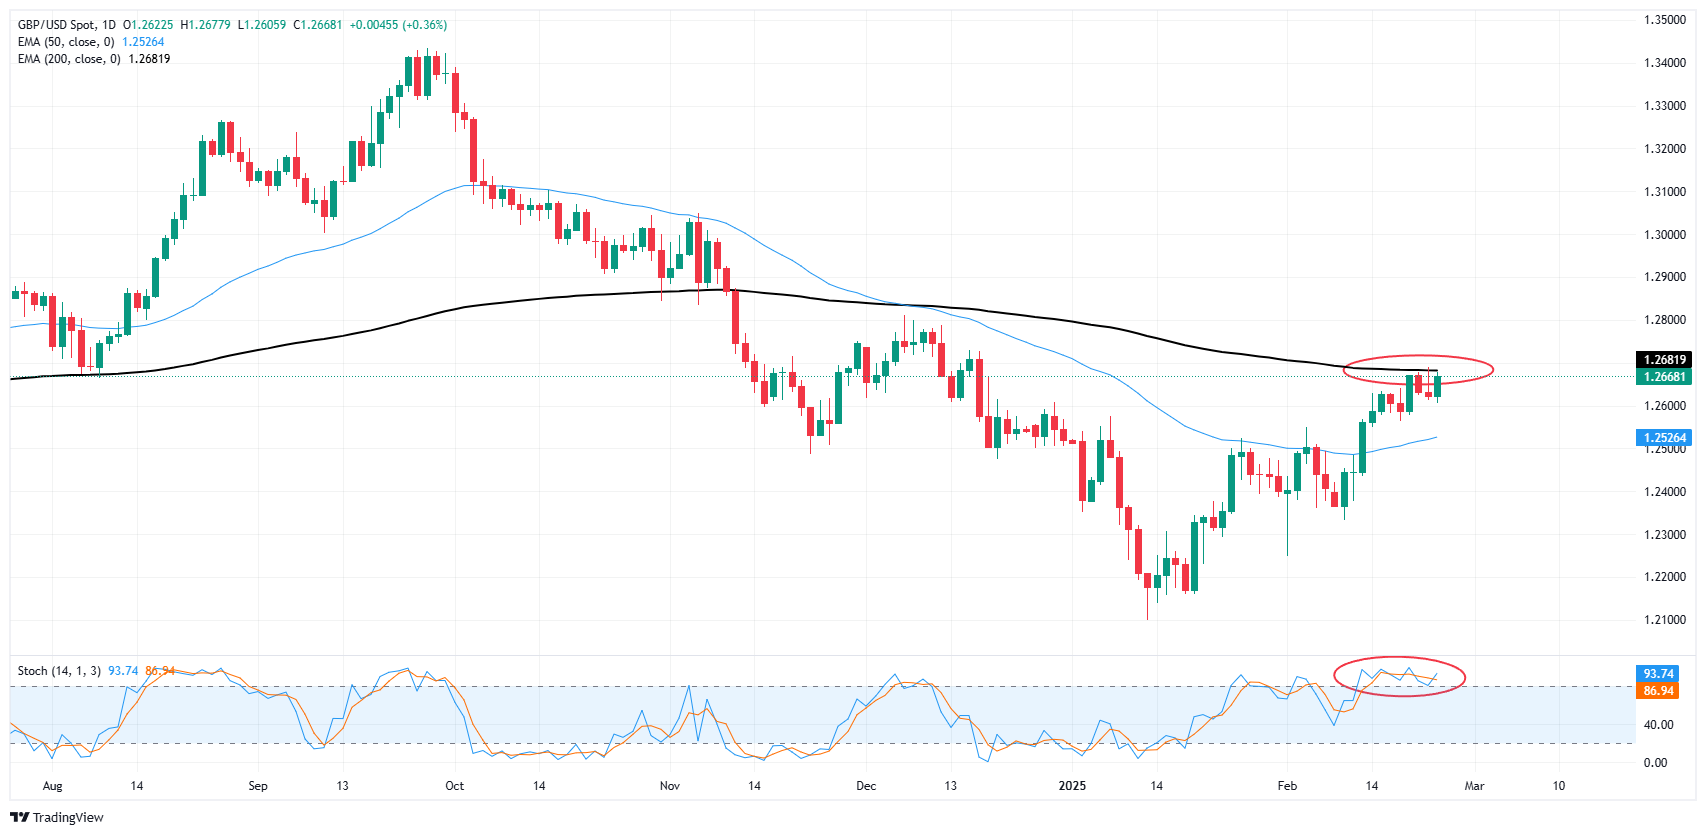
Pound Sterling FAQs
The Pound Sterling (GBP) is the oldest currency in the world (886 AD) and the official currency of the United Kingdom. It is the fourth most traded unit for foreign exchange (FX) in the world, accounting for 12% of all transactions, averaging $630 billion a day, according to 2022 data. Its key trading pairs are GBP/USD, also known as ‘Cable’, which accounts for 11% of FX, GBP/JPY, or the ‘Dragon’ as it is known by traders (3%), and EUR/GBP (2%). The Pound Sterling is issued by the Bank of England (BoE).
The single most important factor influencing the value of the Pound Sterling is monetary policy decided by the Bank of England. The BoE bases its decisions on whether it has achieved its primary goal of “price stability” – a steady inflation rate of around 2%. Its primary tool for achieving this is the adjustment of interest rates. When inflation is too high, the BoE will try to rein it in by raising interest rates, making it more expensive for people and businesses to access credit. This is generally positive for GBP, as higher interest rates make the UK a more attractive place for global investors to park their money. When inflation falls too low it is a sign economic growth is slowing. In this scenario, the BoE will consider lowering interest rates to cheapen credit so businesses will borrow more to invest in growth-generating projects.
Data releases gauge the health of the economy and can impact the value of the Pound Sterling. Indicators such as GDP, Manufacturing and Services PMIs, and employment can all influence the direction of the GBP. A strong economy is good for Sterling. Not only does it attract more foreign investment but it may encourage the BoE to put up interest rates, which will directly strengthen GBP. Otherwise, if economic data is weak, the Pound Sterling is likely to fall.
Another significant data release for the Pound Sterling is the Trade Balance. This indicator measures the difference between what a country earns from its exports and what it spends on imports over a given period. If a country produces highly sought-after exports, its currency will benefit purely from the extra demand created from foreign buyers seeking to purchase these goods. Therefore, a positive net Trade Balance strengthens a currency and vice versa for a negative balance.
-
00:06
USD/CAD extends upside above 1.4300 as trade fears loom
- USD/CAD gains ground to around 1.4315 in Tuesday’s late American session.
- Fresh tariff concerns and lower crude oil prices drag the Canadian Dollar lower.
- The US CB Consumer Confidence Index fell to 98.3 in February.
The USD/CAD pair extends the rally to near 1.4315 during the late American session on Tuesday. The Canadian Dollar (CAD) amid the fears that US trade tariffs will be implemented. Investors will take more cues from the US New Home Sales and Fedspeak later on Wednesday.
US President Donald Trump said Monday that sweeping US tariffs on imports from Canada and Mexico “will go forward” when a month-long delay on their implementation expires next week. Trump further stated that the US does not need Canadian Crude Oil or lumber products, a statement that runs against a hard wall of decades of trade history. Fresh tariff concerns exert some selling pressure on the Canadian Dollar (CAD) and create a tailwind for the pair.
Additionally, a fall in crude oil prices undermines the commodity-linked Loonie. It's worth noting that Canada is the largest oil exporter to the United States (US), and lower crude oil prices tend to have a negative impact on the CAD value.
On the other hand, US consumer confidence fell the most since August 2021, prompting traders to raise their bets on Federal Reserve (Fed) rate cuts this year. This, in turn, could weigh on the Greenback against the CAD. The US Consumer Confidence declined to 98.3 versus 105.3 prior, according to the Conference Board.Canadian Dollar FAQs
The key factors driving the Canadian Dollar (CAD) are the level of interest rates set by the Bank of Canada (BoC), the price of Oil, Canada’s largest export, the health of its economy, inflation and the Trade Balance, which is the difference between the value of Canada’s exports versus its imports. Other factors include market sentiment – whether investors are taking on more risky assets (risk-on) or seeking safe-havens (risk-off) – with risk-on being CAD-positive. As its largest trading partner, the health of the US economy is also a key factor influencing the Canadian Dollar.
The Bank of Canada (BoC) has a significant influence on the Canadian Dollar by setting the level of interest rates that banks can lend to one another. This influences the level of interest rates for everyone. The main goal of the BoC is to maintain inflation at 1-3% by adjusting interest rates up or down. Relatively higher interest rates tend to be positive for the CAD. The Bank of Canada can also use quantitative easing and tightening to influence credit conditions, with the former CAD-negative and the latter CAD-positive.
The price of Oil is a key factor impacting the value of the Canadian Dollar. Petroleum is Canada’s biggest export, so Oil price tends to have an immediate impact on the CAD value. Generally, if Oil price rises CAD also goes up, as aggregate demand for the currency increases. The opposite is the case if the price of Oil falls. Higher Oil prices also tend to result in a greater likelihood of a positive Trade Balance, which is also supportive of the CAD.
While inflation had always traditionally been thought of as a negative factor for a currency since it lowers the value of money, the opposite has actually been the case in modern times with the relaxation of cross-border capital controls. Higher inflation tends to lead central banks to put up interest rates which attracts more capital inflows from global investors seeking a lucrative place to keep their money. This increases demand for the local currency, which in Canada’s case is the Canadian Dollar.
Macroeconomic data releases gauge the health of the economy and can have an impact on the Canadian Dollar. Indicators such as GDP, Manufacturing and Services PMIs, employment, and consumer sentiment surveys can all influence the direction of the CAD. A strong economy is good for the Canadian Dollar. Not only does it attract more foreign investment but it may encourage the Bank of Canada to put up interest rates, leading to a stronger currency. If economic data is weak, however, the CAD is likely to fall.
-