Noticias del mercado
-
22:43
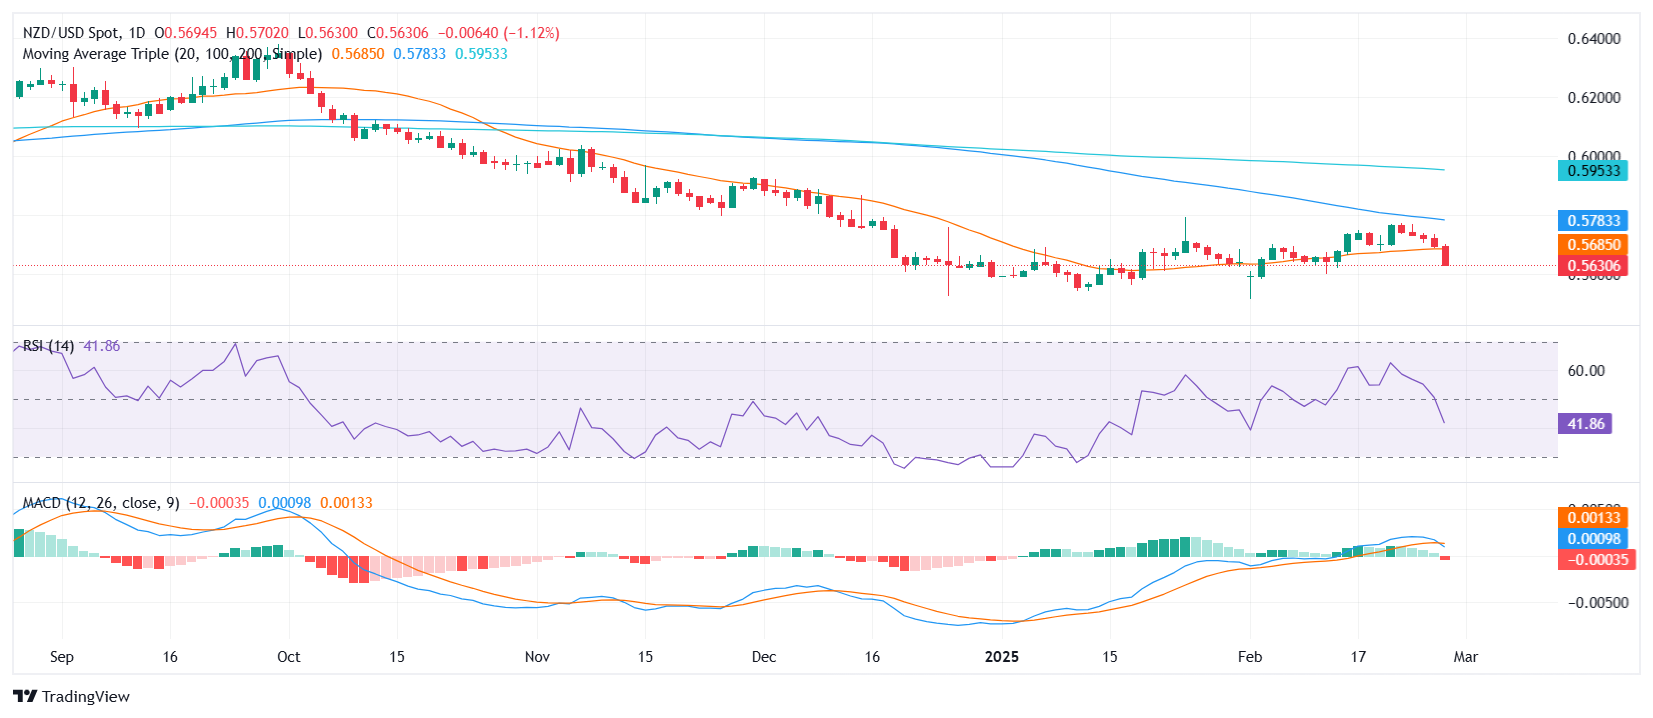
NZD/USD Price Analysis: Pair extends decline, hits lowest level since mid-February
- NZD/USD continues to slide, marking its fifth consecutive daily loss with sharp downside pressure.
- The pair loses the 20-day SMA while the MACD crosses below its signal line, reinforcing the bearish outlook.
- Key support lies at 0.5600, while resistance is seen at 0.5680 and the 20-day SMA.
NZD/USD extended its downward momentum on Thursday, registering a fifth straight session of losses and hitting its lowest level since mid-February. The selling pressure intensified after the pair failed to hold above the 20-day Simple Moving Average (SMA) and plunging towards 0.5630, signaling a deeper correction. Bears remain in control, pushing the price further into negative territory.
Technical indicators reflect the growing bearish momentum. The Relative Strength Index (RSI) is firmly in negative territory and declining, suggesting that sellers maintain the upper hand. Additionally, the Moving Average Convergence Divergence (MACD) has crossed below its signal line, a sign that downside momentum is strengthening. The histogram prints flat green bars, indicating a temporary pause in momentum but not a shift in trend.
Looking ahead, immediate support is located at 0.5600, a level that could act as a short-term floor. A decisive break below this could open the door toward 0.5550. On the upside, the first resistance is at 0.5680, aligning with the recent intraday peaks, followed by the 20-day SMA, which needs to be reclaimed for the pair to regain bullish traction.
NZD/USD daily chart
-
22:07
New Zealand ANZ – Roy Morgan Consumer Confidence increased to 96.6 in February from previous 96
-
22:06
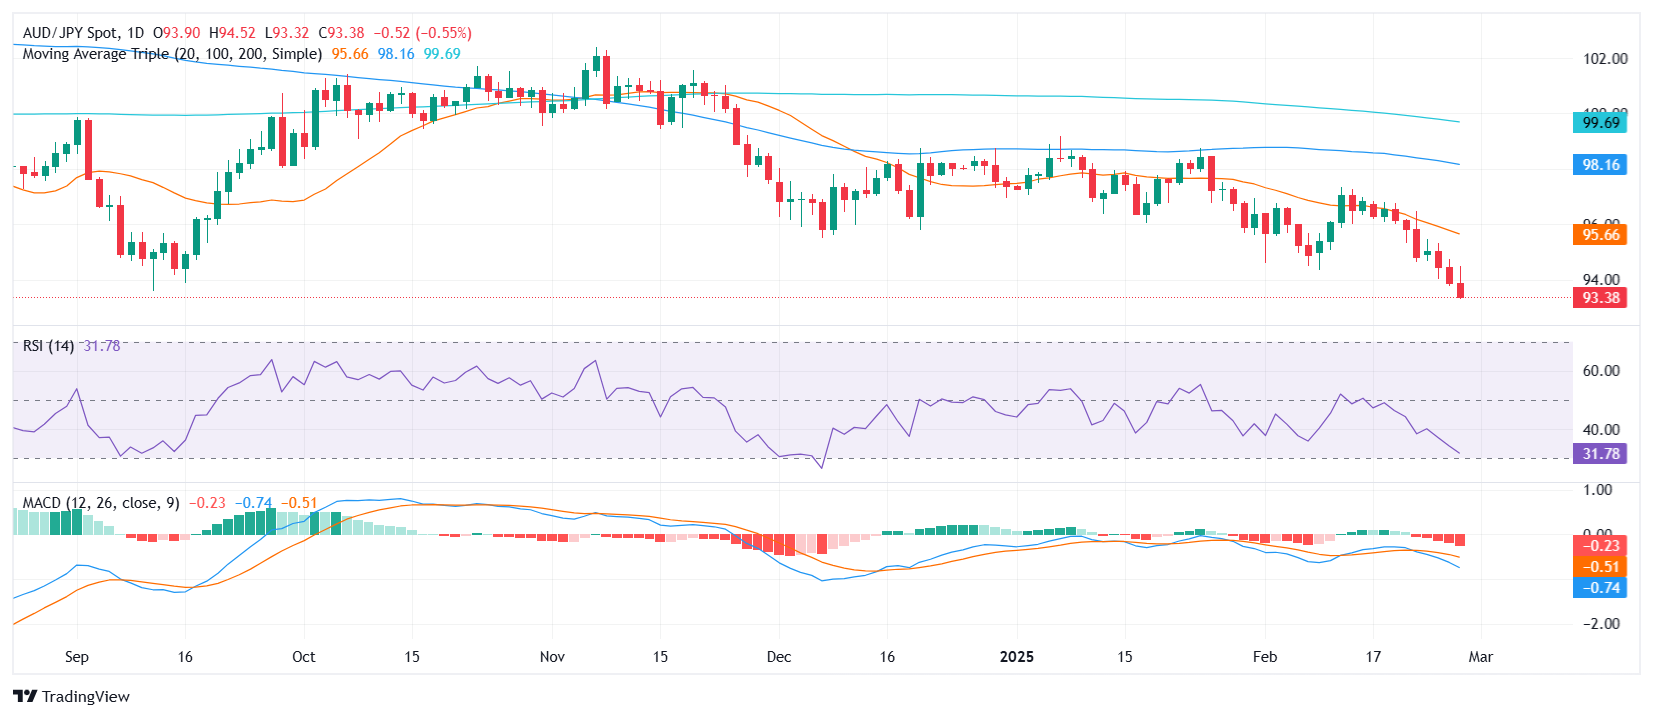
AUD/JPY Price Analysis: Bears take control as pair extends losing streak
- AUD/JPY posts a three-day losing streak, trading near its lowest levels since mid-September.
- RSI continues to decline, nearing oversold territory, signaling persistent downside pressure.
- MACD histogram prints rising red bars, reflecting strengthening bearish momentum.
AUD/JPY extended its downward trajectory on Thursday, marking a third consecutive day of losses and trading around its lowest levels since mid-September. The pair remains under pressure, with sellers firmly in control after breaching key support levels. The broader technical structure suggests that bearish forces could continue to dominate in the near term.
Technical indicators reinforce the prevailing downtrend. The Relative Strength Index (RSI) is steadily declining and is now hovering near oversold territory, indicating that downside momentum remains intact. Meanwhile, the Moving Average Convergence Divergence (MACD) histogram shows rising red bars, further highlighting increasing bearish sentiment.
Looking ahead, key support is seen around 93.30, a level that previously acted as a floor in September. A break below this could open the door toward 93.00. On the upside, initial resistance stands at 95.50, aligning with the 20-day Simple Moving Average (SMA), followed by a more significant barrier at 96.00. A recovery above these levels would be needed to shift the bearish outlook.
AUD/JPY daily chart
-
21:28
Fed's Harker: Progress on inflation has slowed
Federal Reserve (Fed) Bank of Philadelphia President Patrick Harker added his voice to a procession of Fedspeakers on Thursday, highlighting that inflation progress has "slowed". Policymakers from the Fed are scrambling to pre-soften markets in advance of this week's upcoming Personal Consumption Expenditures Price Index (PCEPI) inflation print, which is most likely headed for an upside beat as inflation pressures begin to cook once more under the hood of the US economy.
Key highlights
The policy rate remains restrictive enough to continue putting downward pressure on inflation.
The Fed watches the data, then reacts if we must.
We should let monetary policy continue to work.
The policy rate is not negatively impacting the economy.
Progress toward 2% inflation target has slowed.
I am optimistic on the economic outlook, despite the challenge of getting inflation back to target.
We should not move to act on policy in either direction based on one report covering one month of data.
-
21:23
Canadian Dollar sinks on fresh tariff threats, date changes again
- The Canadian Dollar lost over 0.7% on Thursday.
- US President Donald Trump pivoted tariffs to March 4.
- “Reciprocal tariffs” still coming in April, Canadian PM vows retaliatory tariffs.
The Canadian Dollar (CAD) shed over two-thirds of a percent against the US Dollar (USD) on Thursday, falling for a fifth consecutive session and accelerating losses after US President Donald Trump renewed his threats to impose a 25% tariff on Canadian goods beginning on March 4. According to President Trump, a package of “reciprocal tariffs” is also set to begin on April 2.
Canadian Prime Minister Justin Trudeau has already responded to Donald Trump’s wavering reversals on tariffs, vowing that Canada is ready to retaliate against any US tariffs that the White House imposes.
Daily digest market movers: Canadian Dollar recedes as tariff threats resurface
- The Canadian Dollar lost 0.72% on Thursday, bolstering USD/CAD to 1.440 for the first time since the beginning of February.
- Loonie markets are recoiling in the face of renewed threats of a 25% tariff on Canadian goods from US President Donald Trump.
- US President Donald Trump reiterates March 4 tariffs, still seeking Ukraine deal
- According to President Trump, Canada isn’t doing enough to stop the flow of fentanyl into the US, although less than 1% of the drugs seized by US officials were at the US-Canada border.
- US data is also souring, reinforcing fears of a steepening economic slowdown and accelerating inflation pressures across the board.
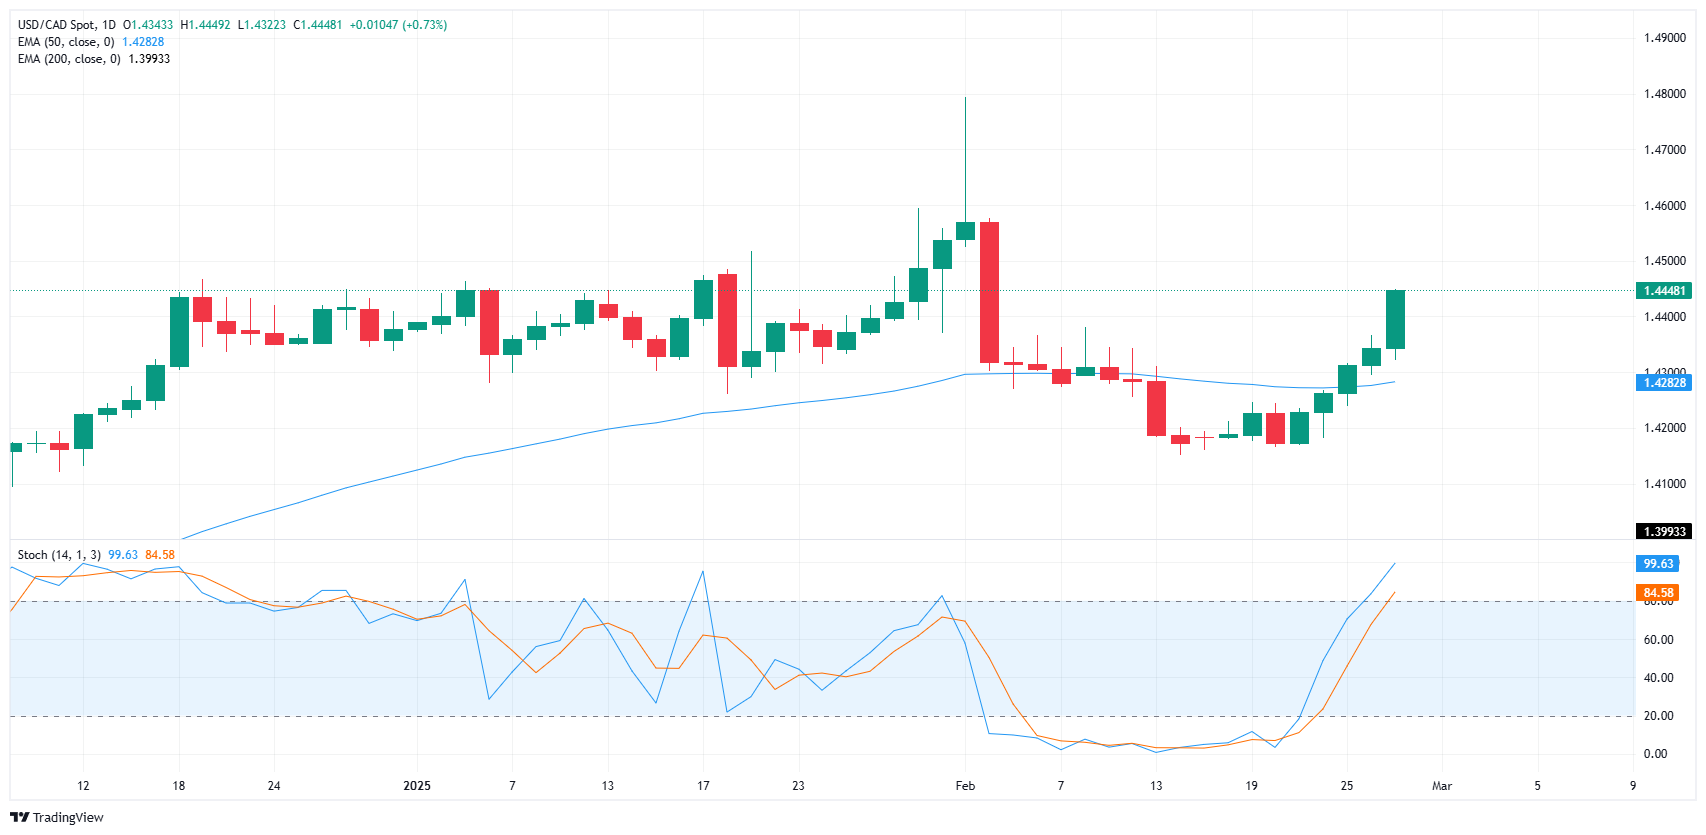
Canadian Dollar price forecast
The Canadian Dollar’s fresh weakness puts USD/CAD on pace for fresh gains, bolstering the Dollar-Loonie pairing into new multi-week highs. After a brief slump sparked by a broad-market wind-down in Greenback bidding, USD/CAD is roaring back to life, chalking in five straight daily gains and pushing back into familiar technical contention territory near 1.4500.
USD/CAD daily chart
Tariffs FAQs
Tariffs are customs duties levied on certain merchandise imports or a category of products. Tariffs are designed to help local producers and manufacturers be more competitive in the market by providing a price advantage over similar goods that can be imported. Tariffs are widely used as tools of protectionism, along with trade barriers and import quotas.
Although tariffs and taxes both generate government revenue to fund public goods and services, they have several distinctions. Tariffs are prepaid at the port of entry, while taxes are paid at the time of purchase. Taxes are imposed on individual taxpayers and businesses, while tariffs are paid by importers.
There are two schools of thought among economists regarding the usage of tariffs. While some argue that tariffs are necessary to protect domestic industries and address trade imbalances, others see them as a harmful tool that could potentially drive prices higher over the long term and lead to a damaging trade war by encouraging tit-for-tat tariffs.
During the run-up to the presidential election in November 2024, Donald Trump made it clear that he intends to use tariffs to support the US economy and American producers. In 2024, Mexico, China and Canada accounted for 42% of total US imports. In this period, Mexico stood out as the top exporter with $466.6 billion, according to the US Census Bureau. Hence, Trump wants to focus on these three nations when imposing tariffs. He also plans to use the revenue generated through tariffs to lower personal income taxes.
-
21:18
Australian Dollar continues its decline as US Dollar remains strong amid risk-off mood
- Traders remain wary of potential US tariffs on Canada, Mexico, and the European Union, fueling global uncertainty.
- PCE and GDP data from the US came in strong.
- Reserve Bank of Australia Deputy Governor Andrew Hauser emphasized the need for stronger inflation evidence before further policy moves.
- China’s PBC Deputy Governor Lu Lei proposed special treasury bonds to bolster major state-owned banks, underscoring potential effects on Australia’s resource exports.
The Australian Dollar (AUD) loses ground against the US Dollar (USD) for the fifth consecutive day on Thursday. A prevailing risk-off mood, combined with renewed United States (US) tariff threats, underpins the Greenback’s strength alongside strong inflation and GDP data. Meanwhile, the Reserve Bank of Australia (RBA) maintains a cautious stance as it grapples with lingering inflation challenges.
Daily digest market movers: AUD pressured by tariff concerns and subdued capital spending
- The Aussie extends its losing streak, further weighed by softer-than-expected Private Capital Expenditure data, which declined 0.2% in Q4 2024 instead of the forecasted 0.8% gain.
- RBA Deputy Governor Andrew Hauser reiterated optimism for eventual inflation improvements but insisted on seeing tangible progress before altering the bank’s trajectory.
- On the Chinese front, the People’s Bank of China Deputy Governor Lu Lei signaled support for new treasury bonds to boost key banks’ equity levels. This development may impact Australian commodity exports if Chinese growth slows.
- US trade authorities published contradictory statements on scheduled tariffs against multiple trading partners, including Canada and Mexico, leading to persistent uncertainty in financial markets.
- Recent US data showed second-estimate GDP growth at 2.3% annualized in Q4, while the core Personal Consumption Expenditures measure climbed to 2.7%, reinforcing the Federal Reserve’s hawkish lean on inflation.
AUD/USD technical outlook: Five-day losing streak confirms break below 20-day SMA
AUD/USD has lost ground for a fifth consecutive session, declining around the mid-0.6200 zone after failing to hold above its 20-day Simple Moving Average. The Relative Strength Index (RSI) hovers in a lower range, declining sharply and signaling weakening bullish efforts. Meanwhile, the Moving Average Convergence Divergence (MACD) histogram prints decreasing green bars, suggesting that upside momentum is fading. The pair’s failure to maintain traction above the 20-day SMA does not necessarily imply a full-blown bearish trend shift. However, further downside cannot be ruled out if tariff news or domestic data significantly dent risk sentiment.
Australian Dollar FAQs
One of the most significant factors for the Australian Dollar (AUD) is the level of interest rates set by the Reserve Bank of Australia (RBA). Because Australia is a resource-rich country another key driver is the price of its biggest export, Iron Ore. The health of the Chinese economy, its largest trading partner, is a factor, as well as inflation in Australia, its growth rate and Trade Balance. Market sentiment – whether investors are taking on more risky assets (risk-on) or seeking safe-havens (risk-off) – is also a factor, with risk-on positive for AUD.
The Reserve Bank of Australia (RBA) influences the Australian Dollar (AUD) by setting the level of interest rates that Australian banks can lend to each other. This influences the level of interest rates in the economy as a whole. The main goal of the RBA is to maintain a stable inflation rate of 2-3% by adjusting interest rates up or down. Relatively high interest rates compared to other major central banks support the AUD, and the opposite for relatively low. The RBA can also use quantitative easing and tightening to influence credit conditions, with the former AUD-negative and the latter AUD-positive.
China is Australia’s largest trading partner so the health of the Chinese economy is a major influence on the value of the Australian Dollar (AUD). When the Chinese economy is doing well it purchases more raw materials, goods and services from Australia, lifting demand for the AUD, and pushing up its value. The opposite is the case when the Chinese economy is not growing as fast as expected. Positive or negative surprises in Chinese growth data, therefore, often have a direct impact on the Australian Dollar and its pairs.
Iron Ore is Australia’s largest export, accounting for $118 billion a year according to data from 2021, with China as its primary destination. The price of Iron Ore, therefore, can be a driver of the Australian Dollar. Generally, if the price of Iron Ore rises, AUD also goes up, as aggregate demand for the currency increases. The opposite is the case if the price of Iron Ore falls. Higher Iron Ore prices also tend to result in a greater likelihood of a positive Trade Balance for Australia, which is also positive of the AUD.
The Trade Balance, which is the difference between what a country earns from its exports versus what it pays for its imports, is another factor that can influence the value of the Australian Dollar. If Australia produces highly sought after exports, then its currency will gain in value purely from the surplus demand created from foreign buyers seeking to purchase its exports versus what it spends to purchase imports. Therefore, a positive net Trade Balance strengthens the AUD, with the opposite effect if the Trade Balance is negative.
-
20:34
Forex Today: Investors will be closely following US PCE and German CPI
The US Dollar gathered extra steam and rose to multi-day highs on the back of extra announcement regarding tariffs by President Trump, while some cautious trade also prevailed ahead of the release of US inflation tracked by the PCE on Friday.
Here is what you need to know on Friday, February 28:
The US Dollar Index (DXY) advanced to multi-day highs past the 107.00 barrier helped by the US tariff narrative, while a small bounce in US yields also added to the uptick. The release of PCE data will take centre stage along with Personal Income/Spending, the Chicago PMI, advanced Goods Trade Balance results, and Wholesale Inventories.
EUR/USD succumbed to the two-day advance in the Greenback and retreated to weekly lows just below 1.0400. Germany data will be at the centre of the debate with the publication of Retail Sales, the labour market report, and the preliminary Inflation Rate for the month of February. In addition, the ECB will release its Consumer Inflation Expectations.
GBP/USD reversed two daily gains in a row and receded to just pips away from the key 1.2600 support on the back of renewed strength in the US Dollar. The Nationwide Housing Prices are due.
USD/JPY added to Wednesday’s uptick and briefly surpassed the 150.00 barrier ahead of key data releases at the end of the week. The Tokyo inflation figures are due, seconded by Industrial Production, Retail Sales, Housing Starts, Construction Orders, and the weekly Foreign Bond Investment readings.
AUD/USD broke below the 0.6300 with certain conviction to hit new two-week lows and extend further its rejection from yearly peaks above the 0.6300 hurdle. Housing Credit figures and Private Sector Credit readings will close the calendar in Oz.
WTI rose sharply and retested the area above the key $70.00 mark per barrel on fresh supply concerns after President Trump revoked Chevron’s licence to operate in Venezuela.
Gold prices tumbled further and revisited two-day lows around $2,870 per ounce troy following the stronger Dollar and the bounce in US yields. Silver prices resumed their downtrend and flirted with weekly lows near $31.30 per ounce.
-
19:40
Fed's Hammack: Further easing in inflation far from certain
Federal Reserve (Fed) Bank of Cleveland President Beth Hammack noted on Thursday that interest rates are likely on hold for the time being as inflation data starts to pose a growing problem for central policymakers.
Key highlights
Monetary policy has the luxury of being patient right now.
I seek evidence that inflation is moving to 2% before supporting more cuts.
The Fed are likely to hold rates steady for some time.
There are good reasons to expect inflation to come down further.
Fed rate policy may be close to neutral right now.
Broad financial conditions are accommodative right now.
Fed policy does not appear meaningfully restrictive.
Equity market valuations are high right now.
Easing inflation has been uneven and has slowed.
Further easing in inflation are far from certain, upside risks are abound.
Over the longer run, the economy can adapt to higher interest rates.
-
19:20
Dow Jones Industrial Average shrugs off new tariff threats
- The Dow Jones rose around 400 points at its peak on Thursday.
- Despite further tariff changes from President Trump, equities are looking up.
- Investors have become inoculated to tariff threats, but volatility pressures remain.
The Dow Jones Industrial Average (DJIA) knocked around 400 points higher at its highest on Thursday, driven by a heavy bounceback in overweight stocks listed on the Dow Jones. United States (US) President Donald Trump refreshed his threats of imposing a 25% tariff package on Canada and Mexico, but investors have gotten a lot of practice assuming the Trump administration will find a last-minute reason to pivot away from its own arbitrary schedules.
President Trump reversed his own timeline for new tariffs in the early hours of Thursday’s US market session, pivoting from an April 2 start date for 25% tariffs on Canada and Mexico, as well as an additional 10% import fee on Chinese goods, to now begin on March 4. “Reciprocal tariffs” that will be imposed on a much wider swath of US trading partners are still slated for implementation on April 2, though specific details still remain elusive on both sets of tariffs.
Despite continued wavering from the Trump administration and cyclical headline churn on tariffs, investors continue to bet that a last-minute deal or delay will be found on the latest round of import taxes being threatened by President Trump.
US President Donald Trump reiterates March 4 tariffs, still seeking Ukraine deal
On the economic data front, US Gross Domestic Product (GDP) growth for the fourth quarter beat forecasts on the front end of the curve, while Durable Goods spending accelerated faster than expected in January. US Q4 GDP rose to 2.4% QoQ compared to the expected hold at 2.2%, but the annualized figure held steady at 2.3%.
US Durable Goods Orders accelerated to 3.1% MoM in January, beating the expected print of 2.0% and swinging well above the revised previous figure of -1.8%. A welcome print for economy watchers, it doesn’t come without its drawbacks: much of the figure is likely businesses stuffing their inventories ahead of potential tariffs, and a recent uptick in inflation may be boosting the numbers artificially, which could pose a larger problem down the line.
It’s worth noting that much of the uptick in Durable Goods Orders can be found in the transportation sector following a large swell in bookings for Boeing (BA) airplanes and automotive vehicles. Without these factors, US Durable Goods Orders actually came in at a flat 0.0% in January, missing the forecast of 0.3% and coming in below the revised previous print of 0.1%.
US Personal Consumption Expenditure Price Index (PCEPI) inflation is due on Friday, but Thursday’s preview release bodes poorly for investors pinning their hopes that a recent uptick in headline inflation figures will be temporary. QoQ Core PCE, a preview of Friday’s main inflation print, accelerated to 2,7% from the expected hold at 2.5%.
Dow Jones news
Over two-thirds of the Dow Jones equity board is drifting into the high side on Thursday, but outsized gains in key overweight securities are dragging the average higher on the day. 3M (MMM) is up 3% on Thursday, climbing above $151 per share. UnitedHealth (UNH) added 1.65%, climbing above $471 per share and adding 8 points. UNH is the second-highest-weighted stock listed on the Dow Jones, and a few points added or removed from the share price has a pronounced impact on the Dow’s headline.
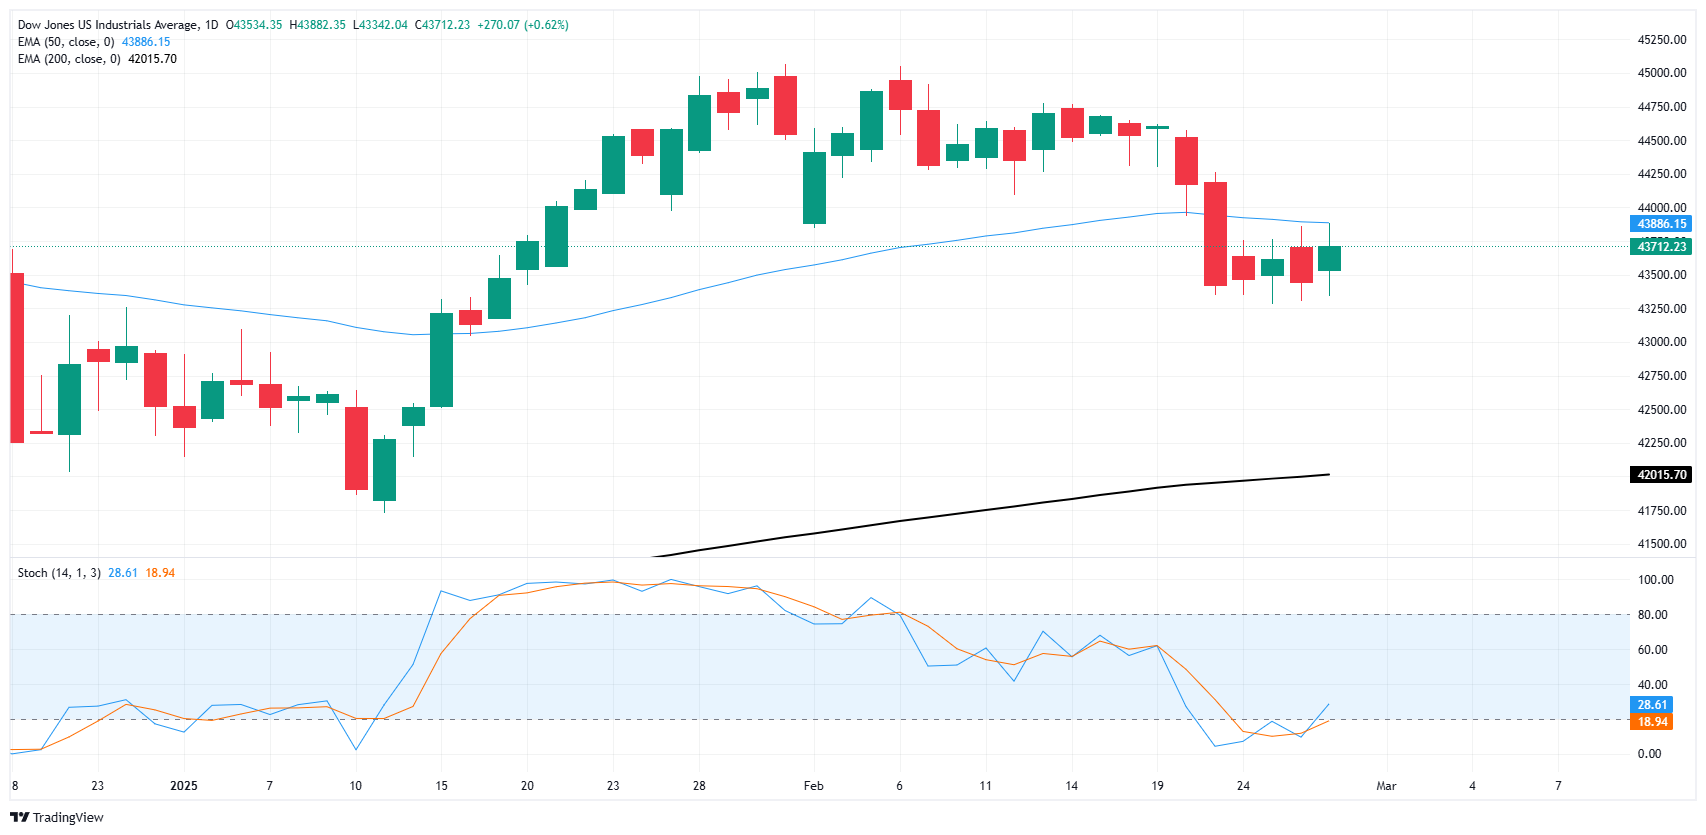
Dow Jones price forecast
A near-term consolidation pattern continues to cook into the Dow Jones chart, with price action hobbled just south of the 50-day Exponential Moving Average (EMA) near 43,885. Technical traders will be looking for an opportunity to step back into a bullish rebound with technical oscillators rolling over in oversold territory, but it won’t take much for a downside plunge to drag bids closer to the 200-day EMA parked near the 42,000 major price handle.
Dow Jones daily chart
Dow Jones FAQs
The Dow Jones Industrial Average, one of the oldest stock market indices in the world, is compiled of the 30 most traded stocks in the US. The index is price-weighted rather than weighted by capitalization. It is calculated by summing the prices of the constituent stocks and dividing them by a factor, currently 0.152. The index was founded by Charles Dow, who also founded the Wall Street Journal. In later years it has been criticized for not being broadly representative enough because it only tracks 30 conglomerates, unlike broader indices such as the S&P 500.
Many different factors drive the Dow Jones Industrial Average (DJIA). The aggregate performance of the component companies revealed in quarterly company earnings reports is the main one. US and global macroeconomic data also contributes as it impacts on investor sentiment. The level of interest rates, set by the Federal Reserve (Fed), also influences the DJIA as it affects the cost of credit, on which many corporations are heavily reliant. Therefore, inflation can be a major driver as well as other metrics which impact the Fed decisions.
Dow Theory is a method for identifying the primary trend of the stock market developed by Charles Dow. A key step is to compare the direction of the Dow Jones Industrial Average (DJIA) and the Dow Jones Transportation Average (DJTA) and only follow trends where both are moving in the same direction. Volume is a confirmatory criteria. The theory uses elements of peak and trough analysis. Dow’s theory posits three trend phases: accumulation, when smart money starts buying or selling; public participation, when the wider public joins in; and distribution, when the smart money exits.
There are a number of ways to trade the DJIA. One is to use ETFs which allow investors to trade the DJIA as a single security, rather than having to buy shares in all 30 constituent companies. A leading example is the SPDR Dow Jones Industrial Average ETF (DIA). DJIA futures contracts enable traders to speculate on the future value of the index and Options provide the right, but not the obligation, to buy or sell the index at a predetermined price in the future. Mutual funds enable investors to buy a share of a diversified portfolio of DJIA stocks thus providing exposure to the overall index.
-
18:50
US Dollar surges after strong GDP and inflation data
- US Dollar Index DXY jumps above 107.00 after a hotter-than-expected inflation component in GDP data.
- CME FedWatch Tool now shows a near 35% probability that rates will remain steady in June, with cuts still on the table.
- Focus will shift to labor market data from February to be released at the beginning of March.
The US Dollar Index (DXY), which tracks the performance of the US Dollar (USD) against six major currencies, is extending gains on Thursday, breaking above 107.00 as markets digest the second reading of United States (US) Gross Domestic Product (GDP) and its inflation components. Traders were caught off guard by hotter-than-expected Personal Consumption Expenditures (PCE) data, reinforcing concerns over persistent inflation.
Daily digest market movers: US Dollar rallies after GDP inflation surprises
- US GDP for Q4 2024 came in as expected at 2.3%, confirming steady economic growth.
- PCE inflation component exceeded expectations at 2.4%, while core PCE surged to 2.7%, compared to the 2.5% forecast.
- US Initial Jobless Claims rose to 224,000 for the week ending February 21, signaling slight labor market weakness.
- US Continuing Claims declined to 1.862 million, beating the 1.870 million forecast.
- On the foreign policy front, US President Donald Trump sowed confusion over tariff implementation, contradicting earlier statements.
- Markets react to tariff uncertainty as Trump doubles down on 25% levies on Canada and Mexico, which will come into effect on March 4.
DXY technical outlook: Bulls reclaim key levels but momentum remains fragile
The US Dollar Index has rebounded strongly above 107.00, reclaiming the 100-day Simple Moving Average (SMA) at 106.60. The Relative Strength Index (RSI) and Moving Average Convergence Divergence (MACD) indicate improving momentum, but the bullish push still needs confirmation. Resistance lies at 107.30, while support levels are seen at 106.60 and 106.00 in case of a reversal.
GDP FAQs
A country’s Gross Domestic Product (GDP) measures the rate of growth of its economy over a given period of time, usually a quarter. The most reliable figures are those that compare GDP to the previous quarter e.g Q2 of 2023 vs Q1 of 2023, or to the same period in the previous year, e.g Q2 of 2023 vs Q2 of 2022. Annualized quarterly GDP figures extrapolate the growth rate of the quarter as if it were constant for the rest of the year. These can be misleading, however, if temporary shocks impact growth in one quarter but are unlikely to last all year – such as happened in the first quarter of 2020 at the outbreak of the covid pandemic, when growth plummeted.
A higher GDP result is generally positive for a nation’s currency as it reflects a growing economy, which is more likely to produce goods and services that can be exported, as well as attracting higher foreign investment. By the same token, when GDP falls it is usually negative for the currency. When an economy grows people tend to spend more, which leads to inflation. The country’s central bank then has to put up interest rates to combat the inflation with the side effect of attracting more capital inflows from global investors, thus helping the local currency appreciate.
When an economy grows and GDP is rising, people tend to spend more which leads to inflation. The country’s central bank then has to put up interest rates to combat the inflation. Higher interest rates are negative for Gold because they increase the opportunity-cost of holding Gold versus placing the money in a cash deposit account. Therefore, a higher GDP growth rate is usually a bearish factor for Gold price.
-
17:32
United States 4-Week Bill Auction climbed from previous 4.245% to 4.25%
-
17:20
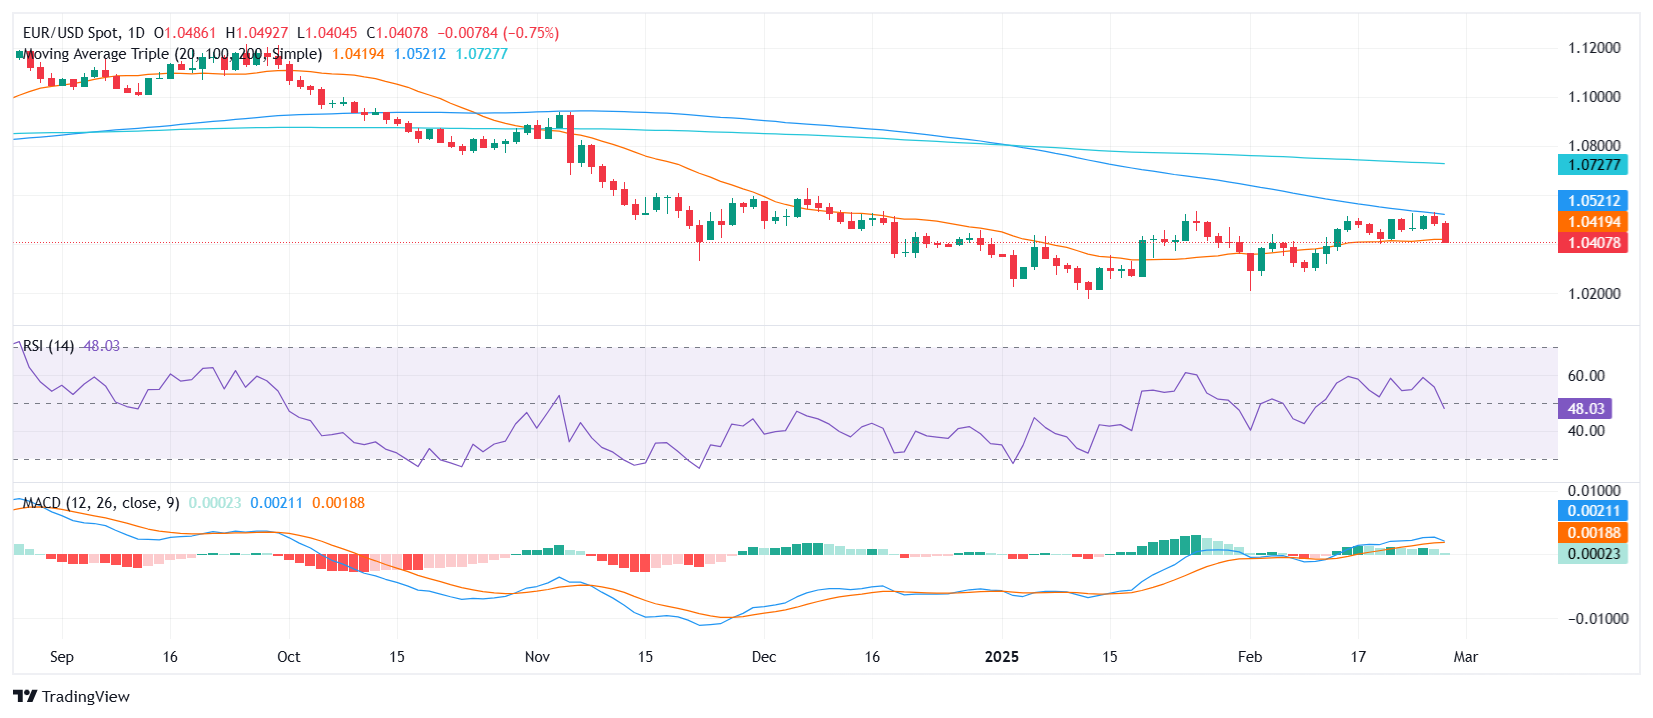
EUR/USD Price Analysis: Pair plunges after third rejection at 100-day SMA
- EUR/USD extends its decline, hitting its lowest level in two weeks.
- RSI continues to weaken in negative territory, reflecting intensifying bearish momentum.
The EUR/USD pair suffered a sharp decline on Thursday, sinking to its lowest level in two weeks as sellers took control following yet another failure at the 100-day Simple Moving Average (SMA). This marks the third consecutive rejection at this resistance level, reinforcing its significance as a major hurdle for bulls. The latest drop also saw the pair shedding over 0.70% from recent highs, putting additional pressure on its near-term outlook.
From a technical standpoint, indicators are tilting further into bearish territory. The Relative Strength Index (RSI) continues to decline within negative territory, reflecting growing downside momentum. Meanwhile, the Moving Average Convergence Divergence (MACD) histogram shows decreasing green bars, highlighting the gradual erosion of bullish pressure.
For now, the pair has lost grip of the 20-day SMA, increasing the risk of deeper losses. Conversely, a rebound from this area could open the door for another attempt to reclaim the 100-day SMA at around 1.0520.
EUR/USD daily chart
-
17:03
BoJ's Ueda: Will make policy decisions after looking at US policy impacts
Bank of Japan (BoJ) Governor Kazuo Ueda noted on Thursday that US policy uncertainty is impacting how central banks are doing their jobs, and highlighted that the BoJ will be watching data closely in the runup to possible widespread tariffs.
Key highlights
It was notable many countries warned of high uncertainty on global economic outlook.
There is still uncertainty on the US tariff policy, how other countries will respond, so need to scrutinise developments in gauging impact on global, Japanese economies.
Will make decision on monetary policy after scrutinising impact of US policies on global economy, markets, Japan's economy and prices.
Won't comment on recent moves in Japan's long-term interest rates.
When there are sharp moves in long-term rates that deviate from usual moves, we stand ready to use flexible market operations as an exceptional response.
-
17:01
United States Kansas Fed Manufacturing Activity remains at -5 in February
-
16:31
US President Donald Trump: Canada, Mexico tariffs coming March 4
United States (US) President Donald Trump hit social media on Thursday, taking to the streets of X (nee Twitter) to inform global markets that his planned 25% tariff package aimed at Mexico and Canada will now be coming into effect on March 4, rather than the April 2 date he reaffirmed just hours earlier. President Trump also informed markets that he plans to impose an additional 10% tariff on Chinese goods on that date.
At the same time, White House officials primed the pump on additional "reciprocal tariff" packages that are also in the pipeline aimed at a wide swath of countries, which will likely expand to include the UK and the European Union in general. More statements from President Trump are expected throughout the day.
Key highlights
Trump: Mexico and Canada tariffs on March 4. China to also be charged an additional 10% tariff on that date.
April 2 reciprocal tariff date remains in full force.
Trump admin official: trade to be part of Trump-Starmer discussions; the US wants reciprocal, equal trade with the UK.
-
16:30
United States EIA Natural Gas Storage Change above expectations (-276B) in February 21: Actual (-261B)
-
16:20
Mexican Peso tumbles as Trump confirms Mexico tariffs for March
- Mexican Peso weakens 0.33% as trade tensions escalate despite negotiation efforts.
- USD/MXN jumped to 20.54 as Trump moves forward with delayed tariffs.
- Mexico’s Balance of Trade deficit widens and the unemployment rate rises.
- US GDP remains unchanged while weak jobs data fuels slowdown fears.
The Mexican Peso (MXN) depreciated against the US Dollar (USD) after United States (US) President Donald Trump revealed that delayed tariffs to be enacted in February would kick in on March 4 for Mexico and Canada. Therefore, the USD/MXN pair, after trading near 20.36, rose to a daily high of 20.54 before stabilizing at current levels. The exotic pair trades at 20.42, up 0.33%
Bloomberg News reported that tariffs imposed on Mexico are moving forward despite Mexican officials' efforts to strike a deal that could pause tariffs indefinitely, at least until the renegotiation of the USMCA free trade agreement in 2026. Consequently, Mexico’s Secretary of Economy, Marcelo Ebrard, returned to Washington to continue discussions.
Data-wise, Mexico’s Balance of Trade registered a larger-than-expected deficit and the Unemployment Rate rose. In the United States, data was mixed, with an upbeat Durable Goods Orders report. Gross Domestic Product (GDP) in its second estimate remained unchanged, hinting at an economic slowdown. Worse-than-expected US jobs figures paint a difficult outlook for the US economy.
Kansas City Federal Reserve (Fed) President Jeffrey Schmid said they need to balance growth concerns and inflation and warned that the Fed might need to address both.
Mexico’s economic docket will be empty this week, unlike the US. The release of the Federal Reserve’s (Fed) preferred inflation gauge, the Core Personal Consumption Expenditure (PCE) Price Index, is eyed, along with the Chicago PMI.Daily digest market movers: Mexican Peso price action adrift to Trump’s tariffs rhetoric
- Mexico’s Balance of Trade deficit was more pronounced than the $-3.8 billion expected in January. It widened to $-4.55 billion after sustaining a surplus of $2.576 billion in December.
- The Unemployment Rate in Mexico rose by 2.7% as expected in January, up from December’s 2.4%.
- Washington is pushing the Mexican government to levy tariffs on Chinese imports.
- US Durable Goods Orders in January rose by 3.1% MoM following a -1.8% contraction in December, and crushed estimates of a 2% increase.
- The second estimate of GDP for the last quarter of 2024 was 2.3% QoQ, unchanged from estimates but below Q3’s 3.1% growth.
- On a bad note, Initial Jobless Claims for the week ending February 22 jumped to 242K, up from 220K revised, and exceeding projections of 221K.
- The swaps markets hint that the Federal Reserve might ease policy by 56.5 basis points, up from last week's 40 bps in 2025, via data from the Chicago Board of Trade (CBOT).
- Trade disputes between the US and Mexico remain prominent. Although the countries previously found common ground, USD/MXN traders should know that the 30-day pause is about to end, and tensions could trigger volatility in the pair during the rest of the week.
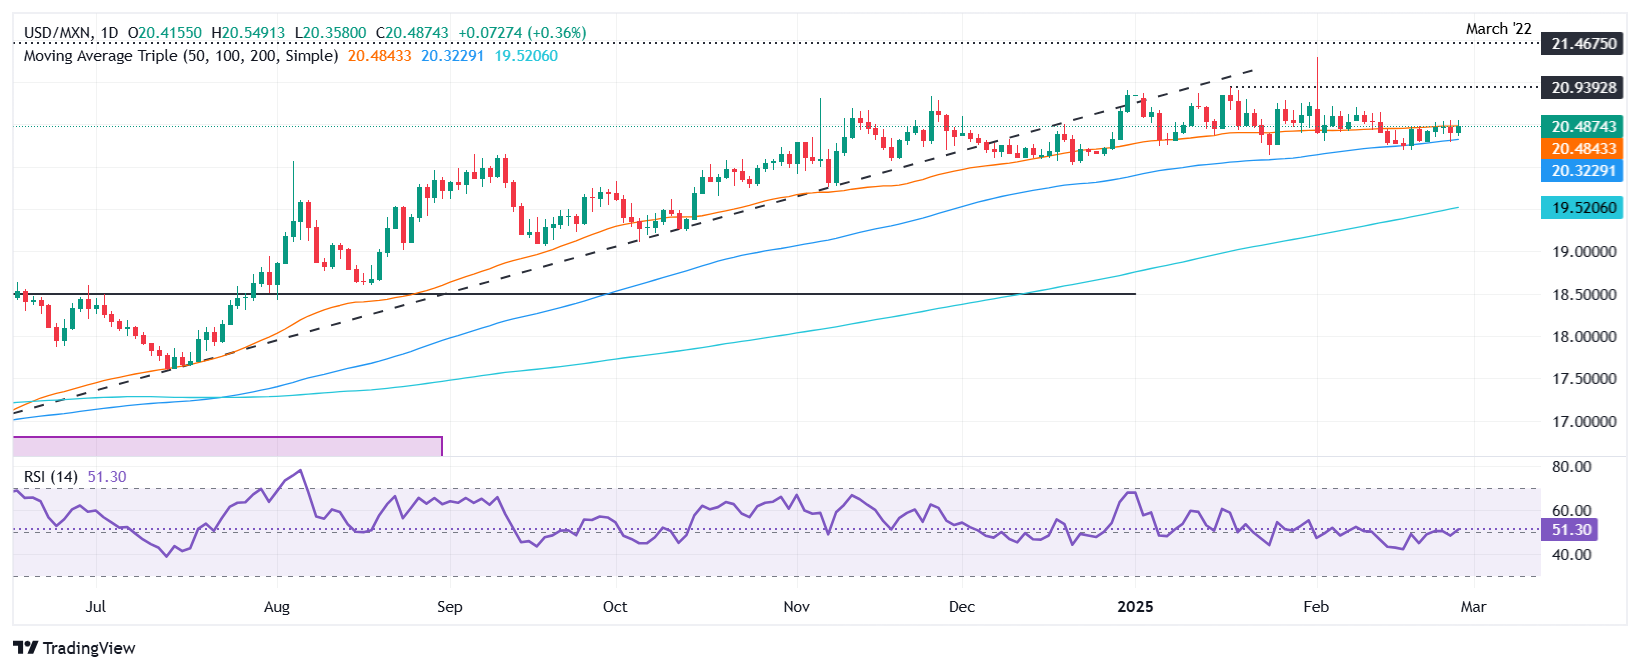
USD/MXN technical outlook: Mexican Peso drops as USD/MXN hurdles 50-day SMA
USD/MXN uptrend remains, though buyers remain unable to decisively crack the 50-day Simple Moving Average (SMA) at 20.45, which would open the door to testing 20.50. Momentum remains bullish, as depicted by the Relative Strength Index (RSI), which continues to aim higher, supported by Trump’s comments. Nevertheless, his rhetoric could trigger a swing and favor the Peso, which, as mentioned, remains heavily influenced by Trump.
Therefore, if USD/MXN pushes through 20.50, this could pave the way to challenge the January 17 high of 20.93, followed by 21.00 and the year-to-date (YTD) high of 21.28. On the flip side, if USD/MXN struggles at the 50-day SMA, it could drop to the 100-day SMA at 20.28, followed by the next support price level at 20.00.
Mexican Peso FAQs
The Mexican Peso (MXN) is the most traded currency among its Latin American peers. Its value is broadly determined by the performance of the Mexican economy, the country’s central bank’s policy, the amount of foreign investment in the country and even the levels of remittances sent by Mexicans who live abroad, particularly in the United States. Geopolitical trends can also move MXN: for example, the process of nearshoring – or the decision by some firms to relocate manufacturing capacity and supply chains closer to their home countries – is also seen as a catalyst for the Mexican currency as the country is considered a key manufacturing hub in the American continent. Another catalyst for MXN is Oil prices as Mexico is a key exporter of the commodity.
The main objective of Mexico’s central bank, also known as Banxico, is to maintain inflation at low and stable levels (at or close to its target of 3%, the midpoint in a tolerance band of between 2% and 4%). To this end, the bank sets an appropriate level of interest rates. When inflation is too high, Banxico will attempt to tame it by raising interest rates, making it more expensive for households and businesses to borrow money, thus cooling demand and the overall economy. Higher interest rates are generally positive for the Mexican Peso (MXN) as they lead to higher yields, making the country a more attractive place for investors. On the contrary, lower interest rates tend to weaken MXN.
Macroeconomic data releases are key to assess the state of the economy and can have an impact on the Mexican Peso (MXN) valuation. A strong Mexican economy, based on high economic growth, low unemployment and high confidence is good for MXN. Not only does it attract more foreign investment but it may encourage the Bank of Mexico (Banxico) to increase interest rates, particularly if this strength comes together with elevated inflation. However, if economic data is weak, MXN is likely to depreciate.
As an emerging-market currency, the Mexican Peso (MXN) tends to strive during risk-on periods, or when investors perceive that broader market risks are low and thus are eager to engage with investments that carry a higher risk. Conversely, MXN tends to weaken at times of market turbulence or economic uncertainty as investors tend to sell higher-risk assets and flee to the more-stable safe havens.
-
16:00
United States Pending Home Sales (YoY) dipped from previous -5% to -5.2% in January
-
16:00
United States Pending Home Sales (MoM) came in at -4.6%, below expectations (-1.3%) in January
-
15:29
Fed's Schmid: Uncertainty might also weigh on growth
Kansas City Federal Reserve President Jeff Schmid said on Thursday that recent surveys indicating a rise in consumer inflation expectations showed the central bank must stay focused on fully containing price pressures, noting it was a growing and potentially troubling concern for policymakers.
Key Quotes
He is more cautious about inflation given lack of progress, with growing concern over the recent increase in inflation expectations.
Expectations surveys are imperfect, but the recent sharp rise means the Fed cannot let its guard down.
Uncertainty might also weigh on growth.
Focus should remain on inflation to protect the Fed's credibility.
Preference is to keep shrinking the balance sheet and the Fed's financial footprint as much as possible.
There may be a need to rethink the concept of core inflation given that once-volatile food prices now behave more like other goods.
Energy prices remain highly volatile. -
14:54
GBP: Focus on PM Starmer visit to Washington – Scotiabank
Pound Sterling (GBP) is trading marginally higher against the USD on the session but Cable remains well below yesterday’s intraday high and the lack of new factors driving UK markets this morning suggests limited scope for gains to extend, Scotiabank's Chief FX Strategist Shaun Osborne notes.
GBP little changed on the day
"PM Starmer’s visit to Washington will be watched, however. Ukraine and broader security issues are top of the agenda but trade will also figure in talks."
"Sterling edged above 1.27 yesterday but failed to hold gains, closing back close to the day’s opening levels. The pattern of trade suggests the GBP’s recent rally may be stalling above the 100-day MA (support now at 1.2633). Underlying trends remain bullish, however, and a renewed push above 1.27 and through yesterday’s 1.2716 high will refresh the uptrend relatively easily."
-
14:49
EUR/USD: Gains are capped in low 1.05s – Scotiabank
The EUR remains largely range-bound in rather featureless trade.Spanish core CPI fell to 2.1% in February, the lowest since December 2021, hinting at some potential progress in Eurozone inflation, Scotiabank's Chief FX Strategist Shaun Osborne notes.
EUR holds range on the day
"Still, trends in the EUR are likely to be muted while it remains unclear what sort of tariff regime the EU is facing from the US. More range trading around 1.05 is likely in the short run. The EUR may get some modest support from cross flows where EUR/JPY appears to be rebounding firmly—again—from the upper 155 area."
"EUR gains remained capped in the low 1.05 area (100-day MA at 1.0523) but the single currency enjoys the support of bullish, if weak, trend momentum on the short-term oscillators which should keep the market supported on minor dips for now. Support is 1.0450 and 1.0390/00."
"Sustained gains through the low/mid 1.05 resistance zone should pave the way for a push higher to the 1.0650/1.0750 range."
-
14:45
CAD steady but fails to gain significantly – Scotiabank
The Canadian Dollar (CAD) is little changed against the stronger US Dollar (USD) on the session so far. Another, apparent tariff reprieve has not boosted the CAD significantly, Scotiabank's Chief FX Strategist Shaun Osborne notes.
CAD fails to gain significantly on latest tariff reprieve
"But was not clear from the president’s comments yesterday exactly what tariffs he was referring to when he said Canadian and Mexican tariffs would be implemented on April 2. Officials later indicated that March 4 remains a deadline for border tariffs. Implicitly, other (reciprocal) tariffs could also follow in April. Canadian diplomacy remains fully engaged with US counterparts, suggesting officials are taking nothing for granted."
"The CAD’s move off yesterday’s intraday low against the USD near 1.4370 signaled a short-term top (at least) in the USD rebound. The CAD has not been able to recover much ground, however, and continues to hold around the 40-day MA (1.4336) and near yesterday’s closing level."
"The USD has developed some bullish momentum on the short-term studies which will keep directional risks tilted towards more gains and limit the CAD’s ability to recover in the short run. Support is 1.4300 and 1.4250. Resistance is 1.4400 and 1.4475."
-
14:39
US GDP expands by 2.3% in Q4 as initially estimated
- US' GDP grew at an annual rate of 2.3% in the fourth quarter of 2024.
- The US Dollar Index stays in positive territory above 106.50.
The US Bureau of Economic Analysis (BEA) reported on Thursday that the United States' Gross Domestic Product (GDP) expanded at an annual rate of 2.3% in the fourth quarter. This reading matched the initial estimate and came in line with the market expectation.
"Real GDP was revised up by less than 0.1 percentage point from the advance estimate released last month, primarily reflecting upward revisions to government spending and exports that were partly offset by downward revisions to consumer spending and investment," the BEA explained in its press release.
Market reaction
The US Dollar Index clings to modest daily gains near 106.70 following this report.
-
14:37
USD posts limited gains amid tariff uncertainty – Scotiabank
The US Dollar (USD) is broadly firmer this morning but gains versus the majors are limited for the most part, leaving the currencies holding established trading ranges. European stocks have slipped a little while US equity futures are firmer so far. Bond markets are softer, with Treasurys underperforming, driving yields 4-5bps higher along the curve, Scotiabank's Chief FX Strategist Shaun Osborne notes.
USD trades mixed to marginally higher amid tariff uncertainty
"The JPY and CHF are underperforming among the majors while the MXN and CAD are relative out-performers among the G10 currencies, suggesting another punt in President Trump’s tariff deadlines(s) yesterday to early April is one factor shaping positioning among FX traders. Japan’s Vice Finance Minister endorsed market expectations for tighter BoJ policy but noted that vigilance was required against speculative market moves."
"Month-end demand may also be lifting the USD somewhat. Still, the USD may find it hard to progress more significantly. Recent gains are overshooting yield spreads—which have tended to narrow on aggregate versus the dollar’s major currency peers. Spread-based fair value for the DXY is close to 1 standard deviation below the spot value currently."
"Technical trends have softened somewhat also, with the DXY trading below its 100-day MA this week and barely managing to regain that level (106.66) today. Markets may be more sensitive to weak US economic reports following the slide in Consumer Confidence reported earlier this week and there is a fair amount of US data out this morning."
-
14:37
US: Initial Jobless Claims rose to 242K last week
- Initial Jobless Claims rose above consensus to 242K.
- Continuing Jobless Claims dropped to 1.862M in the week ending February 15.
US citizens filing new applications for unemployment insurance increased to 242K for the week ending February 22, as reported by the US Department of Labor (DoL) on Thursday. This print missed initial estimates and was higher than the previous week's revised tally of 220K (from 219K).
The report also highlighted a seasonally adjusted insured unemployment rate of 1.2%, while the four-week moving average rose by 8.5K to 224.00K from the prior week’s revised average.
Moreover, Continuing Jobless Claims went down by 5K to reach 1.862M for the week ending February 15.
Market reaction
The Greenback maintains its bullish attitude around 106.70 when tracked by the US Dollar Index (DXY), adding to Wednesday’s advance.
-
14:34
US Durable Goods Orders rise 3.1% in January vs. 2% expected
- Durable Goods Orders in the US rose at a stronger pace than expected in January.
- US Dollar Index stays in daily range above 106.50.
Durable Goods Orders in the US rose by 3.1%, or $8.7 billion, in January to $286 billion, the US Census Bureau reported on Thursday. This reading followed a 2.2% decrease reported in December and came in better than the market expectation for an increase of 2%.
"Excluding transportation, new orders were virtually unchanged," the Census Bureau noted in its press release. "Excluding defense, new orders increased 3.5%. Transportation equipment, also up following two consecutive monthly decreases, led the increase, $8.6 billion or 9.8%, to $96.5 billion."
Market reaction
These figures don't seem to be having a noticeable impact on the US Dollar's valuation. At the time of press, the US Dollar Index was up 0.16% on the day at 106.65.
-
14:32
GBP/JPY jumps to near 189.60 ahead of Trump-Starmer meet in Washington
- GBP/JPY climbs to near 189.60 as the Pound Sterling performs strongly ahead of a meeting between US President Trump and UK PM Starmer.
- BoE’s Dhingra endorses a swift policy-easing cycle to address weakening consumer demand.
- The BoJ is highly expected to tighten its monetary policy further this year.
The GBP/JPY pair advances to near 189.60 in North American trading hours on Thursday. The pair gains as the Pound Sterling (GBP) strengthens, with investors focusing on the meeting between United States (US) President Donald Trump and United Kingdom (UK) Prime Minister Keir Starmer, which is scheduled for Thursday.
British Pound PRICE Today
The table below shows the percentage change of British Pound (GBP) against listed major currencies today. British Pound was the strongest against the Japanese Yen.
USD EUR GBP JPY CAD AUD NZD CHF USD 0.05% -0.04% 0.28% 0.11% 0.08% 0.19% 0.35% EUR -0.05% -0.08% 0.30% 0.08% 0.04% 0.15% 0.30% GBP 0.04% 0.08% 0.42% 0.16% 0.12% 0.24% 0.39% JPY -0.28% -0.30% -0.42% -0.23% -0.26% -0.18% 0.00% CAD -0.11% -0.08% -0.16% 0.23% -0.03% 0.07% 0.23% AUD -0.08% -0.04% -0.12% 0.26% 0.03% 0.12% 0.26% NZD -0.19% -0.15% -0.24% 0.18% -0.07% -0.12% 0.14% CHF -0.35% -0.30% -0.39% -0.00% -0.23% -0.26% -0.14% The heat map shows percentage changes of major currencies against each other. The base currency is picked from the left column, while the quote currency is picked from the top row. For example, if you pick the British Pound from the left column and move along the horizontal line to the US Dollar, the percentage change displayed in the box will represent GBP (base)/USD (quote).
UK Starmer is expected to discuss trade policies with US Donald Trump as the latter has threatened to impose tariffs on his trading partners. Market participants expect Starmer-Trump discussions on tariffs to be healthy as Trump said earlier this month that he is not sure about imposing tariffs on the UK but was confident that a “deal could be made” as Prime Minister Keir Starmer has been "very nice".
On the monetary policy front, firm expectations that the Bank of England (BoE) will follow a moderate policy-easing cycle could keep the downside in the Pound Sterling limited. Traders have fully priced in two interest rate cuts by the BoE this year. Meanwhile, the BoE has already reduced its key borrowing rates by 25 basis points (bps) to 4.5% in the policy meeting earlier this month.
Contrary to market expectations, BoE Monetary Policy Committee (MPC) member Swati Dhingra expects the monetary easing cycle to be faster than market expectations due to weak consumer demand. "I know 'gradual' has been interpreted in the media as 25 basis points (bps) per quarter but cutting interest rates at this pace for the remainder of 2025 would still leave monetary policy in an undesirable restrictive position at the end of the year, Dhingra said in a speech at Birkbeck on Monday.
Meanwhile, the Japanese Yen (JPY) underperforms across the board despite firm expectations that the Bank of Japan (BoJ) will raise interest rates again this year. BoJ hawkish bets have accelerated due to inflation pressures settling above the 2% target for a longer period. Also, BoJ officials have been confident about further increases in wage growth.
Pound Sterling FAQs
The Pound Sterling (GBP) is the oldest currency in the world (886 AD) and the official currency of the United Kingdom. It is the fourth most traded unit for foreign exchange (FX) in the world, accounting for 12% of all transactions, averaging $630 billion a day, according to 2022 data. Its key trading pairs are GBP/USD, also known as ‘Cable’, which accounts for 11% of FX, GBP/JPY, or the ‘Dragon’ as it is known by traders (3%), and EUR/GBP (2%). The Pound Sterling is issued by the Bank of England (BoE).
The single most important factor influencing the value of the Pound Sterling is monetary policy decided by the Bank of England. The BoE bases its decisions on whether it has achieved its primary goal of “price stability” – a steady inflation rate of around 2%. Its primary tool for achieving this is the adjustment of interest rates. When inflation is too high, the BoE will try to rein it in by raising interest rates, making it more expensive for people and businesses to access credit. This is generally positive for GBP, as higher interest rates make the UK a more attractive place for global investors to park their money. When inflation falls too low it is a sign economic growth is slowing. In this scenario, the BoE will consider lowering interest rates to cheapen credit so businesses will borrow more to invest in growth-generating projects.
Data releases gauge the health of the economy and can impact the value of the Pound Sterling. Indicators such as GDP, Manufacturing and Services PMIs, and employment can all influence the direction of the GBP. A strong economy is good for Sterling. Not only does it attract more foreign investment but it may encourage the BoE to put up interest rates, which will directly strengthen GBP. Otherwise, if economic data is weak, the Pound Sterling is likely to fall.
Another significant data release for the Pound Sterling is the Trade Balance. This indicator measures the difference between what a country earns from its exports and what it spends on imports over a given period. If a country produces highly sought-after exports, its currency will benefit purely from the extra demand created from foreign buyers seeking to purchase these goods. Therefore, a positive net Trade Balance strengthens a currency and vice versa for a negative balance.
-
14:31
United States Durable Goods Orders ex Transportation below expectations (0.3%) in January: Actual (0%)
-
14:31
Canada Current Account registered at -4.99B, below expectations (-3.2B) in 4Q
-
14:30
United States Gross Domestic Product Price Index came in at 2.4%, above forecasts (2.2%) in 4Q
-
14:30
United States Durable Goods Orders ex Defense rose from previous -2.4% to 3.5% in January
-
14:30
United States Initial Jobless Claims registered at 242K above expectations (221K) in February 21
-
14:30
United States Continuing Jobless Claims registered at 1.862M, below expectations (1.87M) in February 14
-
14:30
United States Core Personal Consumption Expenditures (QoQ) above expectations (2.5%) in 4Q: Actual (2.7%)
-
14:30
United States Personal Consumption Expenditures Prices (QoQ) came in at 2.4%, above expectations (2.3%) in 4Q
-
14:30
United States Gross Domestic Product Annualized in line with expectations (2.3%) in 4Q
-
14:30
United States Initial Jobless Claims 4-week average rose from previous 215.25K to 224K in February 21
-
14:30
United States Durable Goods Orders above forecasts (2%) in January: Actual (3.1%)
-
14:30
Canada Current Account below expectations (-3.2B) in 4Q: Actual (-5B)
-
14:00
Russia Central Bank Reserves $ increased to $634.6B from previous $628.5B
-
13:30
US Dollar Index ticks up while Gold and yields fall after Trump sows confusion on tariffs
- The US Dollar continues its slight recovery with mostly broad gains against Asian currencies.
- Traders are gearing up for some heavy data on the economic calendar this Thursday.
- The US Dollar Index (DXY) is unable to pop above 107 for now with a heavy resistance ahead.
The US Dollar Index (DXY), which tracks the performance of the US Dollar (USD) against six major currencies, trades marginally higher around 106.60 at the time of writing on Thursday. The DXY is receiving a bit of a tailwind from the Gold and US yields sell-off. The move comes after United States (US) President Donald Trump spoke about tariffs during his first real cabinet meeting on Wednesday, leaving reports puzzled on what levies would be imposed to which countries and the timing.
The US President added that Europe must brace as well for a 25% tariff on autos and other things, but he did not specify when these levies would come into effect. Trump lashed out at the bloc saying it was created only “to screw the United States”.
Meanwhile, traders are bracing for several data releases at 13:30 GMT. Besides the weekly Jobless Claims numbers, the focus will be on the second reading of the US Gross Domestic Product (GDP) for the final quarter of 2024. The Personal Consumption Expenditures (PCE) components, both the headline and the core, will probably catch most of the attention as these quarterly numbers precede the monthly readings due on Friday.
Daily digest market movers: Does the man himself still know?
- Overnight, several US officials had to issue additional statements on the current timetable for US tariffs being imposed after the US President contradicted himself multiple times on what kind of tariffs would take place, when and for which countries. The troubled communication from Trump himself cast a fog over the tariff element, triggering a steep selloff in Gold (which was the tariff safe haven until now), Bloomberg reports.
- At 13:30 GMT, the main data elements for this Thursday are expected to be released:
- The second reading of the US Gross Domestic Product (GDP) for the fourth quarter of 2024:
- The GDP annualized is expected to remain unchanged at 2.3%.
- The headline preliminary Personal Consumption Expenditures (PCE) component should continue stable at 2.3% with the core number expected to come in unchanged at 2.5%.
- US Initial Jobless Claims for the week ending on February 21 should tick up to 221,000, coming from 219,000. The US Continuing Claims for the week ending on February 14 should surge to 1.870 million people against the previous 1.869 million people.
- The second reading of the US Gross Domestic Product (GDP) for the fourth quarter of 2024:
- At 16:00 GMT, the US Kansas Fed Manufacturing Activity Index for February will be released. No forecast is available with the previous reading at -5.
- Five US Federal Reserve (Fed) officials are set to speak:
- At 15:00 GMT, Federal Reserve Vice Chair for Supervision Michael Barr delivers a speech on "Novel Activity Supervision" at the Bank and Fintech Arrangements TechSprint event in Washington, D.C.
- At 16:45 GMT, Federal Reserve Governor Michelle Bowman gives a speech focusing on Community Banking at the Fort Hays State University Robbins Banking Institute Lecture Series in Hays, Kansas.
- At 18:00 GMT, Federal Reserve Bank of Richmond President Thomas Barkin will speak about "Inflation then and now", in Fayetteville Cumberland Economic Development, North Carolina.
- Just 15 minutes later, at 18:15 GMT, Federal Reserve Bank of Cleveland President and Chief Executive Officer Beth M. Hammack participates in the “2025 Bank Regulation Research Conference” at the Columbia University/Bank Policy Institute, New York.
- Rounding up at 20:15 GMT Federal Reserve Bank of Philadelphia President Patrick T. Harker will discuss the economic outlook at the Lyons Economic Forecast, presented by the University of Delaware's Center for Economic Education and Entrepreneurship, in Newark, Delaware.
- Equities are mixed with European indices down over 1% due to the US tariff threat and US indices up on the day, still digesting the Nvidia earnings.
- The CME Fedwatch Tool projects a 33.0% chance that the interest rates will remain at the current range in June, with the rest showing a possible rate cut.
- The US 10-year yield trades around 4.30%, further down from last week’s high at 4.574%.
US Dollar Index Technical Analysis: Dropping the ball
The US Dollar Index (DXY) is not really thriving after President Trump’s overnight comments on tariffs. Again, it looks like the US Dollar cannot enjoy a very light part of the current market flow, offset largely by the continuous drop in US yields. Look out for inflation-sensitive data that might counter the current Federal Reserve’s rate cut expectations, pushing US yields back higher and triggering a stronger Greenback.
On the upside, the 100-day Simple Moving Average (SMA) could limit bulls buying the Greenback near 106.75. From there, the next leg could go up to 107.35, a pivotal support from December 2024 and January 2025. In case US yields recover and head higher again, even 107.95 (55-day SMA) could be tested.
On the downside, if the DXY fails to hold above the 106.52 level, another leg lower might be needed to entice Dollar bulls to reenter near 105.89 or even 105.33.
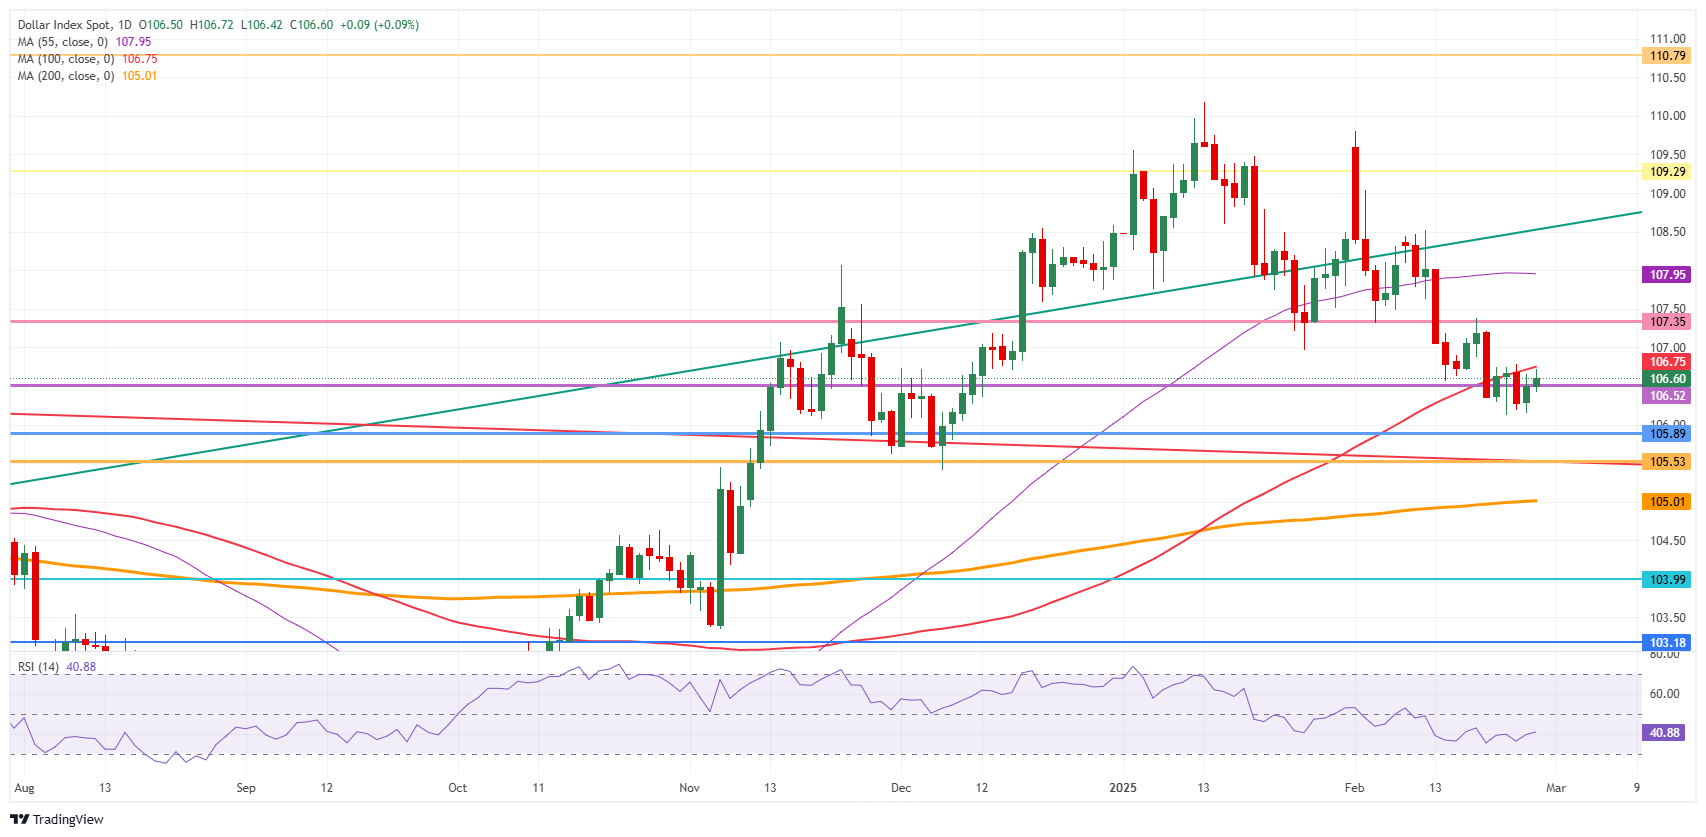
US Dollar Index: Daily Chart
US-China Trade War FAQs
Generally speaking, a trade war is an economic conflict between two or more countries due to extreme protectionism on one end. It implies the creation of trade barriers, such as tariffs, which result in counter-barriers, escalating import costs, and hence the cost of living.
An economic conflict between the United States (US) and China began early in 2018, when President Donald Trump set trade barriers on China, claiming unfair commercial practices and intellectual property theft from the Asian giant. China took retaliatory action, imposing tariffs on multiple US goods, such as automobiles and soybeans. Tensions escalated until the two countries signed the US-China Phase One trade deal in January 2020. The agreement required structural reforms and other changes to China’s economic and trade regime and pretended to restore stability and trust between the two nations. However, the Coronavirus pandemic took the focus out of the conflict. Yet, it is worth mentioning that President Joe Biden, who took office after Trump, kept tariffs in place and even added some additional levies.
The return of Donald Trump to the White House as the 47th US President has sparked a fresh wave of tensions between the two countries. During the 2024 election campaign, Trump pledged to impose 60% tariffs on China once he returned to office, which he did on January 20, 2025. With Trump back, the US-China trade war is meant to resume where it was left, with tit-for-tat policies affecting the global economic landscape amid disruptions in global supply chains, resulting in a reduction in spending, particularly investment, and directly feeding into the Consumer Price Index inflation.
-
13:00
Mexico Jobless Rate s.a remains at 2.6% in January
-
13:00
Mexico Trade Balance s/a, $ increased to $-0.423B in January from previous $-0.684B
-
13:00
Mexico Trade Balance, $ below forecasts ($-3.8B) in January: Actual ($-4.558B)
-
13:00
Mexico Jobless Rate meets forecasts (2.7%) in January
-
12:18
USD/CAD flattens while Trump postpones tariff plans for Canada and Mexico again
- USD/CAD trades sideways around 1.4335 while the Canadian Dollar strengthens as Trump provides another month-long extension for tariffs on Canada and Mexico.
- The US Dollar steadies as Trump reiterates tariff threats on the Eurozone.
- Investors await the US PCE inflation and the Canadian GDP data, scheduled for Friday.
The USD/CAD pair trades flat around 1.4335 in European trading hours on Thursday. The Loonie pair consolidates as the impact of steadiness in the US Dollar (USD) has been offset by the upbeat Canadian Dollar (CAD).
Canadian Dollar PRICE Today
The table below shows the percentage change of Canadian Dollar (CAD) against listed major currencies today. Canadian Dollar was the strongest against the Japanese Yen.
USD EUR GBP JPY CAD AUD NZD CHF USD 0.05% -0.04% 0.54% -0.08% -0.01% 0.18% 0.43% EUR -0.05% -0.09% 0.50% -0.12% -0.05% 0.13% 0.38% GBP 0.04% 0.09% 0.61% -0.03% 0.04% 0.22% 0.48% JPY -0.54% -0.50% -0.61% -0.62% -0.56% -0.40% -0.12% CAD 0.08% 0.12% 0.03% 0.62% 0.08% 0.26% 0.51% AUD 0.01% 0.05% -0.04% 0.56% -0.08% 0.18% 0.45% NZD -0.18% -0.13% -0.22% 0.40% -0.26% -0.18% 0.26% CHF -0.43% -0.38% -0.48% 0.12% -0.51% -0.45% -0.26% The heat map shows percentage changes of major currencies against each other. The base currency is picked from the left column, while the quote currency is picked from the top row. For example, if you pick the Canadian Dollar from the left column and move along the horizontal line to the US Dollar, the percentage change displayed in the box will represent CAD (base)/USD (quote).
The US Dollar Index (DXY), which tracks the Greenback’s value against six major currencies, rises to near 106.70 as United States (US) President Donald Trump has reiterated fears of tariffs on the Eurozone. On Wednesday, Trump said that he will be announcing 25% tariffs on “cars and other things” from Eurozone “very soon”. Such a scenario would escalate global trade war tensions and will weigh on economic growth across the globe. President Trump’s tariff threats have improved the safe-haven demand of the US Dollar.
Market participants are also cautious ahead of the US Personal Consumption Expenditure Price Index (PCE) data for January, which will be released on Friday. The US PCE inflation data is expected to influence market expectations for the Federal Reserve’s (Fed) monetary policy outlook. According to the CME FedWatch tool, traders are confident that the Fed will keep interest rates in their current range of 4.25%-4.50% in the March and May policy meetings.
Meanwhile, the CAD outperforms its peers as Donald Trump kept tariff plans for Canada and Mexico on hold for another month and provided a new deadline of April 2. Earlier, the deadline for slapping levies by the US on its North American allies was March 4, which was postponed after they agreed to tighten border securities to restrict flow of fentanyl and undocumented immigrants into the economy.
On the economic front, investors await the Canadian Gross Domestic Product (GDP) data for the December month and the last quarter of the previous data, which will be released on Friday. The Canadian economy is expected to have grown by 0.3% and 1.9% in December and in the October-December period of 2024 on an annualized basis, respectively.
US Dollar FAQs
The US Dollar (USD) is the official currency of the United States of America, and the ‘de facto’ currency of a significant number of other countries where it is found in circulation alongside local notes. It is the most heavily traded currency in the world, accounting for over 88% of all global foreign exchange turnover, or an average of $6.6 trillion in transactions per day, according to data from 2022. Following the second world war, the USD took over from the British Pound as the world’s reserve currency. For most of its history, the US Dollar was backed by Gold, until the Bretton Woods Agreement in 1971 when the Gold Standard went away.
The most important single factor impacting on the value of the US Dollar is monetary policy, which is shaped by the Federal Reserve (Fed). The Fed has two mandates: to achieve price stability (control inflation) and foster full employment. Its primary tool to achieve these two goals is by adjusting interest rates. When prices are rising too quickly and inflation is above the Fed’s 2% target, the Fed will raise rates, which helps the USD value. When inflation falls below 2% or the Unemployment Rate is too high, the Fed may lower interest rates, which weighs on the Greenback.
In extreme situations, the Federal Reserve can also print more Dollars and enact quantitative easing (QE). QE is the process by which the Fed substantially increases the flow of credit in a stuck financial system. It is a non-standard policy measure used when credit has dried up because banks will not lend to each other (out of the fear of counterparty default). It is a last resort when simply lowering interest rates is unlikely to achieve the necessary result. It was the Fed’s weapon of choice to combat the credit crunch that occurred during the Great Financial Crisis in 2008. It involves the Fed printing more Dollars and using them to buy US government bonds predominantly from financial institutions. QE usually leads to a weaker US Dollar.
Quantitative tightening (QT) is the reverse process whereby the Federal Reserve stops buying bonds from financial institutions and does not reinvest the principal from the bonds it holds maturing in new purchases. It is usually positive for the US Dollar.
-
11:58
US copper surges on tariff risks – ING
COMEX copper futures surged after President Donald Trump ordered the US Commerce Department to investigate possible import tariffs on copper, ING’s commodity analysts Warren Patterson and Ewa Manthey notes.
Copper prices on the LME and COMEX continue to diverge
"The department has up to 270 days to report back to Trump. Copper prices on the LME and COMEX continue to diverge. LME copper is up around 8% year-to-date, while prices on COMEX have surged around 14%."
"Renewed tariff threats saw the COMEX-LME arbitrage spread widen back towards $900/t. There’s additional upside risk for copper in New York if tariffs are applied. The spread risks a pullback if tariffs fall short of expectations."
"The US produces around 5% of global copper mining output. Its reserves are also at around 5% of the total, according to the US Geological Survey (USGS). The country’s production has been on a downtrend -- dropping about 20% over the last decade, according to USGS. Meanwhile, the US imports roughly 45% of copper needs. It might be challenging to fill that gap with domestic production."
-
11:54
EUR/CHF: Potential support is located at 0.9250/0.9210 – Societe Generale
EUR/CHF has retracted after facing strong resistance at last September high of 0.9510, Societe Generale's FX analysts report.
A short-term bounce is likely towards 0.9460
"Daily MACD has dipped within negative territory denoting lack of steady upward momentum. First support is located at January trough of 0.9325. A short-term bounce is likely towards 200-DMA at 0.9460. If the pair fails to overcome the Moving Average, the phase of pullback could extend."
"Below 0.9325, next potential support is located at the graphical levels of 0.9250/0.9210 representing the lows 2023/2024."
-
11:48
Gas: TTF sell-off continues – ING
European natural gas prices came under additional pressure yesterday. TTF fell by almost 6.7%, leaving prices at their lowest level since mid-December, ING’s commodity analysts Warren Patterson and Ewa Manthey notes.
Market is starting to price in possible Russia-Ukraine peace deal
"From a technicals perspective, the scale of the move in recent weeks has left the market in oversold territory. Investment funds have been aggressively reducing their net long in TTF, selling 27.4TWh over the last reporting week. This left funds with a net long of 231.3TWh. Recent mild weather has contributed to the weakness."
"However, with storage at just 40% full, the region faces challenges in refilling storage, relying more on LNG imports. The recent price weakness has TTF trading below spot Asian LNG, which should see slower flows into Europe."
"The scale of the move lower also suggests the market is starting to price in prospects for a Russia-Ukraine peace deal, one that could include the resumption of some Russian pipeline gas to Europe. If this happens, it changes the outlook for the European market significantly."
-
11:46
USD/CNH: Price movements are likely part of a range trading phase – UOB Group
Current US Dollar (USD) price movements are likely part of a range trading phase vs Chinese Yuan (CNH), probably between 7.2530 and 7.2750. In the longer run, downward momentum has largely faded; USD is expected to trade in a 7.2400/7.2900 range for the time being, UOB Group’s FX analysts Quek Ser Leang and Peter Chia note.
Downward momentum has largely faded
24-HOUR VIEW: "Yesterday, when USD was at 7.2500, we noted 'a slight increase in downward momentum.' We added, USD 'could edge lower, but there are a pair of strong support levels at 7.2420 and 7.2350.' Our view did not materialise, as USD traded between 7.2481 and 7.2678, closing at 7.2660. The current price movements are likely part of a range trading phase, probably between 7.2530 and 7.2750."
1-3 WEEKS VIEW: "Our most recent narrative was from two days ago (25 Feb, spot at 7.2550), wherein 'the failure to hold below 7.2300 has diminished the likelihood of further decline.' Yesterday, USD edged to a high of 7.2678. While our ‘strong resistance’ level at 7.2705 has not been clearly breached yet, downward momentum has largely faded. USD has likely entered a range trading phase and is expected to trade between 7.2400 and 7.2900 for the time being."
-
11:42
Italy 10-y Bond Auction declined to 3.55% from previous 3.6%
-
11:42
Italy 5-y Bond Auction fell from previous 2.95% to 2.93%
-
11:42
CAD: The resurgent Liberals – ING
The Canadian Dollar (CAD) remains quite soft given the threat of tariffs, ING’s FX analysts Chris Turner notes.
The next move in the CAD is probably lower
"These could come for any number of reasons. And the renegotiation of the USMCA looks like a difficult proposition where the stated aim from Washington now seems to be restricting Canada and Mexico's access to third markets, i.e. China. This looks to be a difficult negotiation and one where Washington will use the big stick of tariffs as a threat."
"The backlash against Washington's policies in Canada has seen resurgent support for the Liberal party as it stands up to the tariff threat. Politicians around the world might be inspired by the Liberals to stand and fight. This could lead to more pricing of a global trade war, which is bad news for the commodities complex."
"The next move in the Canadian dollar is probably lower from here, with 1.4250/4280 now the near-term base."
-
11:39
JPY: Far enough for the time being – ING
The drop in US Treasury yields has certainly weighed on USD/JPY. But this pair has also been hyper-sensitive to expected Bank of Japan rate adjustments, ING’s FX analysts Chris Turner notes.
USD/JPY can try and build a floor in the 148.70/149.00 area
"The next input here will be tonight's release of the February Tokyo CPI. The headline number is expected to soften a little, but the ex-food and energy number is expected to drift back up to 2.0%. This could continue the momentum toward earlier BoJ rate hikes. And at ING, we think the risk of a 25bp rate hike in May is sorely under-priced at just 20%."
"This all sounds yen bullish. Yet our rate strategy team is reluctant to chase the US 10-year Treasury yield down to 4.00% and we suspect that USD/JPY can try and build a floor in the 148.70/149.00 area. Unlike last July/August, speculative positioning has not been excessively short yen – indeed speculative positioning is now getting stretched long yen."
-
11:38
USD/JPY: Weakness has not stabilised – UOB Group
Price movements are likely part of a range trading phase, probably between 148.55 and 149.75. In the longer run, USD weakness has not stabilised vs Japanese Yen (JPY); pace of any further decline is likely slower. The next level to monitor is 147.70, UOB Group’s FX analysts Quek Ser Leang and Peter Chia note.
USD weakness has not stabilised
24-HOUR VIEW: "After USD plummeted to 148.56 on Tuesday and then rebounded, we indicated yesterday (Wednesday) that 'despite the sharp drop from the high, there has been no significant increase in momentum.' However, we were of the view that 'there is a chance for USD to retest the 148.55 level.' USD subsequently briefly dipped to 148.61, rebounded to 149.88, and then pulled back to close largely unchanged at 149.08 (+0.04%). The price movements are likely part of a range trading phase, probably between 148.55 and 149.75."
1-3 WEEKS VIEW: "Our update from yesterday (26 Feb, spot at 149.15) is still valid. As highlighted, although the USD weakness from early last week has not stabilised, oversold conditions suggest the pace of any further decline is likely to be slower. Overall, only a breach of 150.20 (‘strong resistance’ level was at 150.55 yesterday) would indicate that the weakness has stabilised. Until then, there is a chance for USD to drop further, possibly to 147.70."
-
11:30
Belgium Consumer Price Index (MoM) declined to 0.2% in February from previous 1.39%
-
11:30
Belgium Consumer Price Index (YoY) down to 3.55% in February from previous 4.08%
-
11:20
Silver Price Forecast: XAG/USD remains below $32 as US yields rebounds ahead of US PCE Inflation
- Silver price faces pressure around $32.00 as US Treasury yields gains ground ahead of the US PCE inflation data for February.
- US President Trump reiterates threats to impose tariffs on Eurozone.
- Investors seek further development on Russia-Ukraine peace.
Silver price (XAG/USD) continues to face selling pressure around $32.00. The white metal is down an almost 0.3% to near $31.70 in European trading hours on Thursday as United States (US) bond yields have bounced back after a six-day losing streak ahead of the US Personal Consumption Expenditure Price Index (PCE) data for January, which will be released on Friday.
10-year US Treasury yields is up 1.3% to near 4.31% at the press time. Technically, higher yields on interest-bearing assets weighs on non-yielding assets, such as Silver.
Economists expect the US core PCE inflation – which excludes volatile food and energy prices – to have decelerated to 2.6% from 2.8% in December on year. Month-on-month inflation data is estimated to have grown by 0.3%, faster than the former reading of 0.2%.
Investors will pay close attention to the US core PCE inflation data as it is will influence market expectations for the Federal Reserve’s (Fed) monetary policy outlook, being a Fed’s preferred inflation gauge.
Meanwhile, US President Donald Trump’s tariff agenda continues to support the Silver price. On Wednesday, Trump reiterates threats to impose 25% tariffs on cars and other things imported from the Eurozone.
On the geopolitical front, investors await meeting of European leaders with United Kingdom (UK) Prime Minister Keir Starmer to discuss over President Trump’s attempt to end war in Ukraine quickly.
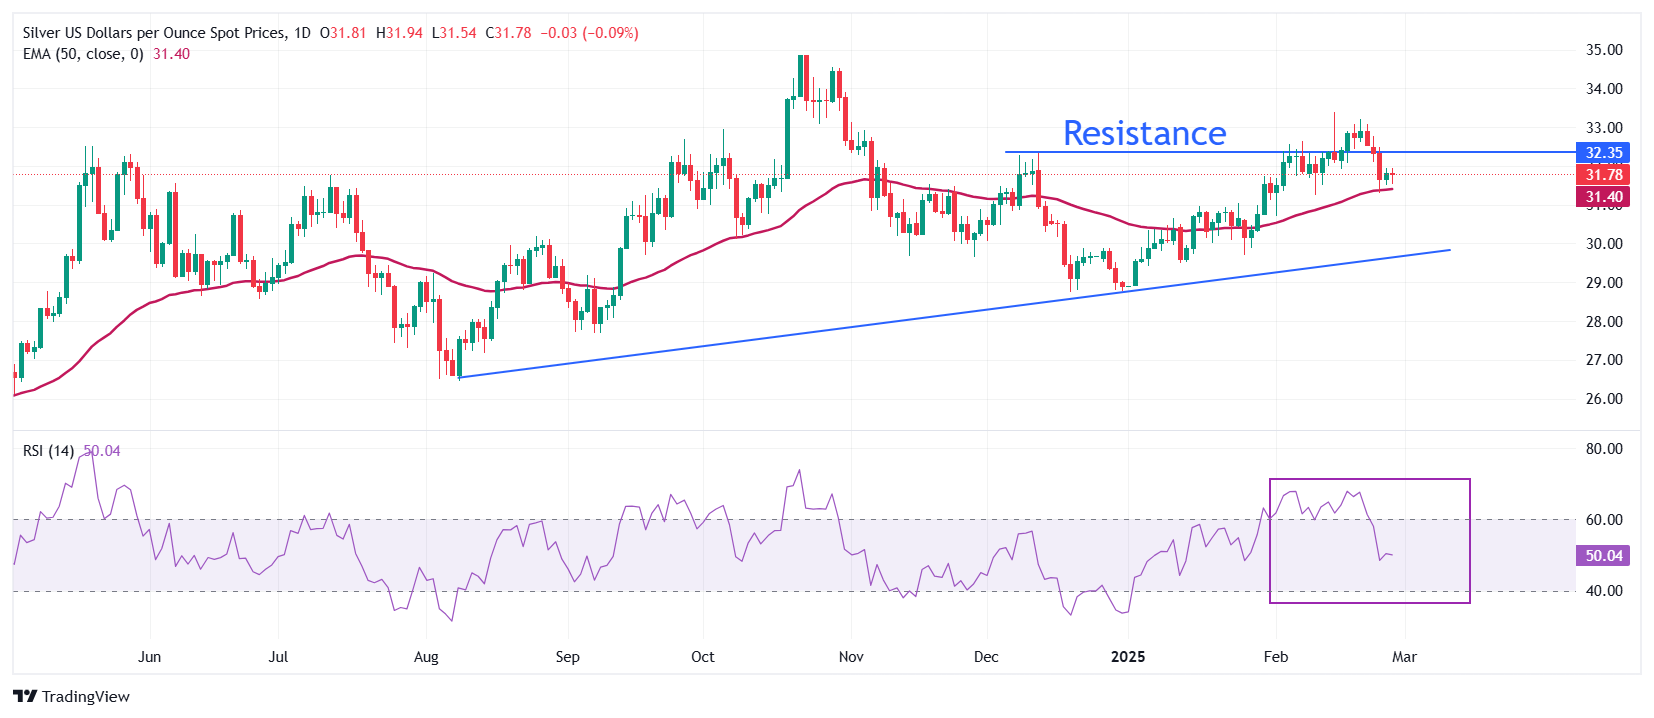
Silver technical analysis
Silver price slides below $32 after failing to sustain above the December 12 high of $32.33. The asset has fallen to near the 50-day Exponential Moving Average (EMA), which trades around $31.40.
The 14-day Relative Strength Index (RSI) falls inside the 40.00-60.00 range, suggesting that the bullish momentum has been faded. However, the bullish bias remains intact.
Looking down, the upward-sloping trendline from the August 8 low of $26.45 will act as key support for the Silver price around $30.00. While, the February 14 high of $33.40 will be the key barrier.
Silver daily chart
Silver FAQs
Silver is a precious metal highly traded among investors. It has been historically used as a store of value and a medium of exchange. Although less popular than Gold, traders may turn to Silver to diversify their investment portfolio, for its intrinsic value or as a potential hedge during high-inflation periods. Investors can buy physical Silver, in coins or in bars, or trade it through vehicles such as Exchange Traded Funds, which track its price on international markets.
Silver prices can move due to a wide range of factors. Geopolitical instability or fears of a deep recession can make Silver price escalate due to its safe-haven status, although to a lesser extent than Gold's. As a yieldless asset, Silver tends to rise with lower interest rates. Its moves also depend on how the US Dollar (USD) behaves as the asset is priced in dollars (XAG/USD). A strong Dollar tends to keep the price of Silver at bay, whereas a weaker Dollar is likely to propel prices up. Other factors such as investment demand, mining supply – Silver is much more abundant than Gold – and recycling rates can also affect prices.
Silver is widely used in industry, particularly in sectors such as electronics or solar energy, as it has one of the highest electric conductivity of all metals – more than Copper and Gold. A surge in demand can increase prices, while a decline tends to lower them. Dynamics in the US, Chinese and Indian economies can also contribute to price swings: for the US and particularly China, their big industrial sectors use Silver in various processes; in India, consumers’ demand for the precious metal for jewellery also plays a key role in setting prices.
Silver prices tend to follow Gold's moves. When Gold prices rise, Silver typically follows suit, as their status as safe-haven assets is similar. The Gold/Silver ratio, which shows the number of ounces of Silver needed to equal the value of one ounce of Gold, may help to determine the relative valuation between both metals. Some investors may consider a high ratio as an indicator that Silver is undervalued, or Gold is overvalued. On the contrary, a low ratio might suggest that Gold is undervalued relative to Silver.
-
11:20
USD: Tariff threats have diminishing market impact – ING
FX volatility levels are drifting toward the lower end of two-month ranges as major FX pairs consolidate. The tariff threat remains real, although it is having a diminishing impact on markets, ING’s FX analysts Chris Turner notes.
FX market doesn't believe in tariff talks without tariffs
"President Trump's threat yesterday that the EU (some sectors or the whole bloc?) would be hit with 25% tariffs in April only saw EUR/USD come off 20-30 pips. The FX market now sees a familiar pattern with the threat, and then the deadline subsequently being pushed back. That was on show yesterday with the presumed 4 March deadline for Canada and Mexico to tighten borders being pushed back into early April. In a way, the FX market will now only believe tariffs when they see them."
"On the other side of the Atlantic, European asset markets are performing well. Equity benchmarks are touching their highs of the year and we're certainly seeing Ukraine-related markets, such as CEE currencies, Ukraine Eurobonds all bid and European gas prices offered. There must be speculation that Friday's signing of a US-Ukraine mineral deal will ultimately lead to security guarantees and a ceasefire. Of course, this is far from guaranteed."
"Within those two defining factors sit internal US developments. We've seen the USD hit recently on weakness in the US consumer. And a jump today in the US weekly jobless claims data is probably the biggest risk to the dollar in the very short term. The 4Q24 US GDP revision probably won't be much of a market mover. There will also be a continuing focus on the efforts of Elon Musk to trim the US government."
-
11:04
NZD/USD: Has a chance to decline further – UOB Group
New Zealand Dollar (NZD) could decline further vs US Dollar (USD), but it does seem to have enough momentum to break and remain below 0.5680. In the longer run, if NZD breaks and remains below 0.5680, it could trigger a decline to 0.5645, UOB Group’s FX analysts Quek Ser Leang and Peter Chia note.
NZD can decline towards 0.5645
24-HOUR VIEW: "Our view for NZD to 'trade in a range of 0.5715/0.5755 range' yesterday was incorrect. Instead of trading in a range, NZD fell to 0.5689. Today, NZD could decline further, but it does not seem to have enough momentum to break and remain below 0.5680. The major support at 0.5645 is highly unlikely to come into view. On the upside, resistance levels are at 0.5715 and 0.5735."
1-3 WEEKS VIEW: "We highlighted two days ago (25 Feb, spot at 0.5735) that 'the current price movements are part of a 0.5680/0.5780 range.' Yesterday, NZD fell to a low of 0.5689, closing at 0.5697, lower by 0.39%. Downward momentum is beginning to build, and if NZD breaks and remains below 0.5680, it could trigger a decline to 0.5645. To sustain the buildup in momentum, NZD must not break above 0.5755."
-
11:03
EUR/USD drops as Trump reiterates tariff threats on Eurozone
- EUR/USD falls to near 1.0460 as US President Trump reiterates threats to impose 25% tariffs on cars and other imports from the Eurozone.
- The US Dollar steadies as Trump tariff threats have improved its safe-haven appeal.
- Investors await the US PCE inflation data for January and preliminary HICP data of major Eurozone nations for February, scheduled on Friday.
EUR/USD faces pressure below the psychological level of 1.0500 in European trading hours on Thursday. The major currency pair drops as United States (US) President Donald Trump reiterated tariff threats on the Eurozone.
President Trump said in a press conference on Wednesday that he will announce 25% tariffs on “cars and other things” on the Eurozone “very soon.” However, Trump didn’t provide a timeline for the tariff imposition.
In response to Trump’s tariff threats, a European Commission (EC) spokesperson said, "The EU will react firmly and immediately against unjustified barriers to free and fair trade, including when tariffs are used to challenge legal and non-discriminatory policies.”
A tariff war between the US and the Eurozone would make the Eurozone economy vulnerable to growth, which is already fractured due to weak demand. Such a scenario would weigh on the Euro (EUR).
Meanwhile, uncertainty over the outcome of negotiations to form a German coalition government has also kept the Euro (EUR) on the backfoot. Victorious Frederich Merz’s conservative Christian Democratic Union of Germany (CDU) will most likely form the government with outgoing Chancellor Olaf Scholz’s Social Democratic Party of Germany (SPD).
On Wednesday, Bundesbank President Joachim Nagel said in an interview with Reuters on the sidelines of a meeting of G20 finance chiefs that the new German government should address “structural faults” in the economy quickly to improve “Germany’s competitiveness”.
Daily digest market movers: EUR/USD remains on backfoot as US Dollar steadies
- EUR/USD stays under pressure as the US Dollar (USD) holds onto Wednesday’s gains. Tariff threats from President Donald Trump to the Eurozone have improved safe-haven demand for the US Dollar. However, the upside in the USD remains capped due to an increase in Federal Reserve (Fed) dovish bets.
- In Thursday’s session, investors will focus on US Durable Goods Orders for January, Initial Jobless Claims data for the week ending February 21, and the revised Q4 Gross Domestic Product (GDP) data.
- Market participants have become increasingly confident that the Fed could reduce interest rates in the June policy meeting after keeping in the current range of 4.25%-4.50% in the March and May meetings. According to the CME FedWatch tool, there is a 68% chance that the Fed can reduce interest rates in the June policy meeting.
- Traders raised bets supporting the Fed resuming the policy-easing cycle in June due to a decline in the US service sector activity in February, according to the flash S&P Global Purchasing Managers Index (PMI) report. Also, a sharp decline in the Consumer Confidence data in February has raised concerns over the Fed maintaining a restrictive monetary policy stance for longer. For more cues on the interest rate outlook, investors await the US Personal Consumption Expenditures Price Index (PCE) data for January, which will be released on Friday.
- On the Eurozone front, investors await the flash inflation data of Germany and its six states, France and Italy, for February, which will be released on Friday. The inflation data will influence market expectations for the European Central Bank’s (ECB) monetary policy outlook.
Technical Analysis: EUR/USD faces pressure above 1.0500
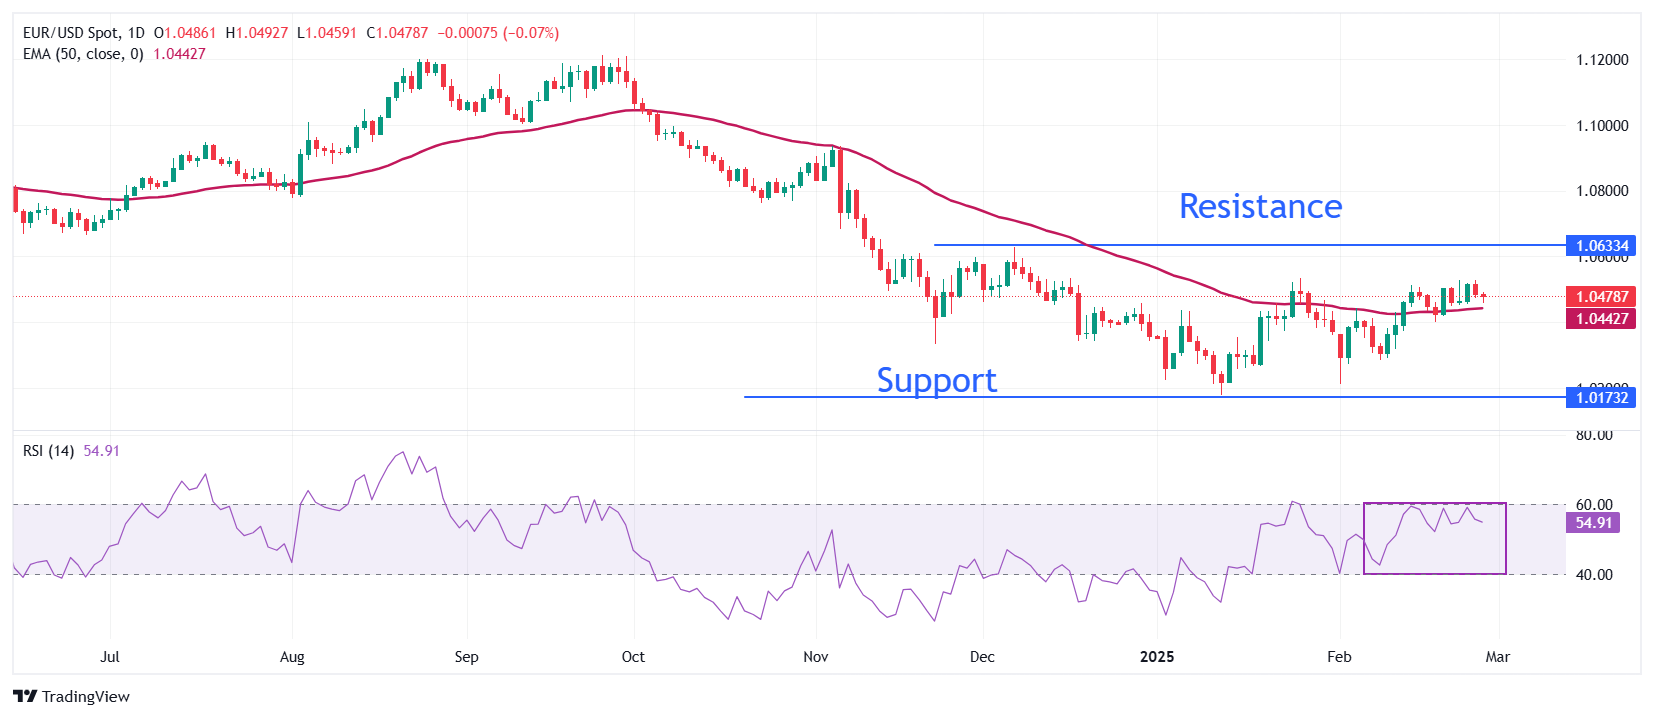
EUR/USD stays in a tight range at around 1.0500 on Thursday as the 50-day Exponential Moving Average (EMA) continues to support the major currency pair around 1.0440.
The 14-day Relative Strength Index (RSI) wobbles below the 60.00 level. A bullish momentum would activate if the RSI (14) manages to sustain above that level.
Looking down, the February 10 low of 1.0285 will act as the major support zone for the pair. Conversely, the December 6 high of 1.0630 will be the key barrier for the Euro bulls.
Euro FAQs
The Euro is the currency for the 19 European Union countries that belong to the Eurozone. It is the second most heavily traded currency in the world behind the US Dollar. In 2022, it accounted for 31% of all foreign exchange transactions, with an average daily turnover of over $2.2 trillion a day. EUR/USD is the most heavily traded currency pair in the world, accounting for an estimated 30% off all transactions, followed by EUR/JPY (4%), EUR/GBP (3%) and EUR/AUD (2%).
The European Central Bank (ECB) in Frankfurt, Germany, is the reserve bank for the Eurozone. The ECB sets interest rates and manages monetary policy. The ECB’s primary mandate is to maintain price stability, which means either controlling inflation or stimulating growth. Its primary tool is the raising or lowering of interest rates. Relatively high interest rates – or the expectation of higher rates – will usually benefit the Euro and vice versa. The ECB Governing Council makes monetary policy decisions at meetings held eight times a year. Decisions are made by heads of the Eurozone national banks and six permanent members, including the President of the ECB, Christine Lagarde.
Eurozone inflation data, measured by the Harmonized Index of Consumer Prices (HICP), is an important econometric for the Euro. If inflation rises more than expected, especially if above the ECB’s 2% target, it obliges the ECB to raise interest rates to bring it back under control. Relatively high interest rates compared to its counterparts will usually benefit the Euro, as it makes the region more attractive as a place for global investors to park their money.
Data releases gauge the health of the economy and can impact on the Euro. Indicators such as GDP, Manufacturing and Services PMIs, employment, and consumer sentiment surveys can all influence the direction of the single currency. A strong economy is good for the Euro. Not only does it attract more foreign investment but it may encourage the ECB to put up interest rates, which will directly strengthen the Euro. Otherwise, if economic data is weak, the Euro is likely to fall. Economic data for the four largest economies in the euro area (Germany, France, Italy and Spain) are especially significant, as they account for 75% of the Eurozone’s economy.
Another significant data release for the Euro is the Trade Balance. This indicator measures the difference between what a country earns from its exports and what it spends on imports over a given period. If a country produces highly sought after exports then its currency will gain in value purely from the extra demand created from foreign buyers seeking to purchase these goods. Therefore, a positive net Trade Balance strengthens a currency and vice versa for a negative balance.
-
11:01
Italy Industrial Sales n.s.a. (YoY) down to -7.2% in December from previous -2.6%
-
11:01
Eurozone Industrial Confidence above forecasts (-12) in February: Actual (-11.4)
-
11:00
Eurozone Business Climate up to -0.74 in February from previous -0.94
-
11:00
Italy Industrial Sales s.a. (MoM) declined to -2.7% in December from previous 1.5%
-
11:00
Eurozone Economic Sentiment Indicator above forecasts (96) in February: Actual (96.3)
-
11:00
Eurozone Services Sentiment below expectations (6.8) in February: Actual (6.2)
-
11:00
Eurozone Consumer Confidence meets forecasts (-13.6) in February
-
10:56
Gold falls on Trump creating more confusion about tariffs
- A mixed Nvidia outlook and an unclear tariffs schedule delivered by US President Trump are cause for concern.
- Gold faces strong selling pressure and trades down over 1% on Thursday.
- Although US yields are dropping off further, the precious metal has lost support for now.
Gold’s price (XAU/USD) faces strong selling pressure and extends this week’s correction to hit a ten-day low near $2,880 at the time of writing on Thursday. The leg lower comes after United States (US) President Donald Trump cast doubts and confusion during a cabinet meeting on Wednesday about what levies will be applied, when and to which countries.
President Trump said “tariffs will go on, not all, but a lot of them” and added that levies on Canada and Mexico imports will go into effect on April 2. Reciprocal tariffs should be installed on April 2 too. The US President confirmed a 25% tariff would be imposed on Europe as well on autos and other things but he did not provide further details.
Daily digest market movers: March is just around the corner
- Overnight markets braced for Nvidia’s (NVDA) earnings. Nvidia's quarterly sales will be about $43 billion, slightly above analysts' estimates, but gross profit margins will be tighter than expected due to the rollout of a new chip design called Blackwell. The mixed outlook came in with bad timing as concerns about slowing spending on AI and the potential impacts of US tariffs could mean more headwinds for the company.
- The CME Fedwatch Tool projects a 33.0% chance that the interest rates will remain at the current range in June, with the rest showing a possible rate cut.
- On the US data front, the second reading of the US Gross Domestic Product (GDP) for the fourth quarter is due at 13:30 GMT. Projections are that the GDP annualized will remain stable at 2.3%. The quarterly headline preliminary Personal Consumption Expenditures (PCE), which precedes the monthly PCE on Friday, is expected to continue stable at 2.3% as well. The core PCE number should come in at 2.5%, also unchanged.
Technical Analysis: Look for the stops
On Wednesday, a few analysts warned that greedy price action was taking place in Gold, with traders willing to buy at any given price to remain part of the rally. With the current correction, several traders will be facing a squeeze and might soon see their stop losses exercised. This idiosyncratic action will result in more selling pressure and might even see a firm drop lower in Bullion to possibly even $2,860 on the day.
The main element to trigger a turnaround comes at the daily Pivot Point of $2,912. Should Gold fully recover back above that level, it would confirm that traders are buying the current dip. Once through there, $2,934 and $2,951 are levels on the upside to look out for in the form of the intraday R1 and R2 resistances.
On the flip side, Tuesday’s low at $2,890 is starting to give way. Further down, watch out for $2,873 (the S2 support), which could open the door for a test to $2,860.
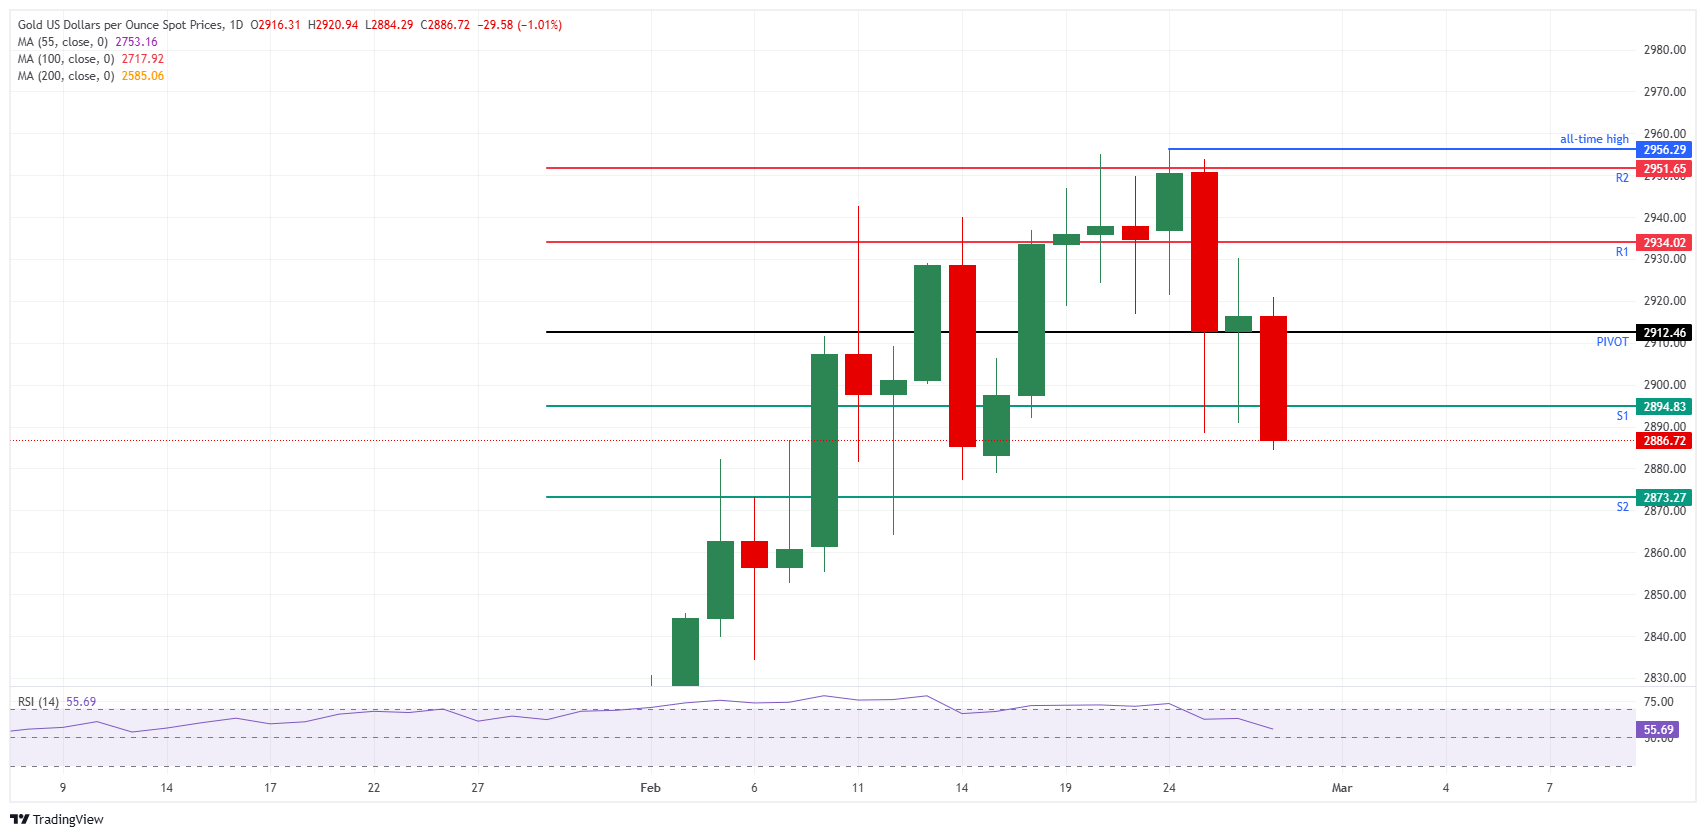
XAU/USD: Daily Chart
Gold FAQs
Gold has played a key role in human’s history as it has been widely used as a store of value and medium of exchange. Currently, apart from its shine and usage for jewelry, the precious metal is widely seen as a safe-haven asset, meaning that it is considered a good investment during turbulent times. Gold is also widely seen as a hedge against inflation and against depreciating currencies as it doesn’t rely on any specific issuer or government.
Central banks are the biggest Gold holders. In their aim to support their currencies in turbulent times, central banks tend to diversify their reserves and buy Gold to improve the perceived strength of the economy and the currency. High Gold reserves can be a source of trust for a country’s solvency. Central banks added 1,136 tonnes of Gold worth around $70 billion to their reserves in 2022, according to data from the World Gold Council. This is the highest yearly purchase since records began. Central banks from emerging economies such as China, India and Turkey are quickly increasing their Gold reserves.
Gold has an inverse correlation with the US Dollar and US Treasuries, which are both major reserve and safe-haven assets. When the Dollar depreciates, Gold tends to rise, enabling investors and central banks to diversify their assets in turbulent times. Gold is also inversely correlated with risk assets. A rally in the stock market tends to weaken Gold price, while sell-offs in riskier markets tend to favor the precious metal.
The price can move due to a wide range of factors. Geopolitical instability or fears of a deep recession can quickly make Gold price escalate due to its safe-haven status. As a yield-less asset, Gold tends to rise with lower interest rates, while higher cost of money usually weighs down on the yellow metal. Still, most moves depend on how the US Dollar (USD) behaves as the asset is priced in dollars (XAU/USD). A strong Dollar tends to keep the price of Gold controlled, whereas a weaker Dollar is likely to push Gold prices up.
-
10:55
Oil: Uncertainty over the outlook for tariffs – ING
Oil prices continued to trend lower yesterday amid uncertainty over the outlook for tariffs, a dynamic overshadowing sanction risks. After imposing additional sanctions on Iran’s oil industry, the Trump administration is now eyeing Venezuela, ending Chevron’s licence to operate in the South American nation, ING’s commodity analysts Warren Patterson and Ewa Manthey notes.
Strong refinery activity is behind the drop in inventories
"Previously, Chevron was allowed to operate there and, despite sanctions, export crude to the US. This development has boosted differentials for medium sour crude grades, such as Mars Blend. Its differential jumped by more than US$1/bbl to US$1.71/bbl. US imports of Venezuelan crude oil have averaged almost 270k b/d so far this year."
"US Energy Information Administration (EIA) weekly inventory data were fairly neutral. Over the last week, US commercial crude oil inventories fell by 2.33m barrels, the first decline in stocks since mid-January. It’s also the largest decline in inventories since December."
"Strong refinery activity is behind the drop in inventories; refiners increased their utilisation rates by 1.6pp week on week. However, we only saw a marginal build in gasoline stocks, which rose 369k barrels. A stronger build was seen in distillate inventories, which grew by 3.91m barrels."
-
10:38
AUD/USD: Risk for AUD is on the downside – UOB Group
Risk for Australian Dollar (AUD) is on the downside vs US Dollar (USD), but any decline may not break the major support at 0.6280. In the longer run, AUD could edge lower, but it must break clearly below 0.6280 before a move to 0.6255 can be expected, UOB Group’s FX analysts Quek Ser Leang and Peter Chia note.
AUD has a chance to edge lower
24-HOUR VIEW: "We did not expect AUD to drop to a low of 0.6296 yesterday (we were expecting range trading). Although the increase in downward momentum indicates downside risk today, any decline may break the major support at 0.6280. To sustain the momentum, AUD must not break above 0.6350 (minor resistance is at 0.6330)."
1-3 WEEKS VIEW: "Two days ago (25 Feb, spot at 0.6345), we revised our AUD view from positive to negative, indicating that the recent 'upward momentum has largely faded,' and AUD 'is likely to consolidate to between 0.6280 and 0.6410.' Yesterday, AUD fell to 0.6296, closing lower by 0.60% at 0.6305. There has been a tentative buildup in downward momentum, and AUD is likely to edge lower. However, it must break and hold below 0.6280 before a move to 0.6255 can be expected. The likelihood of AUD breaking clearly below 0.6280 will remain intact provided that the ‘strong resistance’ level at 0.6375 is not breached."
-
10:32
EUR/USD looks well contained in a 1.0450-0530 range – ING
Despite all the geopolitical noise, EUR/USD has not strayed too far from short-term rate differentials, ING’s FX analysts Chris Turner notes.
EUR/USD correction above 1.05 not to hold for long
"These have moved in favour of the euro this month as fears over a slowdown in US consumption have prompted the pricing of a slightly more dovish Fed profile. Where EUR/USD goes from here will largely be determined by how the Fed and ECB cycles get re-priced, and whether the EU tariff threat is real. Our baseline view is that tariffs will go into place in April and that any EUR/USD correction above 1.05 does not hold for long."
"EUR/USD looks well contained in a 1.0450-0530 range. Look out for month-end flows, however, particularly around the 17CET WMR fix. The substantial outperformance of eurozone equities this month (Eurostoxx +6%, S&P 500 -1%) could lead to some EUR/USD selling as the buy-side rebalances portfolios to desired weights."
-
10:32
Silver price today: Silver falls, according to FXStreet data
Silver prices (XAG/USD) fell on Thursday, according to FXStreet data. Silver trades at $31.76 per troy ounce, down 0.18% from the $31.81 it cost on Wednesday.
Silver prices have increased by 9.91% since the beginning of the year.
Unit measure Silver Price Today in USD Troy Ounce 31.76 1 Gram 1.02
The Gold/Silver ratio, which shows the number of ounces of Silver needed to equal the value of one ounce of Gold, stood at 90.92 on Thursday, down from 91.68 on Wednesday.
Silver FAQs
Silver is a precious metal highly traded among investors. It has been historically used as a store of value and a medium of exchange. Although less popular than Gold, traders may turn to Silver to diversify their investment portfolio, for its intrinsic value or as a potential hedge during high-inflation periods. Investors can buy physical Silver, in coins or in bars, or trade it through vehicles such as Exchange Traded Funds, which track its price on international markets.
Silver prices can move due to a wide range of factors. Geopolitical instability or fears of a deep recession can make Silver price escalate due to its safe-haven status, although to a lesser extent than Gold's. As a yieldless asset, Silver tends to rise with lower interest rates. Its moves also depend on how the US Dollar (USD) behaves as the asset is priced in dollars (XAG/USD). A strong Dollar tends to keep the price of Silver at bay, whereas a weaker Dollar is likely to propel prices up. Other factors such as investment demand, mining supply – Silver is much more abundant than Gold – and recycling rates can also affect prices.
Silver is widely used in industry, particularly in sectors such as electronics or solar energy, as it has one of the highest electric conductivity of all metals – more than Copper and Gold. A surge in demand can increase prices, while a decline tends to lower them. Dynamics in the US, Chinese and Indian economies can also contribute to price swings: for the US and particularly China, their big industrial sectors use Silver in various processes; in India, consumers’ demand for the precious metal for jewellery also plays a key role in setting prices.
Silver prices tend to follow Gold's moves. When Gold prices rise, Silver typically follows suit, as their status as safe-haven assets is similar. The Gold/Silver ratio, which shows the number of ounces of Silver needed to equal the value of one ounce of Gold, may help to determine the relative valuation between both metals. Some investors may consider a high ratio as an indicator that Silver is undervalued, or Gold is overvalued. On the contrary, a low ratio might suggest that Gold is undervalued relative to Silver.
(An automation tool was used in creating this post.)
-
10:30
Portugal Business Confidence dipped from previous 2.8 to 2.7 in February
-
10:30
Portugal Consumer Confidence down to -15.3 in February from previous -15.1
-
10:30
South Africa Producer Price Index (MoM) rose from previous 0.2% to 0.5% in January
-
10:30
South Africa Producer Price Index (YoY) up to 1.1% in January from previous 0.7%
-
10:27
USD/JPY: Await tokyo CPI – OCBC
USD/JPY consolidated at lower grounds as markets lighten positions ahead of inflation reports from Japan and US. Pair was last seen trading t 149.69 levels, OCBC's FX analysts Frances Cheung and Christopher Wong note.
Fed-BoJ policy divergence should push USD/JPY to the downside
"Divergence in US-JP inflation should continue to weigh on USD/JPY. But going into March, we see a confluence of drivers, including Trump’s tariff threats and dividend seasonality trends that may prove 'noisy' for USD/JPY. That said, macro drivers remain intact."
"Prospects of wage growth, broadening services inflation and upbeat economic activities continue to support BoJ policy normalisation. Fed-BoJ policy divergence should continue to underpin broader direction of travel for USD/JPY to the downside. So, maintain bias to sell rallies in USD/JPY should there be a bounce driven by tariff uncertainty or seasonality trends."
"Daily momentum is bearish while RSI rose from near oversold conditions. Rebound risks not ruled out in the interim but bias to sell rallies. Support at 149.20 (50% fibo), 148.80 before 147 (61.8% fibo). Resistance at 150.50, 151.50 (38.2% fibo retracement of Sep low to Jan high)."
-
10:13
DXY: Tariff confusion derailed momentum – OCBC
USD traded firmer on Trump threats on tariffs. DXY was last seen trading at 106.60, OCBC's FX analysts Frances Cheung and Christopher Wong note.
Rebound risks not ruled out
"He said tariffs on EU will be 25% on autos and other things. Elsewhere, there was also confusion when Trump mentioned that the 25% tariff on Canada and Mexico would begin on 2 Apr, when the supposedly known effective date was 4 Mar. A White House official has confirmed that deadline remains as 4 Mar and Trump has yet to decide whether to grant another extension."
"Reciprocal tariff will begin on 2 Apr. The confusion had resulted in choppy trades in FX markets overnight. Nevertheless, tariff threats tie in with our view that caution is warranted as we enter March. Tariff imposition on these dates can undermine sentiments and lead to spikes in the USD, unless the implementation dates are pushed back again."
"Bearish momentum on daily chart is fading while RSI rose from near oversold conditions. Rebound risks not ruled out. Next support at 105.50, 105.20 levels (50% fibo). Resistance at 107.35 (21 DMA), 107.80 levels (23.6% fibo). Support at 106.30/40 levels (100 DMA, 38.2% fibo retracement of Oct low to Jan high). That said, core PCE remains a focus on Friday."
-
10:10
NZD/USD remains below 0.5700 due to ongoing uncertainty over US trade policies
- NZD/USD weakens as the US Dollar gains strength amid persistent uncertainty over US trade policies.
- The US Dollar strengthens due to risk-off sentiment and rising US Treasury yields.
- ANZ Business Outlook Index climbed to 58.4 in February, signaling increased optimism about New Zealand’s economic recovery.
NZD/USD continues its losing streak for the fifth consecutive day, trading around 0.5680 during the European session on Thursday. The pair weakens as the US Dollar (USD) strengthens amid uncertainty over US trade policies, driven by US President Donald Trump’s vague pledges to impose tariffs on Europe and continued delays on planned levies for Canada and Mexico.
The Greenback strengthens amid increased risk aversion and rising US Treasury yields. The US Dollar Index (DXY), which measures the USD against six major currencies, maintains its position above 106.50, with 2-year and 10-year US Treasury bond yields standing at 4.10% and 4.29%, respectively, at the time of writing.
Federal Reserve Bank of Atlanta President Raphael Bostic stated late Wednesday that the Fed should maintain current interest rates to continue applying downward pressure on inflation, according to Bloomberg. Bostic noted the need for more data to determine if January’s inflation was a temporary bump or the start of a trend. He emphasized that Fed policy remains restrictive and should stay that way.
On Thursday, Lu Lei, Deputy Governor of the People’s Bank of China (PBOC), suggested that the central bank take a more active role in supporting fundraising efforts, including issuing special treasury bonds, to help major state-owned banks bolster their Common Equity Tier 1 (CET1) capital. Any shifts in China’s economy could influence the NZD, given the close trade relationship between China and New Zealand.
In New Zealand, the ANZ Business Outlook Index rose to 58.4 in February 2025, up from January’s five-month low of 54.4. This marks the first increase in four months, reflecting growing optimism about the economy’s recovery, driven by lower interest rates and stronger-than-expected commodity export prices.
New Zealand Dollar FAQs
The New Zealand Dollar (NZD), also known as the Kiwi, is a well-known traded currency among investors. Its value is broadly determined by the health of the New Zealand economy and the country’s central bank policy. Still, there are some unique particularities that also can make NZD move. The performance of the Chinese economy tends to move the Kiwi because China is New Zealand’s biggest trading partner. Bad news for the Chinese economy likely means less New Zealand exports to the country, hitting the economy and thus its currency. Another factor moving NZD is dairy prices as the dairy industry is New Zealand’s main export. High dairy prices boost export income, contributing positively to the economy and thus to the NZD.
The Reserve Bank of New Zealand (RBNZ) aims to achieve and maintain an inflation rate between 1% and 3% over the medium term, with a focus to keep it near the 2% mid-point. To this end, the bank sets an appropriate level of interest rates. When inflation is too high, the RBNZ will increase interest rates to cool the economy, but the move will also make bond yields higher, increasing investors’ appeal to invest in the country and thus boosting NZD. On the contrary, lower interest rates tend to weaken NZD. The so-called rate differential, or how rates in New Zealand are or are expected to be compared to the ones set by the US Federal Reserve, can also play a key role in moving the NZD/USD pair.
Macroeconomic data releases in New Zealand are key to assess the state of the economy and can impact the New Zealand Dollar’s (NZD) valuation. A strong economy, based on high economic growth, low unemployment and high confidence is good for NZD. High economic growth attracts foreign investment and may encourage the Reserve Bank of New Zealand to increase interest rates, if this economic strength comes together with elevated inflation. Conversely, if economic data is weak, NZD is likely to depreciate.
The New Zealand Dollar (NZD) tends to strengthen during risk-on periods, or when investors perceive that broader market risks are low and are optimistic about growth. This tends to lead to a more favorable outlook for commodities and so-called ‘commodity currencies’ such as the Kiwi. Conversely, NZD tends to weaken at times of market turbulence or economic uncertainty as investors tend to sell higher-risk assets and flee to the more-stable safe havens.
-
10:01
Eurozone M3 Money Supply (3m) unchanged at 3.6% in January
-
10:01
Italy Consumer Confidence above forecasts (98.4) in February: Actual (98.8)
-
10:00
Eurozone Private Loans (YoY) came in at 1.3%, above forecasts (1.2%) in January
-
10:00
Italy Business Confidence meets forecasts (87) in February
-
10:00
Eurozone M3 Money Supply (YoY) below expectations (3.8%) in January: Actual (3.6%)
-
09:58
GBP/USD: Expected to trade between 1.2640 and 1.2700 – UOB Group
Pound Sterling (GBP) is expected to trade between 1.2640 and 1.2700 vs US Dollar (USD). In the longer run, momentum has slowed further; a breach of 1.2615 would indicate that GBP is not strengthening further, UOB Group’s FX analysts Quek Ser Leang and Peter Chia note.
Momentum has slowed further
24-HOUR VIEW: "While we expected GBP to 'rebound further' yesterday, we noted that it 'does not appear to have enough momentum to reach 1.2730.' Our view was not wrong, as GBP rose to 1.2717, pulling back to close largely unchanged at 1.2674 (+0.06%). Upward has eased, and today, we expect GBP to trade 1.2640 and 1.2700."
1-3 WEEKS VIEW: "While we have held a positive view in GBP since the middle of the month, we highlighted two days ago (25 Feb, spot at 1.2625) that 'upward momentum is beginning to slow, and a breach of 1.2580 (‘strong support’ level) would indicate that 1.2730 is out of reach this time around.' GBP has not been able to make much headway on the upside, and momentum has slowed further. The ‘strong support’ level has moved higher to 1.2615 from 1.2580; a breach of this level would indicate that GBP is not strengthening further."
-
09:54
EUR/USD: Bearish divergence? – OCBC
Euro (EUR) dipped on Trump’s mention of 25% tariff on EU vs US Dollar (USD), although no effective date was mentioned. Tariff uncertainty should weigh on EUR. Pair was last seen at 1.0478 levels, OCBC's FX analysts Frances Cheung and Christopher Wong note.
Tentative signs of bearish divergence on MACD emerging
"Bullish momentum on daily chart shows signs of fading though still intact while RSI slipped. Tentative signs of bearish divergence on MACD emerging. Resistance at 1.0520 (100 DMA) likely to cap upside for now. Beyond this sees next resistance at 1.0575 (38.2% fibo retracement of Sep high to Jan low). Support at 1.0420/30 levels (21 DMA, 23.6% fibo), 1.0390 (50 DMA)."
-
09:32
WTI holds gains above $68.50 as Trump decides to revoke Chevron’s Venezuela license
- WTI Oil price holds ground amid supply concerns after Trump cancels Chevron's Venezuela license.
- Oil prices faced headwinds amid rising concerns over global economic growth, with fears that Trump tariffs could weaken demand.
- The possibility of a Russia-Ukraine peace deal and the potential easing of Russian sanctions have weighed on Oil prices.
West Texas Intermediate (WTI) Oil price maintains its position above the two-month low of $68.29, recorded on February 26, currently hovering around $68.70 per barrel during European trading hours on Thursday. Crude Oil prices receive some support from supply concerns as US President Donald Trump announced plans to revoke Chevron Corp.’s Oil license in Venezuela, a move criticized by Venezuelan Vice President Delcy Rodriguez as "damaging and inexplicable."
Chevron exports around 240,000 barrels per day (bpd) of crude from its operations in Venezuela, accounting for over a quarter of the country’s total Oil production. With the license revoked, Chevron will no longer be permitted to export Venezuelan crude.
However, crude Oil prices faced headwinds amid rising concerns over global economic growth, with fears that tariffs imposed by US President Donald Trump on China and other trading partners could weaken demand. On Wednesday, President Trump reaffirmed his plan to enforce 25% tariffs on Canada and Mexico and announced intentions to add the EU to the list of nations facing trade penalties for exports to the US.
Oil prices also face pressure from expectations of increased global supply. Hopes for a Russia-Ukraine peace deal have weighed on prices, as the easing of Russian sanctions could boost oil output. In a related development, the US and Ukraine reportedly agreed on a draft minerals deal seen as crucial for securing Washington’s support, with President Trump aiming to swiftly resolve the conflict with Russia.
In Iraq, the Kurdistan regional government has reached an agreement with the federal oil ministry to resume Kurdish crude exports, though the restart awaits Turkey’s approval. The pipeline has been shut since March 2023 following an International Chamber of Commerce (ICC) ruling ordering Turkey to pay Baghdad $1.5 billion in damages for unauthorized exports between 2014 and 2018.
WTI Oil FAQs
WTI Oil is a type of Crude Oil sold on international markets. The WTI stands for West Texas Intermediate, one of three major types including Brent and Dubai Crude. WTI is also referred to as “light” and “sweet” because of its relatively low gravity and sulfur content respectively. It is considered a high quality Oil that is easily refined. It is sourced in the United States and distributed via the Cushing hub, which is considered “The Pipeline Crossroads of the World”. It is a benchmark for the Oil market and WTI price is frequently quoted in the media.
Like all assets, supply and demand are the key drivers of WTI Oil price. As such, global growth can be a driver of increased demand and vice versa for weak global growth. Political instability, wars, and sanctions can disrupt supply and impact prices. The decisions of OPEC, a group of major Oil-producing countries, is another key driver of price. The value of the US Dollar influences the price of WTI Crude Oil, since Oil is predominantly traded in US Dollars, thus a weaker US Dollar can make Oil more affordable and vice versa.
The weekly Oil inventory reports published by the American Petroleum Institute (API) and the Energy Information Agency (EIA) impact the price of WTI Oil. Changes in inventories reflect fluctuating supply and demand. If the data shows a drop in inventories it can indicate increased demand, pushing up Oil price. Higher inventories can reflect increased supply, pushing down prices. API’s report is published every Tuesday and EIA’s the day after. Their results are usually similar, falling within 1% of each other 75% of the time. The EIA data is considered more reliable, since it is a government agency.
OPEC (Organization of the Petroleum Exporting Countries) is a group of 12 Oil-producing nations who collectively decide production quotas for member countries at twice-yearly meetings. Their decisions often impact WTI Oil prices. When OPEC decides to lower quotas, it can tighten supply, pushing up Oil prices. When OPEC increases production, it has the opposite effect. OPEC+ refers to an expanded group that includes ten extra non-OPEC members, the most notable of which is Russia.
-
09:29
EUR/USD: Expected to trade in a 1.0465/1.0515 range – UOB Group
Brief advance did not result in a significant increase in momentum; Euro (EUR) is expected to trade in a 1.0465/1.0515 range vs US Dollar (USD). In the longer run, unless EUR breaks and holds above 1.0530 soon, the likelihood of it rising further will diminish, UOB Group’s FX analysts Quek Ser Leang and Peter Chia note.
The likelihood of EUR rising further set to diminish
24-HOUR VIEW: " Following EUR’s rise to 1.0519 on Tuesday, we indicated yesterday that, 'while there is a chance for EUR to rise above the major resistance at 1.0530, it is unclear whether it can maintain a foothold above this level.' We pointed out, 'the next major at 1.0560 is unlikely to come into view.' The subsequent price movements did not quite turn out as we expected. EUR popped to a high of 1.0528 and then pulled back to close at 1.0483, lower by 0.29%. The brief advance did not result in a significant increase in momentum. Today, we expect EUR to trade in a range, likely between 1.0465 and 1.0515."
1-3 WEEKS VIEW: "Two days ago (25 Feb, spot at 1.0460), we noted that 'upward momentum has slowed somewhat.' However, we highlighted that 'only a breach of 1.0425 (‘strong support’ level) would indicate that EUR is not ready to rise above 1.0530.' Yesterday, EUR tested the 1.0530 level for the second time this week, rising briefly to 1.0528. Upward momentum is continuing to slow. Unless EUR breaks and holds above 1.0530 within these 1-2 days, the likelihood of it rising further will diminish. Conversely, a breach of 1.0440 (‘strong support’ previously at 1.0425) would suggest that EUR has entered a range trading phase."
-
09:00
Spain Harmonized Index of Consumer Prices (MoM) meets expectations (0.4%) in February
-
09:00
Spain Consumer Price Index (YoY) below forecasts (3.1%) in February: Actual (3%)
-
09:00
Spain Consumer Price Index (MoM) registered at 0.4% above expectations (0.3%) in February
-
09:00
Switzerland Gross Domestic Product (QoQ) meets expectations (0.2%) in 4Q
-
09:00
Switzerland Gross Domestic Product (YoY) below forecasts (1.6%) in 4Q: Actual (1.5%)
-
09:00
Spain Harmonized Index of Consumer Prices (YoY) above forecasts (2.8%) in February: Actual (2.9%)
-
08:55
AUD/JPY maintains position near 94.00, downside risks appear due to hawkish BoJ
- AUD/JPY may weaken as the Japanese Yen finds support from the Bank of Japan’s hawkish policy outlook.
- The Australian Dollar declines after Thursday’s disappointing Private Capital Expenditure data.
- RBA Deputy Governor Andrew Hauser highlighted that Australia’s tight labor market remains a challenge for managing inflation.
AUD/JPY holds gains after two consecutive sessions of losses, trading near 94.00 during early European hours on Thursday. However, the currency cross faced downside pressure as the Japanese Yen gained support from strong expectations that the Bank of Japan (BoJ) will continue raising interest rates this year, driven by upside surprises in fourth-quarter inflation and robust wage growth.
Market participants in Japan are awaiting several key economic reports due on Friday. These reports, which include industrial production, retail sales, and Tokyo inflation, are expected to provide crucial insights into the BoJ’s future monetary policy direction.
The AUD/JPY cross could have encountered headwinds after disappointing Australian Private Capital Expenditure data released on Thursday, which showed an unexpected 0.2% contraction quarter-on-quarter in Q4 2024, missing market forecasts of 0.8% growth. This follows an upwardly revised 1.6% expansion in the previous quarter.
On Thursday, Reserve Bank of Australia (RBA) Deputy Governor Andrew Hauser expressed optimism about inflation trends but stressed the importance of seeing sustained progress. He also noted that Australia’s tight labor market continues to pose a challenge for controlling inflation.
Additionally, a Wall Street Journal report on the Australian Dollar’s outlook, citing the Commonwealth Bank of Australia (CBA), highlighted growing concerns over potential trade war risks driven by Trump. China’s response to these threats will be a key factor influencing the future performance of the AUD.
Interest rates FAQs
Interest rates are charged by financial institutions on loans to borrowers and are paid as interest to savers and depositors. They are influenced by base lending rates, which are set by central banks in response to changes in the economy. Central banks normally have a mandate to ensure price stability, which in most cases means targeting a core inflation rate of around 2%. If inflation falls below target the central bank may cut base lending rates, with a view to stimulating lending and boosting the economy. If inflation rises substantially above 2% it normally results in the central bank raising base lending rates in an attempt to lower inflation.
Higher interest rates generally help strengthen a country’s currency as they make it a more attractive place for global investors to park their money.
Higher interest rates overall weigh on the price of Gold because they increase the opportunity cost of holding Gold instead of investing in an interest-bearing asset or placing cash in the bank. If interest rates are high that usually pushes up the price of the US Dollar (USD), and since Gold is priced in Dollars, this has the effect of lowering the price of Gold.
The Fed funds rate is the overnight rate at which US banks lend to each other. It is the oft-quoted headline rate set by the Federal Reserve at its FOMC meetings. It is set as a range, for example 4.75%-5.00%, though the upper limit (in that case 5.00%) is the quoted figure. Market expectations for future Fed funds rate are tracked by the CME FedWatch tool, which shapes how many financial markets behave in anticipation of future Federal Reserve monetary policy decisions.
-
08:51
Pound Sterling drops against US Dollar as Trump’s tariff threats prompt risk-off mood
- The Pound Sterling falls to near 1.2650 against the US Dollar as market sentiment is cautious due to uncertainty over the global economic outlook.
- President Trump said that he will unveil details of tariffs on the Eurozone soon.
- Investors await the Trump-Starmer meeting and the US PCE inflation data.
The Pound Sterling (GBP) falls to near 1.2650 against the US Dollar (USD) in European trading hours on Thursday. The GBP/USD pair faces pressure as investors rush to safe-haven assets due to uncertainty over United States (US) President Donald Trump’s tariff agenda. The US Dollar Index (DXY), which tracks the Greenback’s value against six major currencies, moves higher to near 106.70.
On Wednesday, US President Donald Trump said he is prepared to announce tariffs on the Eurozone. “Details on EU tariffs coming soon”, Trump said. He added that tariffs to be 25% on autos and other things. Though the foundation of a global trade war has already been laid by Trump imposing 10% tariffs on all imports from China, higher import duties on the 27-nations bloc would escalate fears of an economic slowdown across the globe.
Meanwhile, Donald Trump has provided a further month-long extension to Canada and Mexico to avoid tariffs. “Canada and Mexico tariffs to go into effect on April 2”, Trump said. Earlier, the deadline for slapping levies by the US on its North American partners was February 4, which was postponed to March 4 after they agreed to tighten border securities to restrict the flow of fentanyl and undocumented immigrants into the economy.
On the domestic front, the outlook of the US Dollar appears to be losing strength due to a contraction in the S&P Global US Services Purchasing Managers Index (PMI) for the first time in more than two years and a big slump in the Consumer Confidence data for February. Weak economic data has also boosted expectations that the Federal Reserve’s (Fed) restrictive policy stance won’t last long. According to the CME FedWatch tool, there is a 68% chance that the Fed can reduce interest rates in the June policy meeting.
For more guidance on the Fed’s policy outlook, investors will focus on the US Personal Consumption Expenditures Price Index (PCE) data for January, which will be released on Friday. In Thursday’s session, investors will pay close attention to the US Durable Goods Orders data for January, the Initial Jobless Claims for the week ending on February 21, the updated Gross Domestic Product (GDP) report for the last quarter of 2024, and Fed policymakers Michael Barr, Michelle Bowman, Thomas Barkin, Beth Hammack, and Patrick Harker speeches.
Daily digest market movers: Pound Sterling trades with caution
- The Pound Sterling trades cautiously against its major peers on Thursday as investors await the outcome of United Kingdom (UK) Prime Minister Keir Starmer’s meeting with US President Donald Trump on Thursday. Starmer is expected to negotiate on trade policies between both nations.
- Investors will pay close attention to Trump-Starmer’s meeting, given that the UK is the fifth largest trading partner of the US after Canada, Mexico, China, and Germany, according to data from the US Bureau of Economic Analysis (BEA).
- Trump-Starmer talks on trade policies are expected to be healthy as Trump has never raised any issue regarding unfair trade practices by the UK in his tariff threats since the election campaign. Also, President Trump said in a press conference earlier this month that he is not sure about imposing tariffs on the UK and was confident that a deal could be made as Prime Minister Keir Starmer has been "very nice".
- Meanwhile, UK Chancellor of the Exchequer Rachel Reeves is confident that trade and investment between the US and the UK would not be derailed by the new US administration. "The last time President Trump was in the White House, trade and investment flows between our two countries increased, and I've got every confidence that that can happen again," Reeves said in an interview with Reuters at the sidelines of the G20 Finance Ministers’ summit.
Technical Analysis: Pound Sterling falls to near 1.2650
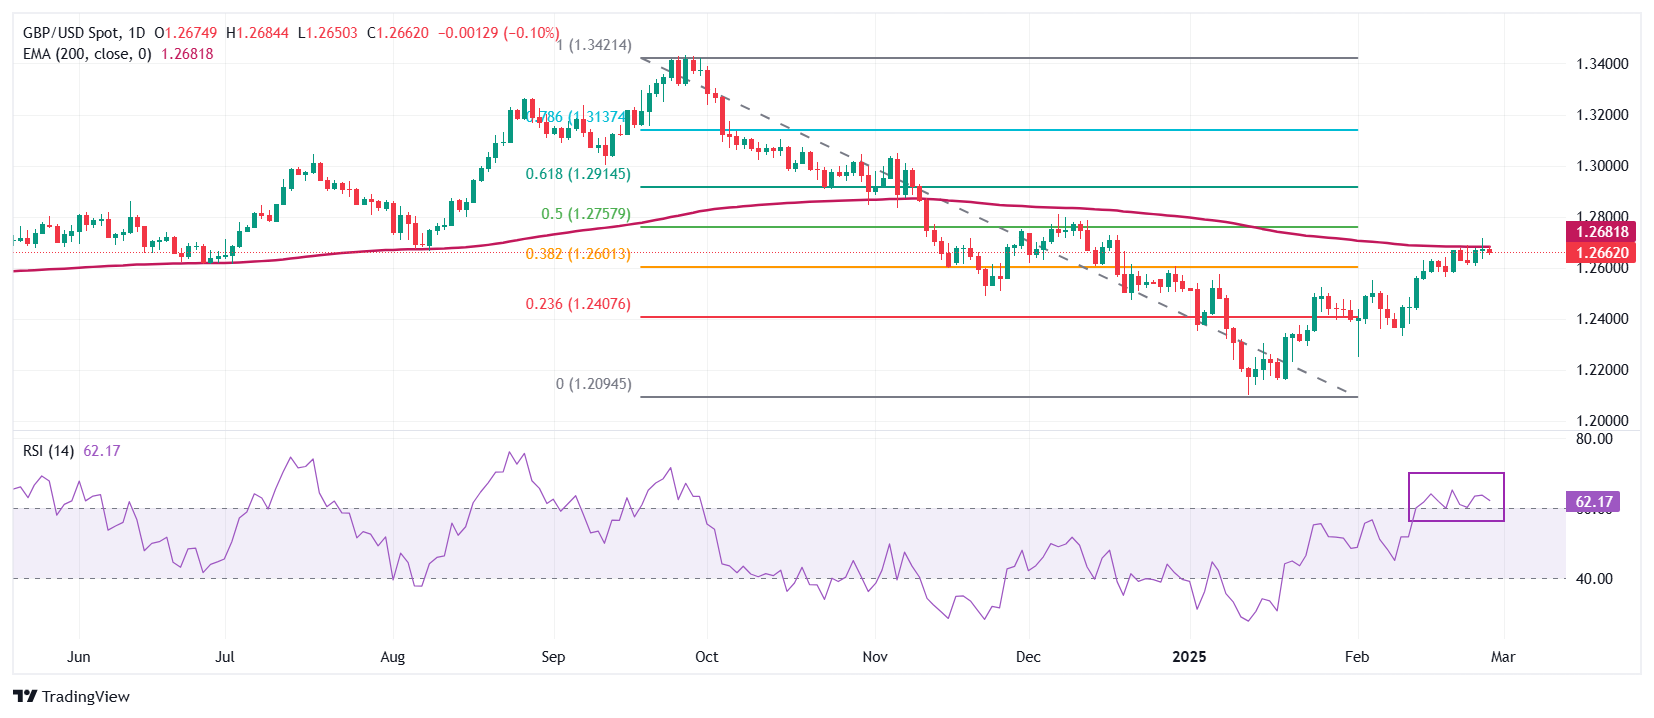
The Pound Sterling drops to near 1.2650 against the US Dollar in Thursday’s European session. The GBP/USD pair continues to face pressure near the 200-day Exponential Moving Average (EMA), which trades around 1.2680. The Cable holds above the 38.2% Fibonacci retracement from the end-September high to the mid-January low downtrend around 1.2620.
The 14-day Relative Strength Index (RSI) oscillates above 60.00. The bullish momentum remains intact if the RSI (14) holds above that level.
Looking down, the February 11 low of 1.2333 will act as a key support zone for the pair. On the upside, the 50% and 61.8% Fibonacci retracement at 1.2767 and 1.2927, respectively, will act as key resistance zones.
Pound Sterling FAQs
The Pound Sterling (GBP) is the oldest currency in the world (886 AD) and the official currency of the United Kingdom. It is the fourth most traded unit for foreign exchange (FX) in the world, accounting for 12% of all transactions, averaging $630 billion a day, according to 2022 data. Its key trading pairs are GBP/USD, also known as ‘Cable’, which accounts for 11% of FX, GBP/JPY, or the ‘Dragon’ as it is known by traders (3%), and EUR/GBP (2%). The Pound Sterling is issued by the Bank of England (BoE).
The single most important factor influencing the value of the Pound Sterling is monetary policy decided by the Bank of England. The BoE bases its decisions on whether it has achieved its primary goal of “price stability” – a steady inflation rate of around 2%. Its primary tool for achieving this is the adjustment of interest rates. When inflation is too high, the BoE will try to rein it in by raising interest rates, making it more expensive for people and businesses to access credit. This is generally positive for GBP, as higher interest rates make the UK a more attractive place for global investors to park their money. When inflation falls too low it is a sign economic growth is slowing. In this scenario, the BoE will consider lowering interest rates to cheapen credit so businesses will borrow more to invest in growth-generating projects.
Data releases gauge the health of the economy and can impact the value of the Pound Sterling. Indicators such as GDP, Manufacturing and Services PMIs, and employment can all influence the direction of the GBP. A strong economy is good for Sterling. Not only does it attract more foreign investment but it may encourage the BoE to put up interest rates, which will directly strengthen GBP. Otherwise, if economic data is weak, the Pound Sterling is likely to fall.
Another significant data release for the Pound Sterling is the Trade Balance. This indicator measures the difference between what a country earns from its exports and what it spends on imports over a given period. If a country produces highly sought-after exports, its currency will benefit purely from the extra demand created from foreign buyers seeking to purchase these goods. Therefore, a positive net Trade Balance strengthens a currency and vice versa for a negative balance.
-
08:45
France Producer Prices (MoM): 0.7% (January) vs previous 1%
-
08:44
Crude Oil price today: WTI price bearish, according to FXStreet data
West Texas Intermediate (WTI) Oil price falls on Thursday, according to FXStreet data. WTI trades at $68.53 per barrel, down from Wednesday’s close at $68.67.
Brent Oil Exchange Rate (Brent crude) is also shedding ground, trading at $72.09 after its previous daily close at $72.20.
WTI Oil FAQs
WTI Oil is a type of Crude Oil sold on international markets. The WTI stands for West Texas Intermediate, one of three major types including Brent and Dubai Crude. WTI is also referred to as “light” and “sweet” because of its relatively low gravity and sulfur content respectively. It is considered a high quality Oil that is easily refined. It is sourced in the United States and distributed via the Cushing hub, which is considered “The Pipeline Crossroads of the World”. It is a benchmark for the Oil market and WTI price is frequently quoted in the media.
Like all assets, supply and demand are the key drivers of WTI Oil price. As such, global growth can be a driver of increased demand and vice versa for weak global growth. Political instability, wars, and sanctions can disrupt supply and impact prices. The decisions of OPEC, a group of major Oil-producing countries, is another key driver of price. The value of the US Dollar influences the price of WTI Crude Oil, since Oil is predominantly traded in US Dollars, thus a weaker US Dollar can make Oil more affordable and vice versa.
The weekly Oil inventory reports published by the American Petroleum Institute (API) and the Energy Information Agency (EIA) impact the price of WTI Oil. Changes in inventories reflect fluctuating supply and demand. If the data shows a drop in inventories it can indicate increased demand, pushing up Oil price. Higher inventories can reflect increased supply, pushing down prices. API’s report is published every Tuesday and EIA’s the day after. Their results are usually similar, falling within 1% of each other 75% of the time. The EIA data is considered more reliable, since it is a government agency.
OPEC (Organization of the Petroleum Exporting Countries) is a group of 12 Oil-producing nations who collectively decide production quotas for member countries at twice-yearly meetings. Their decisions often impact WTI Oil prices. When OPEC decides to lower quotas, it can tighten supply, pushing up Oil prices. When OPEC increases production, it has the opposite effect. OPEC+ refers to an expanded group that includes ten extra non-OPEC members, the most notable of which is Russia.
(An automation tool was used in creating this post.)
-
08:21
Forex Today: Market focus shifts to key macroeconomic data releases from US
Here is what you need to know on Thursday, February 27:
The US Dollar (USD) stays resilient against its peers in the European morning on Thursday as market participants gear for key data releases. The US economic calendar will feature Durable Goods Orders and Pending Home Sales figures for January, alongside the weekly Initial Jobless Claims report. Additionally, the US Bureau of Economic Analysis will release revisions to the fourth quarter Gross Domestic Product (GDP) growth.
US Dollar PRICE This week
The table below shows the percentage change of US Dollar (USD) against listed major currencies this week. US Dollar was the strongest against the New Zealand Dollar.
USD EUR GBP JPY CAD AUD NZD CHF USD -0.09% -0.24% 0.06% 0.84% 0.95% 1.01% -0.22% EUR 0.09% -0.24% -0.05% 0.74% 1.03% 0.91% -0.30% GBP 0.24% 0.24% 0.26% 0.98% 1.27% 1.16% -0.06% JPY -0.06% 0.05% -0.26% 0.79% 0.98% 1.04% -0.18% CAD -0.84% -0.74% -0.98% -0.79% 0.06% 0.17% -1.05% AUD -0.95% -1.03% -1.27% -0.98% -0.06% -0.12% -1.31% NZD -1.01% -0.91% -1.16% -1.04% -0.17% 0.12% -1.20% CHF 0.22% 0.30% 0.06% 0.18% 1.05% 1.31% 1.20% The heat map shows percentage changes of major currencies against each other. The base currency is picked from the left column, while the quote currency is picked from the top row. For example, if you pick the US Dollar from the left column and move along the horizontal line to the Japanese Yen, the percentage change displayed in the box will represent USD (base)/JPY (quote).
The risk-averse market atmosphere helped the USD hold its ground midweek. During the American trading hours, US President Donald Trump said Canada and Mexico tariffs will go into effect on April 2nd and added that they will impose tariffs on EU imports. Trump noted that they will share details on EU tariffs soon but hinted that they are likely to be 25% on autos and some other imports. Trump is scheduled to hold a press conference with British Prime Minister Keir Starmer at 19:00 GMT on Thursday. Several Federal Reserve (Fed) policymakers will also be speaking in the second half of the day.
EUR/USD lost nearly 0.3% on Wednesday. The pair struggles to stage a rebound in the European morning and stays well below 1.0500. Later in the session, the European Commission will publish Consumer Confidence, Business Climate and Economic Sentiment Indicator data for February. Moreover, the European Central Bank will publish the Monetary Policy Meeting Accounts.
After climbing to a multi-month high above 1.2700, GBP/USD reversed its direction and erased the majority of its daily gains to close marginally higher. The pair stays on the back foot early Thursday and declines toward 1.2650.
Following Tuesday's sharp decline, Gold failed to attract buyers on Wednesday and ended the day flat. XAU/USD stays under bearish pressure early Thursday and trades near $2,890.
USD/JPY struggles to find direction and moves sideways below 149.50 for the second consecutive day on Thursday. In the early trading hours of the Asian session on Friday, Tokyo Consumer Price Index data for February, Industrial Production and Retail Trade figures for January from Japan will be watched closely by market participants.
Tariffs FAQs
Tariffs are customs duties levied on certain merchandise imports or a category of products. Tariffs are designed to help local producers and manufacturers be more competitive in the market by providing a price advantage over similar goods that can be imported. Tariffs are widely used as tools of protectionism, along with trade barriers and import quotas.
Although tariffs and taxes both generate government revenue to fund public goods and services, they have several distinctions. Tariffs are prepaid at the port of entry, while taxes are paid at the time of purchase. Taxes are imposed on individual taxpayers and businesses, while tariffs are paid by importers.
There are two schools of thought among economists regarding the usage of tariffs. While some argue that tariffs are necessary to protect domestic industries and address trade imbalances, others see them as a harmful tool that could potentially drive prices higher over the long term and lead to a damaging trade war by encouraging tit-for-tat tariffs.
During the run-up to the presidential election in November 2024, Donald Trump made it clear that he intends to use tariffs to support the US economy and American producers. In 2024, Mexico, China and Canada accounted for 42% of total US imports. In this period, Mexico stood out as the top exporter with $466.6 billion, according to the US Census Bureau. Hence, Trump wants to focus on these three nations when imposing tariffs. He also plans to use the revenue generated through tariffs to lower personal income taxes.
-
08:03
US Dollar Price Forecast: Bearish outlook remains in play near 106.50
- The US Dollar Index strengthens to near 106.65 in Thursday’s early European session.
- The negative outlook of the DXY remains intact below the 100-day EMA, but further consolidation cannot be ruled out.
- The first support level is seen at 106.20; the immediate resistance level emerges at 106.80.
The US Dollar Index (DXY) gains traction to near 106.65 during the early European session on Thursday. The cautious mood amid the tariff uncertainty from US President Donald Trump could lift the Greenback.
However, the weaker US economic data have prompted traders to raise bets for interest rate cuts, now seeing two quarter-point reductions this year, with the first likely in July and the next as early as October. This, in turn, might cap the upside for the DXY.
According to the 4-hour chart, the DXY keeps the bearish vibe as the price remains capped below the key 100-period EMA Exponential Moving Average (EMA). Nonetheless, further consolidation cannot be ruled out as the 14-day Relative Strength Index (RSI) crosses above the midline near 53.35.
The lower limit of the Bollinger Band at 106.20 acts as an initial support level for the index. A decisive break below the mentioned level could expose 105.80, the low of December 9. Extended losses could see a drop to 105.41, the low of December 6.
On the upside, the first upside barrier for the DXY emerges at 106.80, the upper boundary of the Bollinger Band. Sustained bullish momentum above this level could pave the way to the 107.00-107.10 region, the psychological level and the 100-EMA EMA. The next hurdle to watch is 107.38, the high of February 19.US Dollar Index (DXY) 4-hour chart
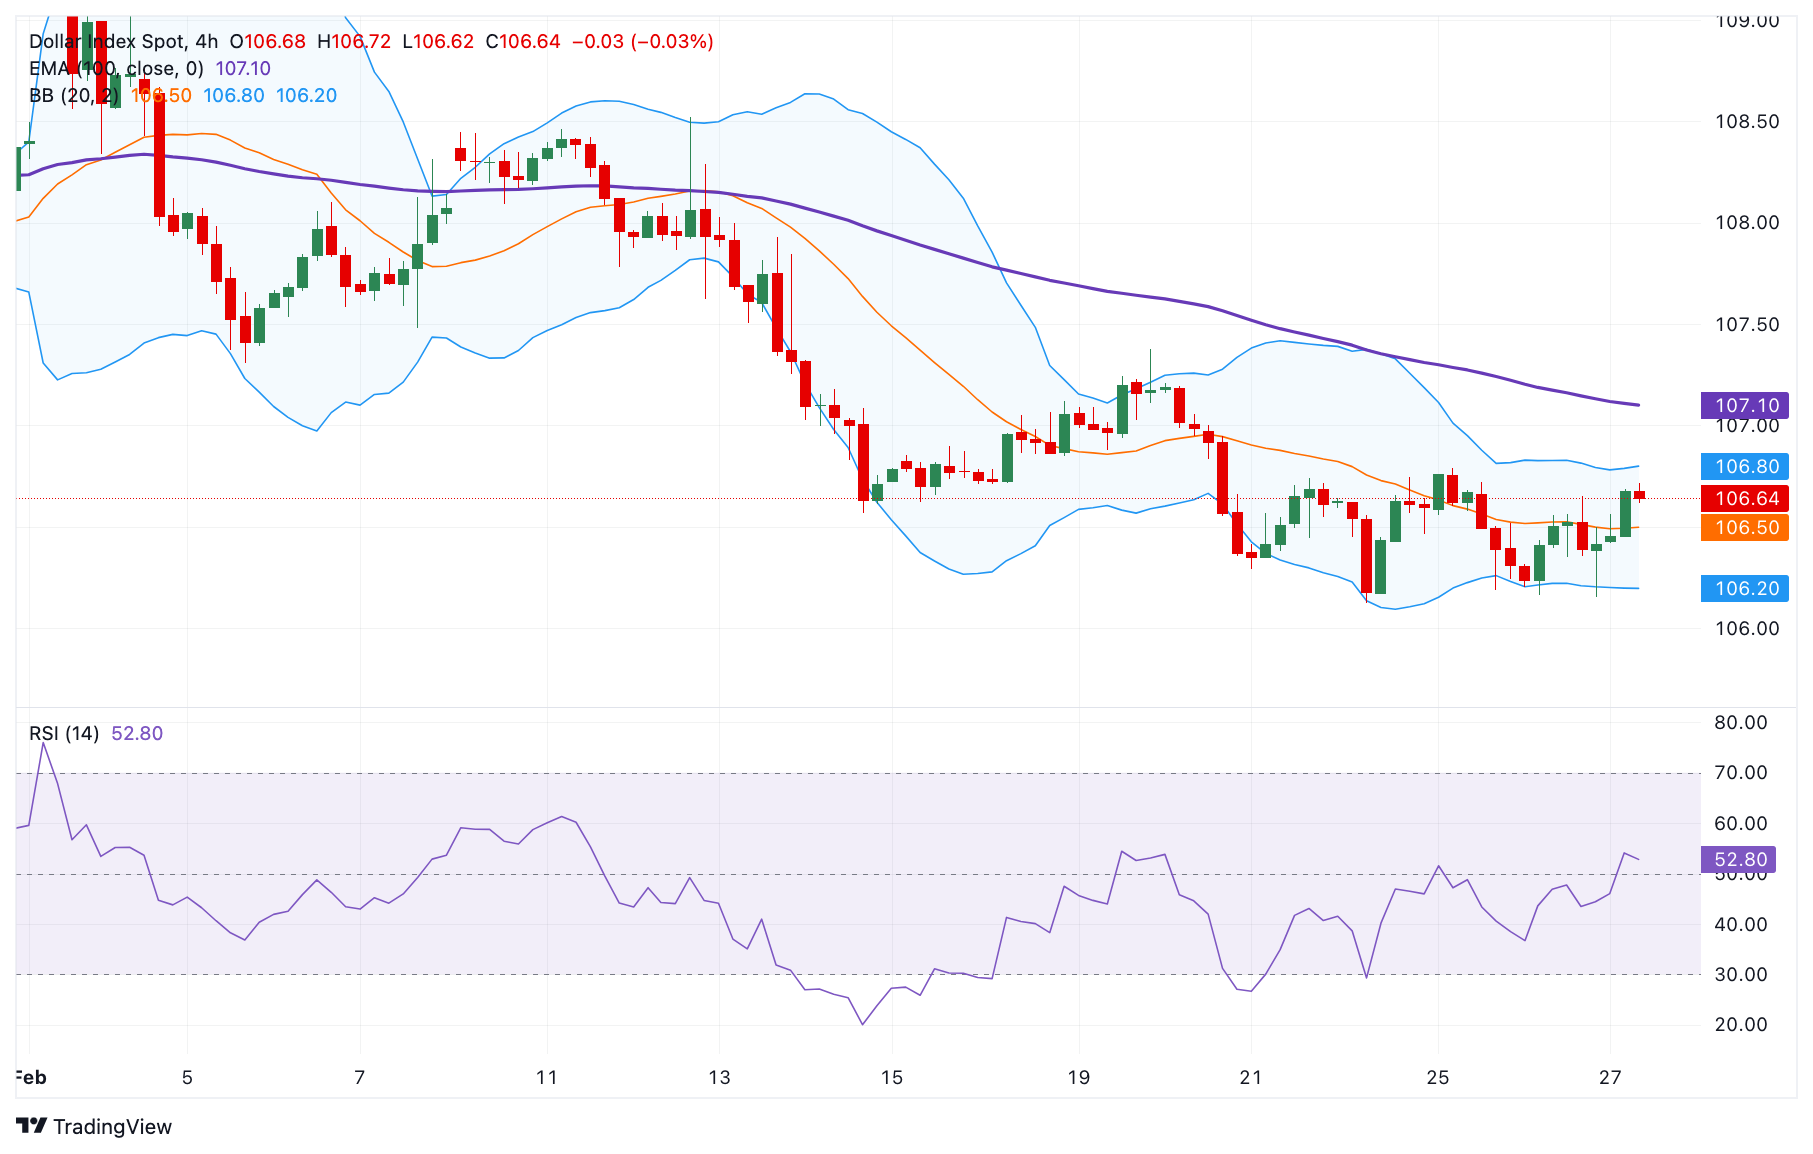
US Dollar FAQs
The US Dollar (USD) is the official currency of the United States of America, and the ‘de facto’ currency of a significant number of other countries where it is found in circulation alongside local notes. It is the most heavily traded currency in the world, accounting for over 88% of all global foreign exchange turnover, or an average of $6.6 trillion in transactions per day, according to data from 2022. Following the second world war, the USD took over from the British Pound as the world’s reserve currency. For most of its history, the US Dollar was backed by Gold, until the Bretton Woods Agreement in 1971 when the Gold Standard went away.
The most important single factor impacting on the value of the US Dollar is monetary policy, which is shaped by the Federal Reserve (Fed). The Fed has two mandates: to achieve price stability (control inflation) and foster full employment. Its primary tool to achieve these two goals is by adjusting interest rates. When prices are rising too quickly and inflation is above the Fed’s 2% target, the Fed will raise rates, which helps the USD value. When inflation falls below 2% or the Unemployment Rate is too high, the Fed may lower interest rates, which weighs on the Greenback.
In extreme situations, the Federal Reserve can also print more Dollars and enact quantitative easing (QE). QE is the process by which the Fed substantially increases the flow of credit in a stuck financial system. It is a non-standard policy measure used when credit has dried up because banks will not lend to each other (out of the fear of counterparty default). It is a last resort when simply lowering interest rates is unlikely to achieve the necessary result. It was the Fed’s weapon of choice to combat the credit crunch that occurred during the Great Financial Crisis in 2008. It involves the Fed printing more Dollars and using them to buy US government bonds predominantly from financial institutions. QE usually leads to a weaker US Dollar.
Quantitative tightening (QT) is the reverse process whereby the Federal Reserve stops buying bonds from financial institutions and does not reinvest the principal from the bonds it holds maturing in new purchases. It is usually positive for the US Dollar.
-
08:00
Turkey Trade Balance up to -7.54B in January from previous -8.78B
-
08:00
Turkey Economic Confidence Index dipped from previous 99.7 to 82.1 in January
-
08:00
Sweden Trade Balance (MoM): 15.1B (January) vs 6.2B
-
06:56
FX option expiries for Feb 27 NY cut
FX option expiries for Feb 27 NY cut at 10:00 Eastern Time via DTCC can be found below.
EUR/USD: EUR amounts
- 1.0430 787m
- 1.0450 1.3b
- 1.0470 832m
- 1.0475 1.2b
GBP/USD: GBP amounts
- 1.2700 935m
USD/JPY: USD amounts
- 148.00 1.3b
- 150.00 2.8b
- 151.05 1.1b
USD/CHF: USD amounts
- 0.8915 568m
- 0.8950 523m
- 0.9040 626m
AUD/USD: AUD amounts
- 0.6245 626m
- 0.6345 606m
USD/CAD: USD amounts
- 1.4200 1.2b
- 1.4350 1.3b
- 1.4370 831m
- 1.4390 982m
- 1.4400 902m
-
06:51
USD/CHF attracts some buyers above 0.8950 as traders await US Q4 GDP release
- USD/CHF extends the rally to near 0.8970 in Thursday’s early European session.
- Global economic uncertainties and geopolitical tensions could boost the Swiss Franc.
- The estimate of the US Q4 GDP data will be in the spotlight later on Thursday.
The USD/CHF pair trades in positive territory for the second consecutive day around 0.8970 during the early European session on Thursday. A modest recovery in the US Dollar (USD) provides some support to the pair. The estimate of US Gross Domestic Product (GDP) for the fourth quarter (Q4) will take center stage later on Thursday.
The renewed levy of tariffs by US President Donald Trump on Canadian and Mexican imports has raised concerns about global trade tensions. Any signs of trade tensions, economic uncertainty and ongoing geopolitical tensions could drive demand for safe-haven currencies like the Swiss Franc (CHF) and create a headwind for USD/CHF.
Worries over US economic growth have boosted expectations that the Federal Reserve (Fed) would deliver at least two rate cuts this year. This, in turn, might cap the upside for the pair. US consumer confidence declined the most since August 2021, falling to 98.3 in February versus 105.3 prior, according to the Conference Board.
Meanwhile, New Home Sales in the US fell by 10.5% MoM to 657,000 units in January from 734,000 units (revised from 698,000) in the previous reading, according to the Commerce Department's Census Bureau on Wednesday. This figure came in weaker than the 680,000 units expected. Investors will closely monitor the US Q4 GDP report, which is due later on Thursday. In case of a stronger-than-expected outcome, this could lift the Greenback.Swiss Franc FAQs
The Swiss Franc (CHF) is Switzerland’s official currency. It is among the top ten most traded currencies globally, reaching volumes that well exceed the size of the Swiss economy. Its value is determined by the broad market sentiment, the country’s economic health or action taken by the Swiss National Bank (SNB), among other factors. Between 2011 and 2015, the Swiss Franc was pegged to the Euro (EUR). The peg was abruptly removed, resulting in a more than 20% increase in the Franc’s value, causing a turmoil in markets. Even though the peg isn’t in force anymore, CHF fortunes tend to be highly correlated with the Euro ones due to the high dependency of the Swiss economy on the neighboring Eurozone.
The Swiss Franc (CHF) is considered a safe-haven asset, or a currency that investors tend to buy in times of market stress. This is due to the perceived status of Switzerland in the world: a stable economy, a strong export sector, big central bank reserves or a longstanding political stance towards neutrality in global conflicts make the country’s currency a good choice for investors fleeing from risks. Turbulent times are likely to strengthen CHF value against other currencies that are seen as more risky to invest in.
The Swiss National Bank (SNB) meets four times a year – once every quarter, less than other major central banks – to decide on monetary policy. The bank aims for an annual inflation rate of less than 2%. When inflation is above target or forecasted to be above target in the foreseeable future, the bank will attempt to tame price growth by raising its policy rate. Higher interest rates are generally positive for the Swiss Franc (CHF) as they lead to higher yields, making the country a more attractive place for investors. On the contrary, lower interest rates tend to weaken CHF.
Macroeconomic data releases in Switzerland are key to assessing the state of the economy and can impact the Swiss Franc’s (CHF) valuation. The Swiss economy is broadly stable, but any sudden change in economic growth, inflation, current account or the central bank’s currency reserves have the potential to trigger moves in CHF. Generally, high economic growth, low unemployment and high confidence are good for CHF. Conversely, if economic data points to weakening momentum, CHF is likely to depreciate.
As a small and open economy, Switzerland is heavily dependent on the health of the neighboring Eurozone economies. The broader European Union is Switzerland’s main economic partner and a key political ally, so macroeconomic and monetary policy stability in the Eurozone is essential for Switzerland and, thus, for the Swiss Franc (CHF). With such dependency, some models suggest that the correlation between the fortunes of the Euro (EUR) and the CHF is more than 90%, or close to perfect.
-
06:32
AUD/JPY drops to its lowest level since September, further below 94.00 mark
- AUD/JPY turns lower for the third straight day and is pressured by a combination of factors.
- BoJ rate hike bets and trade war fears continue to drive safe-haven flows towards the JPY.
- Wednesday’s softer Australian CPI print undermines the AUD and contributes to the slide.
The AUD/JPY cross attracts fresh sellers following an Asian session uptick to the 94.20 area and turns lower for the third straight day on Thursday. This also marks the sixth day of a negative move in the previous seven and drags spot prices to the 93.70 area, or the lowest level since September 2024 in the last hour.
Investors seem convinced that the Bank of Japan (BoJ) will hike interest rates further amid broadening inflation in Japan. This overshadows BoJ Governor Kazuo Ueda's comments last week about potentially increasing regular bond buying and triggers a fresh leg up in JGB yields. Apart from this, concerns about US President Donald Trump's tariff plans further underpin the safe-haven JPY and exert downward pressure on the AUD/JPY cross.
In fact, Trump ordered an investigation on copper imports to assess whether tariffs should be imposed due to national security concerns. This comes on top of 10% tariffs imposed on goods from China and threats of new reciprocal tariffs for each country. Apart from this, Wednesday's softer domestic consumer inflation figures contribute to the Australian Dollar's (AUD) relative underperformance and further weigh on the AUD/JPY cross.
Meanwhile, the latest leg down validates this week's breakdown through the previous year-to-date low, around the 94.25 region. A subsequent fall and acceptance below the 94.00 mark suggests that the path of least resistance for the AUD/JPY cross remains to the downside. Traders now look forward to a slew of key economic reports from Japan on Friday, including Industrial Production, Retail Sales, and Tokyo inflation, for a fresh impetus.
Economic Indicator
Tokyo Consumer Price Index (YoY)
The Tokyo Consumer Price Index (CPI), released by the Statistics Bureau of Japan on a monthly basis, measures the price fluctuation of goods and services purchased by households in the Tokyo region. The index is widely considered as a leading indicator of Japan’s overall CPI as it is published weeks before the nationwide reading. The YoY reading compares prices in the reference month to the same month a year earlier. Generally, a high reading is seen as bullish for the Japanese Yen (JPY), while a low reading is seen as bearish.
Read more.Next release: Thu Feb 27, 2025 23:30
Frequency: Monthly
Consensus: -
Previous: 3.4%
Source: Statistics Bureau of Japan
-
06:32
EUR/GBP falls to near 0.8250 as Trump threatens 25% tariffs on the European Union
- EUR/GBP weakens as President Trump warns of 25% tariffs on the European Union
- The EU vowed to respond against Trump’s proposed tariffs.
- BoE’s Swati Dhingra emphasized the limits of central bank policy in tackling trade-related supply shocks.
EUR/GBP extends its losses for the second consecutive day, trading around 0.8270 during Asian hours on Thursday. The currency cross remains under pressure due to a weakened Euro (EUR) following threats from US President Donald Trump to impose 25% tariffs on the European Union (EU).
Late Wednesday, President Trump reaffirmed his intention to enforce 25% tariffs on Canada and Mexico and announced plans to add the EU to the list of nations facing trade penalties for exports to the United States (US).
In response, the EU pledged to react “firmly and immediately” to these “unjustified” trade barriers, signaling its readiness to retaliate swiftly against the proposed levies. These escalating trade tensions could exacerbate the Eurozone’s economic slowdown and further weigh on the EUR’s performance against its peers.
Meanwhile, Bank of England (BoE) Monetary Policy Committee Member Swati Dhingra highlighted on Wednesday the limitations of central bank policy in addressing trade-based supply shocks. Dhingra noted that if global economic fragmentation proceeds in an orderly fashion, monetary policy interventions may not be necessary. However, in a scenario where external supply shocks become more frequent, having an independent monetary authority with a clear inflation target becomes crucial.
Traders have already priced in two interest rate cuts by the BoE for the year. Nevertheless, Dhingra’s earlier comments suggested she supports more aggressive easing, favoring over four rate cuts. She stated that while the media often interprets the term “gradual” as 25 basis points (bps) per quarter, maintaining this pace throughout the rest of 2025 would still leave monetary policy in an excessively restrictive position by year-end.
Tariffs FAQs
Tariffs are customs duties levied on certain merchandise imports or a category of products. Tariffs are designed to help local producers and manufacturers be more competitive in the market by providing a price advantage over similar goods that can be imported. Tariffs are widely used as tools of protectionism, along with trade barriers and import quotas.
Although tariffs and taxes both generate government revenue to fund public goods and services, they have several distinctions. Tariffs are prepaid at the port of entry, while taxes are paid at the time of purchase. Taxes are imposed on individual taxpayers and businesses, while tariffs are paid by importers.
There are two schools of thought among economists regarding the usage of tariffs. While some argue that tariffs are necessary to protect domestic industries and address trade imbalances, others see them as a harmful tool that could potentially drive prices higher over the long term and lead to a damaging trade war by encouraging tit-for-tat tariffs.
During the run-up to the presidential election in November 2024, Donald Trump made it clear that he intends to use tariffs to support the US economy and American producers. In 2024, Mexico, China and Canada accounted for 42% of total US imports. In this period, Mexico stood out as the top exporter with $466.6 billion, according to the US Census Bureau. Hence, Trump wants to focus on these three nations when imposing tariffs. He also plans to use the revenue generated through tariffs to lower personal income taxes.
-
05:45
EUR/USD drifts lower to near 1.0450 on Trump’s tariff threats
- EUR/USD softens to near 1.0465 in Thursday’s Asian trading hours, down 0.20% on the day.
- Trump vowed to slap 25% tariffs on the EU, weighing on the Euro.
- Traders are once again pricing in two quarter-point interest rate reductions by the Fed.
The EUR/USD pair loses ground to around 1.0465 during the Asian trading hours on Thursday. The Euro (EUR) weakens after US President Donald Trump threatened to slap 25% tariffs on the European Union. Investors await the release of the estimate of US Gross Domestic Product (GDP) for the fourth quarter (Q4) and the weekly Initial Jobless Claims for fresh impetus, which are due later on Thursday.
Late Wednesday, US President Donald Trump reiterated his insistence on 25% tariffs on Canada and Mexico, as well as adding the European Union (EU) to the list of countries from which he will penalize US consumers for importing. The EU vowed to respond “firmly and immediately” to “unjustified” trade barriers, indicating that it stands ready to retaliate swiftly against new levies. Trump’s tariff threats could worsen the Eurozone’s economic slowdown and might drag the shared currency lower against the US Dollar (USD).
Across the pond, the concern about US economic growth has bolstered expectations the US Federal Reserve (Fed) will deliver at least two rate cuts this year, undermining the Greenback. The markets are now pricing about 58 basis points (bps) of easing for 2025, although rates are expected to remain on hold for the next several months, according to the CME FedWatch tool.Euro FAQs
The Euro is the currency for the 19 European Union countries that belong to the Eurozone. It is the second most heavily traded currency in the world behind the US Dollar. In 2022, it accounted for 31% of all foreign exchange transactions, with an average daily turnover of over $2.2 trillion a day. EUR/USD is the most heavily traded currency pair in the world, accounting for an estimated 30% off all transactions, followed by EUR/JPY (4%), EUR/GBP (3%) and EUR/AUD (2%).
The European Central Bank (ECB) in Frankfurt, Germany, is the reserve bank for the Eurozone. The ECB sets interest rates and manages monetary policy. The ECB’s primary mandate is to maintain price stability, which means either controlling inflation or stimulating growth. Its primary tool is the raising or lowering of interest rates. Relatively high interest rates – or the expectation of higher rates – will usually benefit the Euro and vice versa. The ECB Governing Council makes monetary policy decisions at meetings held eight times a year. Decisions are made by heads of the Eurozone national banks and six permanent members, including the President of the ECB, Christine Lagarde.
Eurozone inflation data, measured by the Harmonized Index of Consumer Prices (HICP), is an important econometric for the Euro. If inflation rises more than expected, especially if above the ECB’s 2% target, it obliges the ECB to raise interest rates to bring it back under control. Relatively high interest rates compared to its counterparts will usually benefit the Euro, as it makes the region more attractive as a place for global investors to park their money.
Data releases gauge the health of the economy and can impact on the Euro. Indicators such as GDP, Manufacturing and Services PMIs, employment, and consumer sentiment surveys can all influence the direction of the single currency. A strong economy is good for the Euro. Not only does it attract more foreign investment but it may encourage the ECB to put up interest rates, which will directly strengthen the Euro. Otherwise, if economic data is weak, the Euro is likely to fall. Economic data for the four largest economies in the euro area (Germany, France, Italy and Spain) are especially significant, as they account for 75% of the Eurozone’s economy.
Another significant data release for the Euro is the Trade Balance. This indicator measures the difference between what a country earns from its exports and what it spends on imports over a given period. If a country produces highly sought after exports then its currency will gain in value purely from the extra demand created from foreign buyers seeking to purchase these goods. Therefore, a positive net Trade Balance strengthens a currency and vice versa for a negative balance.
-
05:45
Gold price trades with modest losses; holds above $2,900 amid rising trade tensions
- Gold price drifts lower as an uptick in US bond yields allows the USD to move away from a multi-month low.
- The uncertainty over Trump’s tariff plans and trade war fears should act as tailwinds for the XAU/USD pair.
- Bets that the Fed will cut interest rates further this year might contribute to limiting losses for the yellow metal.
Gold price (XAU/USD) attracts fresh sellers during the Asian session on Thursday, though it manages to hold above the $2,900 round-figure mark. A pickup in the US Treasury bond yields assists the US Dollar (USD) in moving away from its lowest level since December 10 retested on Wednesday and undermines the precious metal. Apart from this, a generally positive tone around the equity markets turns out to be another factor weighing on the safe-haven bullion.
That said, the uncertainty over US President Donald Trump's tariff plans might continue to act as a tailwind for the Gold price. Moreover, signs of a cooling US economy and growth concerns should contribute to limiting losses for the commodity. Traders also seem reluctant and keenly await the release of the US Personal Consumption Expenditure (PCE) Price Index on Friday for cues about the Federal Reserve's interest rate path, which would influence the XAU/USD.
Gold price is pressured by an uptick in US bond yields and modest USD strength
- The US Dollar builds on the overnight bounce from the 11-week low amid a modest bounce in the US Treasury bond yields and exerts some downward pressure on the Gold price during the Asian session on Thursday.
- US President Donald Trump fueled hopes for another pause on steep new tariffs on imports from Mexico and Canada and said on Wednesday that they could take effect on April 2, vs. the previous deadline on March 4.
- A White House official, however, said that the deadline for tariffs on Mexican and Canadian goods remained in effect "as of this moment," pending Trump's review of actions to halt the flow of migrants into the US.
- Furthermore, Trump said that his administration will soon announce a 25% tariff on imports from the European Union, which continues to fuel uncertainty and should act as a tailwind for the safe-haven precious metal.
- Bets for more interest rate cuts by the Federal Reserve this year are on the rise in the wake of the recent downbeat US macro data, which pointed to signs of a cooling economy and fueled concerns about the growth outlook.
- Atlanta Fed President Raphael Bostic noted on Wednesday that the US central bank should hold rates where they are, at a level that continues to put downward pressure on inflation, which has shown a lot of progress but is still high.
- Hence, the focus will remain glued to the release of the US Personal Consumption Expenditures (PCE) Price Index – the Fed's preferred inflation measure – due on Friday for further cues about the central bank's rate-cut path.
- In the meantime, Thursday's US economic docket – featuring the release of the Prelim Q4 GDP print, Durable Goods Orders, Pending Home Sales, and Weekly Initial Jobless Claims – might provide short-term impetuses.
- Apart from this, speeches by influential FOMC members could offer more insights on policy easing this year, which will drive the USD demand and contribute to producing trading opportunities around the XAU/USD pair.
Gold price might continue to attract dip-buyers; $2,860 holds the key for bulls
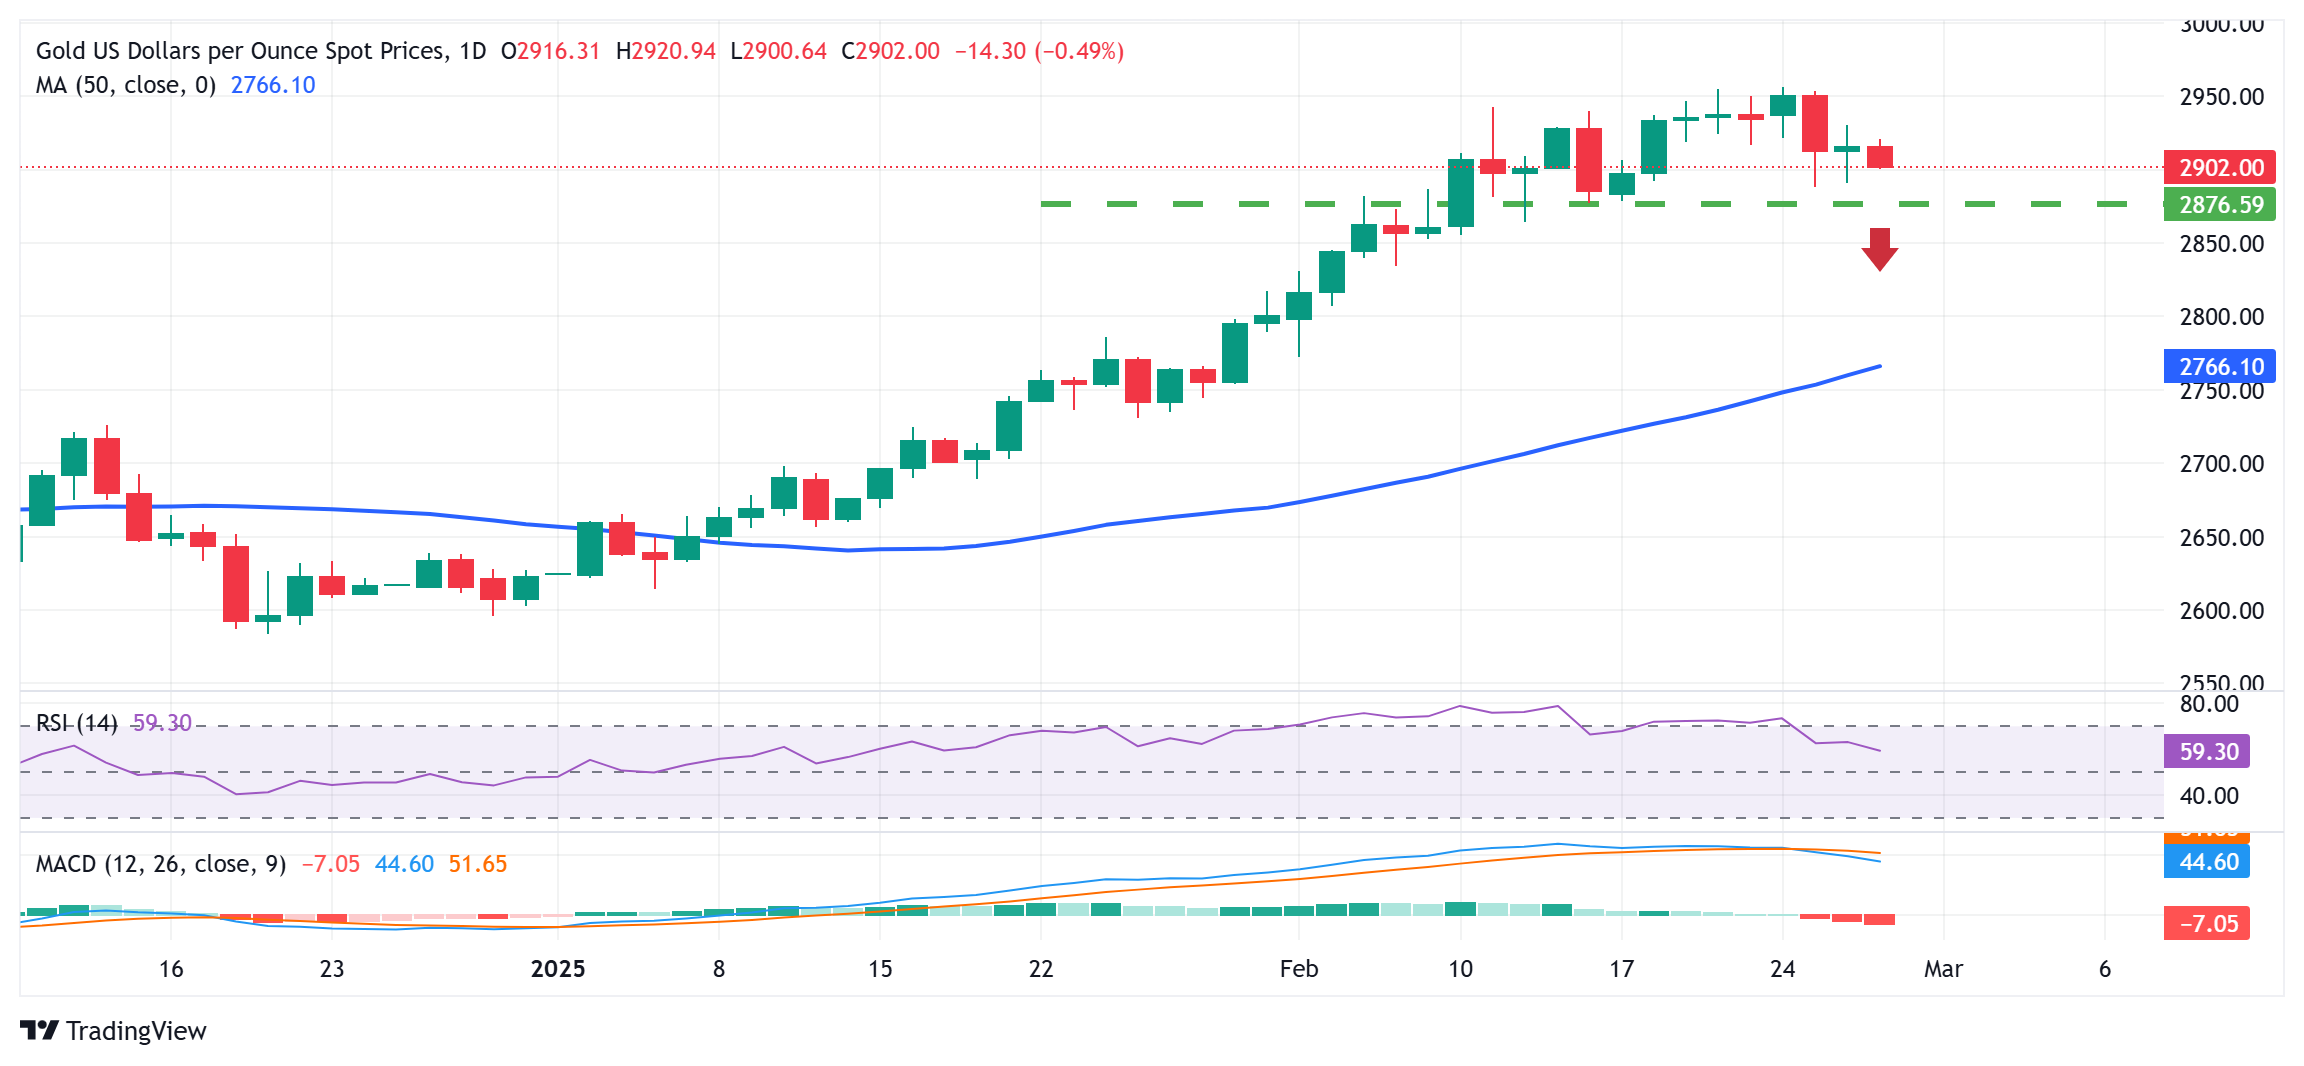
From a technical perspective, the $2,888 area, or over a one-week low touched on Tuesday is likely to act as immediate support ahead of the $2,878 zone and the $2,860-2,855 region. Failure to defend the said support levels could make the Gold price vulnerable to accelerate the corrective decline further towards the $2,834 region en route to the $2,800 round-figure mark.
On the flip side, any positive move beyond the $2,920 immediate hurdle could attract some sellers near the overnight swing high, around the $2,930 region. A sustained strength beyond the latter has the potential to lift the Gold price further toward the $2,950-2,955 horizontal resistance, or the record high touched on the first day of the current week.
Tariffs FAQs
Tariffs are customs duties levied on certain merchandise imports or a category of products. Tariffs are designed to help local producers and manufacturers be more competitive in the market by providing a price advantage over similar goods that can be imported. Tariffs are widely used as tools of protectionism, along with trade barriers and import quotas.
Although tariffs and taxes both generate government revenue to fund public goods and services, they have several distinctions. Tariffs are prepaid at the port of entry, while taxes are paid at the time of purchase. Taxes are imposed on individual taxpayers and businesses, while tariffs are paid by importers.
There are two schools of thought among economists regarding the usage of tariffs. While some argue that tariffs are necessary to protect domestic industries and address trade imbalances, others see them as a harmful tool that could potentially drive prices higher over the long term and lead to a damaging trade war by encouraging tit-for-tat tariffs.
During the run-up to the presidential election in November 2024, Donald Trump made it clear that he intends to use tariffs to support the US economy and American producers. In 2024, Mexico, China and Canada accounted for 42% of total US imports. In this period, Mexico stood out as the top exporter with $466.6 billion, according to the US Census Bureau. Hence, Trump wants to focus on these three nations when imposing tariffs. He also plans to use the revenue generated through tariffs to lower personal income taxes.
-
05:36
India Gold price today: Gold falls, according to FXStreet data
Gold prices fell in India on Thursday, according to data compiled by FXStreet.
The price for Gold stood at 8,151.44 Indian Rupees (INR) per gram, down compared with the INR 8,194.49 it cost on Wednesday.
The price for Gold decreased to INR 95,076.50 per tola from INR 95,579.26 per tola a day earlier.
Unit measure Gold Price in INR 1 Gram 8,151.44 10 Grams 81,513.59 Tola 95,076.50 Troy Ounce 253,538.40 FXStreet calculates Gold prices in India by adapting international prices (USD/INR) to the local currency and measurement units. Prices are updated daily based on the market rates taken at the time of publication. Prices are just for reference and local rates could diverge slightly.
Gold FAQs
Gold has played a key role in human’s history as it has been widely used as a store of value and medium of exchange. Currently, apart from its shine and usage for jewelry, the precious metal is widely seen as a safe-haven asset, meaning that it is considered a good investment during turbulent times. Gold is also widely seen as a hedge against inflation and against depreciating currencies as it doesn’t rely on any specific issuer or government.
Central banks are the biggest Gold holders. In their aim to support their currencies in turbulent times, central banks tend to diversify their reserves and buy Gold to improve the perceived strength of the economy and the currency. High Gold reserves can be a source of trust for a country’s solvency. Central banks added 1,136 tonnes of Gold worth around $70 billion to their reserves in 2022, according to data from the World Gold Council. This is the highest yearly purchase since records began. Central banks from emerging economies such as China, India and Turkey are quickly increasing their Gold reserves.
Gold has an inverse correlation with the US Dollar and US Treasuries, which are both major reserve and safe-haven assets. When the Dollar depreciates, Gold tends to rise, enabling investors and central banks to diversify their assets in turbulent times. Gold is also inversely correlated with risk assets. A rally in the stock market tends to weaken Gold price, while sell-offs in riskier markets tend to favor the precious metal.
The price can move due to a wide range of factors. Geopolitical instability or fears of a deep recession can quickly make Gold price escalate due to its safe-haven status. As a yield-less asset, Gold tends to rise with lower interest rates, while higher cost of money usually weighs down on the yellow metal. Still, most moves depend on how the US Dollar (USD) behaves as the asset is priced in dollars (XAU/USD). A strong Dollar tends to keep the price of Gold controlled, whereas a weaker Dollar is likely to push Gold prices up.
(An automation tool was used in creating this post.)
-
05:30
USD/CAD Price Forecast: Rises above 1.4350 amid strengthening bullish bias
- USD/CAD may rise toward the “pullback resistance” near the key psychological level of 1.4450.
- The bullish outlook stays intact, supported by the 14-day Relative Strength Index holding above 50.
- The nine-day Exponential Moving Average at 1.4286 could serve as the primary support level.
The USD/CAD pair continues its winning streak for the fifth successive day, trading around 1.4360 during the Asian hours on Thursday. Technical analysis on the daily chart indicates that the pair rises above nine- and 14-day Exponential Moving Averages (EMAs), suggesting a strengthening short-term price momentum.
Additionally, the 14-day Relative Strength Index (RSI) remains above the 50 level, indicating a prevailing bullish outlook.
The USD/CAD pair could explore the region around the “pullback resistance” at a psychological level of 1.4450. A decisive break above this level would open the doors for the pair to approach the 1.4793, the highest since March 2003, reached on February 3.
On the downside, the initial support appears at the nine-day EMA of 1.4286, aligned with the 14-day EMA at 1.4284. A break below these levels could weaken the short-term price momentum and put pressure on the pair to test a two-month low at 1.4151, which was recorded on February 14.
A successful break below the two-month low could lead the USD/CAD pair to navigate the region around the three-month low of 1.3927, last reached on November 25.
USD/CAD: Daily Chart
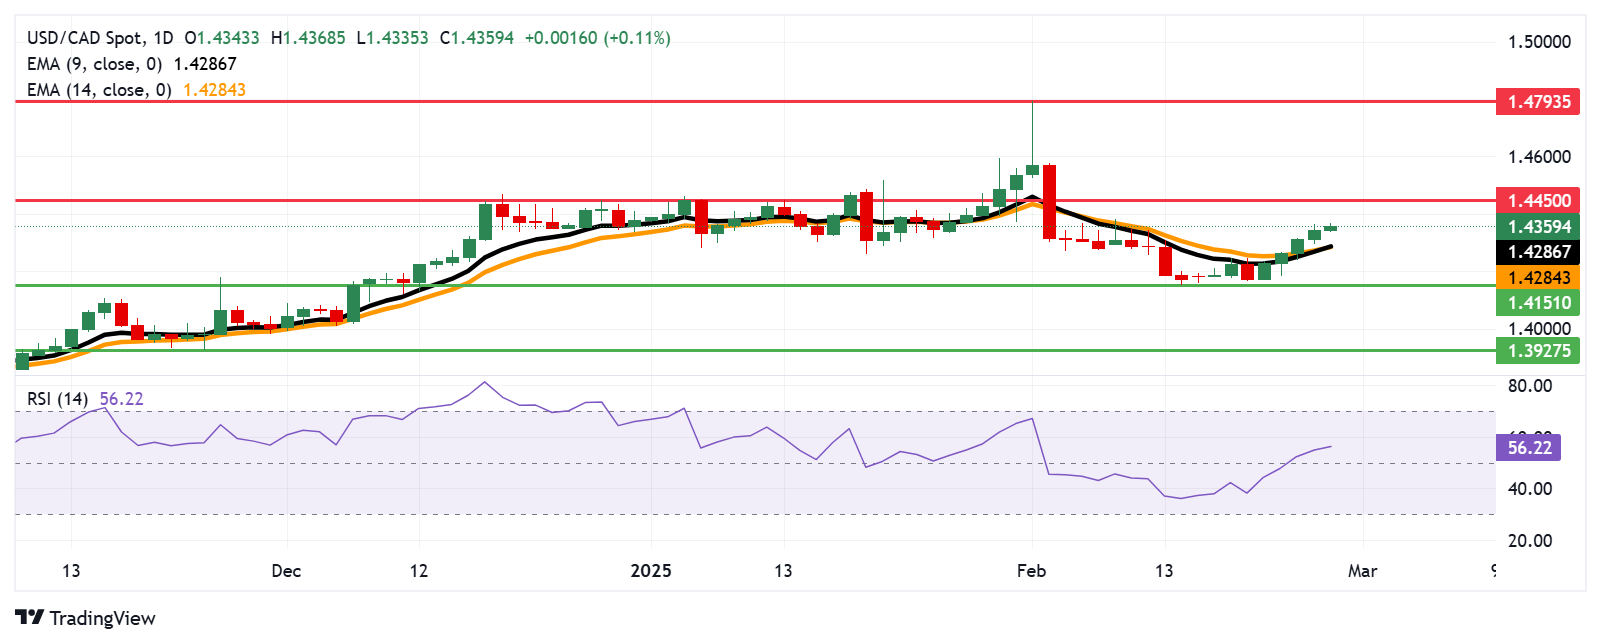
Canadian Dollar PRICE Today
The table below shows the percentage change of Canadian Dollar (CAD) against listed major currencies today. Canadian Dollar was the strongest against the New Zealand Dollar.
USD EUR GBP JPY CAD AUD NZD CHF USD 0.20% 0.16% 0.09% 0.12% 0.19% 0.30% 0.29% EUR -0.20% -0.04% -0.09% -0.07% 0.00% 0.10% 0.09% GBP -0.16% 0.04% -0.04% -0.04% 0.04% 0.14% 0.13% JPY -0.09% 0.09% 0.04% 0.01% 0.08% 0.15% 0.18% CAD -0.12% 0.07% 0.04% -0.01% 0.08% 0.18% 0.17% AUD -0.19% -0.00% -0.04% -0.08% -0.08% 0.10% 0.10% NZD -0.30% -0.10% -0.14% -0.15% -0.18% -0.10% -0.01% CHF -0.29% -0.09% -0.13% -0.18% -0.17% -0.10% 0.00% The heat map shows percentage changes of major currencies against each other. The base currency is picked from the left column, while the quote currency is picked from the top row. For example, if you pick the Canadian Dollar from the left column and move along the horizontal line to the US Dollar, the percentage change displayed in the box will represent CAD (base)/USD (quote).
-
05:00
PBOC’s Lu: Central bank must issue special treasury bonds to help major state-owned banks
The People's Bank of China (PBOC) Deputy Governor Lu Lei suggested on Thursday that the Bank should actively facilitate fundraising, including the issuance of special treasury bonds, to help major state-owned banks replenish their Common Equity Tier 1 (CET1) capital.
Additional quotes
Strengthening capital reserves would enhance banks' ability to manage risks and support the real economy.
The PBOC should advance reforms in policy and development banking.
Funding directed towards tech and manufacturing industries.
Market reaction
These comments have little to no impact on the Chinese proxy, the Australian Dollar (AUD). The pair is currently trading flat at 0.6300.
PBOC FAQs
The primary monetary policy objectives of the People's Bank of China (PBoC) are to safeguard price stability, including exchange rate stability, and promote economic growth. China’s central bank also aims to implement financial reforms, such as opening and developing the financial market.
The PBoC is owned by the state of the People's Republic of China (PRC), so it is not considered an autonomous institution. The Chinese Communist Party (CCP) Committee Secretary, nominated by the Chairman of the State Council, has a key influence on the PBoC’s management and direction, not the governor. However, Mr. Pan Gongsheng currently holds both of these posts.
Unlike the Western economies, the PBoC uses a broader set of monetary policy instruments to achieve its objectives. The primary tools include a seven-day Reverse Repo Rate (RRR), Medium-term Lending Facility (MLF), foreign exchange interventions and Reserve Requirement Ratio (RRR). However, The Loan Prime Rate (LPR) is China’s benchmark interest rate. Changes to the LPR directly influence the rates that need to be paid in the market for loans and mortgages and the interest paid on savings. By changing the LPR, China’s central bank can also influence the exchange rates of the Chinese Renminbi.
Yes, China has 19 private banks – a small fraction of the financial system. The largest private banks are digital lenders WeBank and MYbank, which are backed by tech giants Tencent and Ant Group, per The Straits Times. In 2014, China allowed domestic lenders fully capitalized by private funds to operate in the state-dominated financial sector.
-
04:42
GBP/USD holds losses near 1.2650 as risk aversion intensifies, US Treasury yields climb
- GBP/USD slips as the US Dollar gains strength amid heightened risk aversion and rising US Treasury yields.
- Federal Reserve’s Raphael Bostic suggested keeping interest rates steady to maintain pressure on inflation.
- BoE’s Swati Dhingra noted that higher US tariffs could boost the US Dollar, potentially driving up prices in the UK.
GBP/USD depreciates after two consecutive sessions of gains, trading around 1.2660 during Asian hours on Thursday. The pair loses ground as the US Dollar (USD) strengthens amid increased risk aversion and rising US Treasury yields.
Federal Reserve Bank of Atlanta President Raphael Bostic stated late Wednesday that the Fed should maintain current interest rates to continue applying downward pressure on inflation, according to Bloomberg. Bostic noted the need for more data to determine if January’s inflation was a temporary bump or the start of a trend. He emphasized that Fed policy remains restrictive and should stay that way.
The US Dollar Index (DXY), which measures the USD against six major currencies, advanced near 106.50, with 2-year and 10-year US Treasury bond yields standing at 4.08% and 4.27%, respectively, at the time of writing.
US Commerce Secretary Howard Lutnick announced late Wednesday that April 3 would serve as the baseline for reciprocal tariff data. He also stated that Chinese vehicles would not be allowed in the US, citing China as a major concern. Separately, US Treasury Secretary Scott Bessent reaffirmed his commitment to working with Congress to make President Trump’s tax cuts permanent.
Bank of England (BoE) Monetary Policy Committee Member Swati Dhingra commented on Wednesday that higher US tariffs could strengthen the US Dollar in the short term, leading to some price-increasing effects in the United Kingdom (UK). However, she noted that the overall inflationary impact in the UK would likely be offset by reduced global price pressures resulting from these tariffs.
British Pound PRICE Today
The table below shows the percentage change of British Pound (GBP) against listed major currencies today. British Pound was the weakest against the Australian Dollar.
USD EUR GBP JPY CAD AUD NZD CHF USD 0.14% 0.09% 0.13% 0.07% -0.01% 0.09% 0.24% EUR -0.14% -0.04% -0.02% -0.07% -0.15% -0.05% 0.10% GBP -0.09% 0.04% 0.06% -0.03% -0.10% -0.00% 0.15% JPY -0.13% 0.02% -0.06% -0.10% -0.16% -0.10% 0.09% CAD -0.07% 0.07% 0.03% 0.10% -0.07% 0.03% 0.18% AUD 0.00% 0.15% 0.10% 0.16% 0.07% 0.10% 0.26% NZD -0.09% 0.05% 0.00% 0.10% -0.03% -0.10% 0.15% CHF -0.24% -0.10% -0.15% -0.09% -0.18% -0.26% -0.15% The heat map shows percentage changes of major currencies against each other. The base currency is picked from the left column, while the quote currency is picked from the top row. For example, if you pick the British Pound from the left column and move along the horizontal line to the US Dollar, the percentage change displayed in the box will represent GBP (base)/USD (quote).
Pound Sterling FAQs
The Pound Sterling (GBP) is the oldest currency in the world (886 AD) and the official currency of the United Kingdom. It is the fourth most traded unit for foreign exchange (FX) in the world, accounting for 12% of all transactions, averaging $630 billion a day, according to 2022 data. Its key trading pairs are GBP/USD, also known as ‘Cable’, which accounts for 11% of FX, GBP/JPY, or the ‘Dragon’ as it is known by traders (3%), and EUR/GBP (2%). The Pound Sterling is issued by the Bank of England (BoE).
The single most important factor influencing the value of the Pound Sterling is monetary policy decided by the Bank of England. The BoE bases its decisions on whether it has achieved its primary goal of “price stability” – a steady inflation rate of around 2%. Its primary tool for achieving this is the adjustment of interest rates. When inflation is too high, the BoE will try to rein it in by raising interest rates, making it more expensive for people and businesses to access credit. This is generally positive for GBP, as higher interest rates make the UK a more attractive place for global investors to park their money. When inflation falls too low it is a sign economic growth is slowing. In this scenario, the BoE will consider lowering interest rates to cheapen credit so businesses will borrow more to invest in growth-generating projects.
Data releases gauge the health of the economy and can impact the value of the Pound Sterling. Indicators such as GDP, Manufacturing and Services PMIs, and employment can all influence the direction of the GBP. A strong economy is good for Sterling. Not only does it attract more foreign investment but it may encourage the BoE to put up interest rates, which will directly strengthen GBP. Otherwise, if economic data is weak, the Pound Sterling is likely to fall.
Another significant data release for the Pound Sterling is the Trade Balance. This indicator measures the difference between what a country earns from its exports and what it spends on imports over a given period. If a country produces highly sought-after exports, its currency will benefit purely from the extra demand created from foreign buyers seeking to purchase these goods. Therefore, a positive net Trade Balance strengthens a currency and vice versa for a negative balance.
-
04:00
Silver Price Forecast: XAG/USD seems vulnerable below $32.00; 100-day SMA holds the key
- Silver remains below $32.00 on Thursday and close to a two-week low touched on Tuesday.
- The technical setup seems tilted in favor of bears and supports prospects for further losses.
- A sustained break below the 100-day SMA support is needed to reaffirm the negative bias.
Silver (XAG/USD) struggles to capitalize on the previous day's modest gains and oscillates in a narrow trading band, below the $32.00 round-figure mark during the Asian session on Thursday. The white metal, meanwhile, holds above the 100-day Simple Moving Average (SMA) pivotal support, currently pegged near the $31.30-$31.25 zone, or a two-week low touched on Tuesday.
From a technical perspective, the recent repeated failures to find acceptance above the $33.00 mark and the subsequent downfall favor bearish traders. Moreover, oscillators on the daily chart have just started gaining negative traction and support prospects for an extension of a one-week-old downtrend. The XAG/USD might then weaken further below the $31.00 round-figure mark, towards testing the next relevant support near the $30.25 region.
The downward trajectory could extend further towards the $30.00 psychological mark. A convincing break below the latter will suggest that the XAG/USD has topped out in the near term and pave the way for a further depreciating move towards the $29.55-$29.50 horizontal zone en route to the $29.00 round figure and December 2024 swing low, around the $28.80-$28.75 area.
On the flip side, any positive move beyond the $32.00 mark is likely to confront some resistance near the $32.40-$32.45 region. Some follow-through buying should allow the XAG/USD to make a fresh attempt toward conquering the $33.00 round figure. A sustained strength beyond the latter could lift the commodity towards the monthly swing high, around the $33.40 area touched on February 14, and aim towards reclaiming the $34.00 mark.
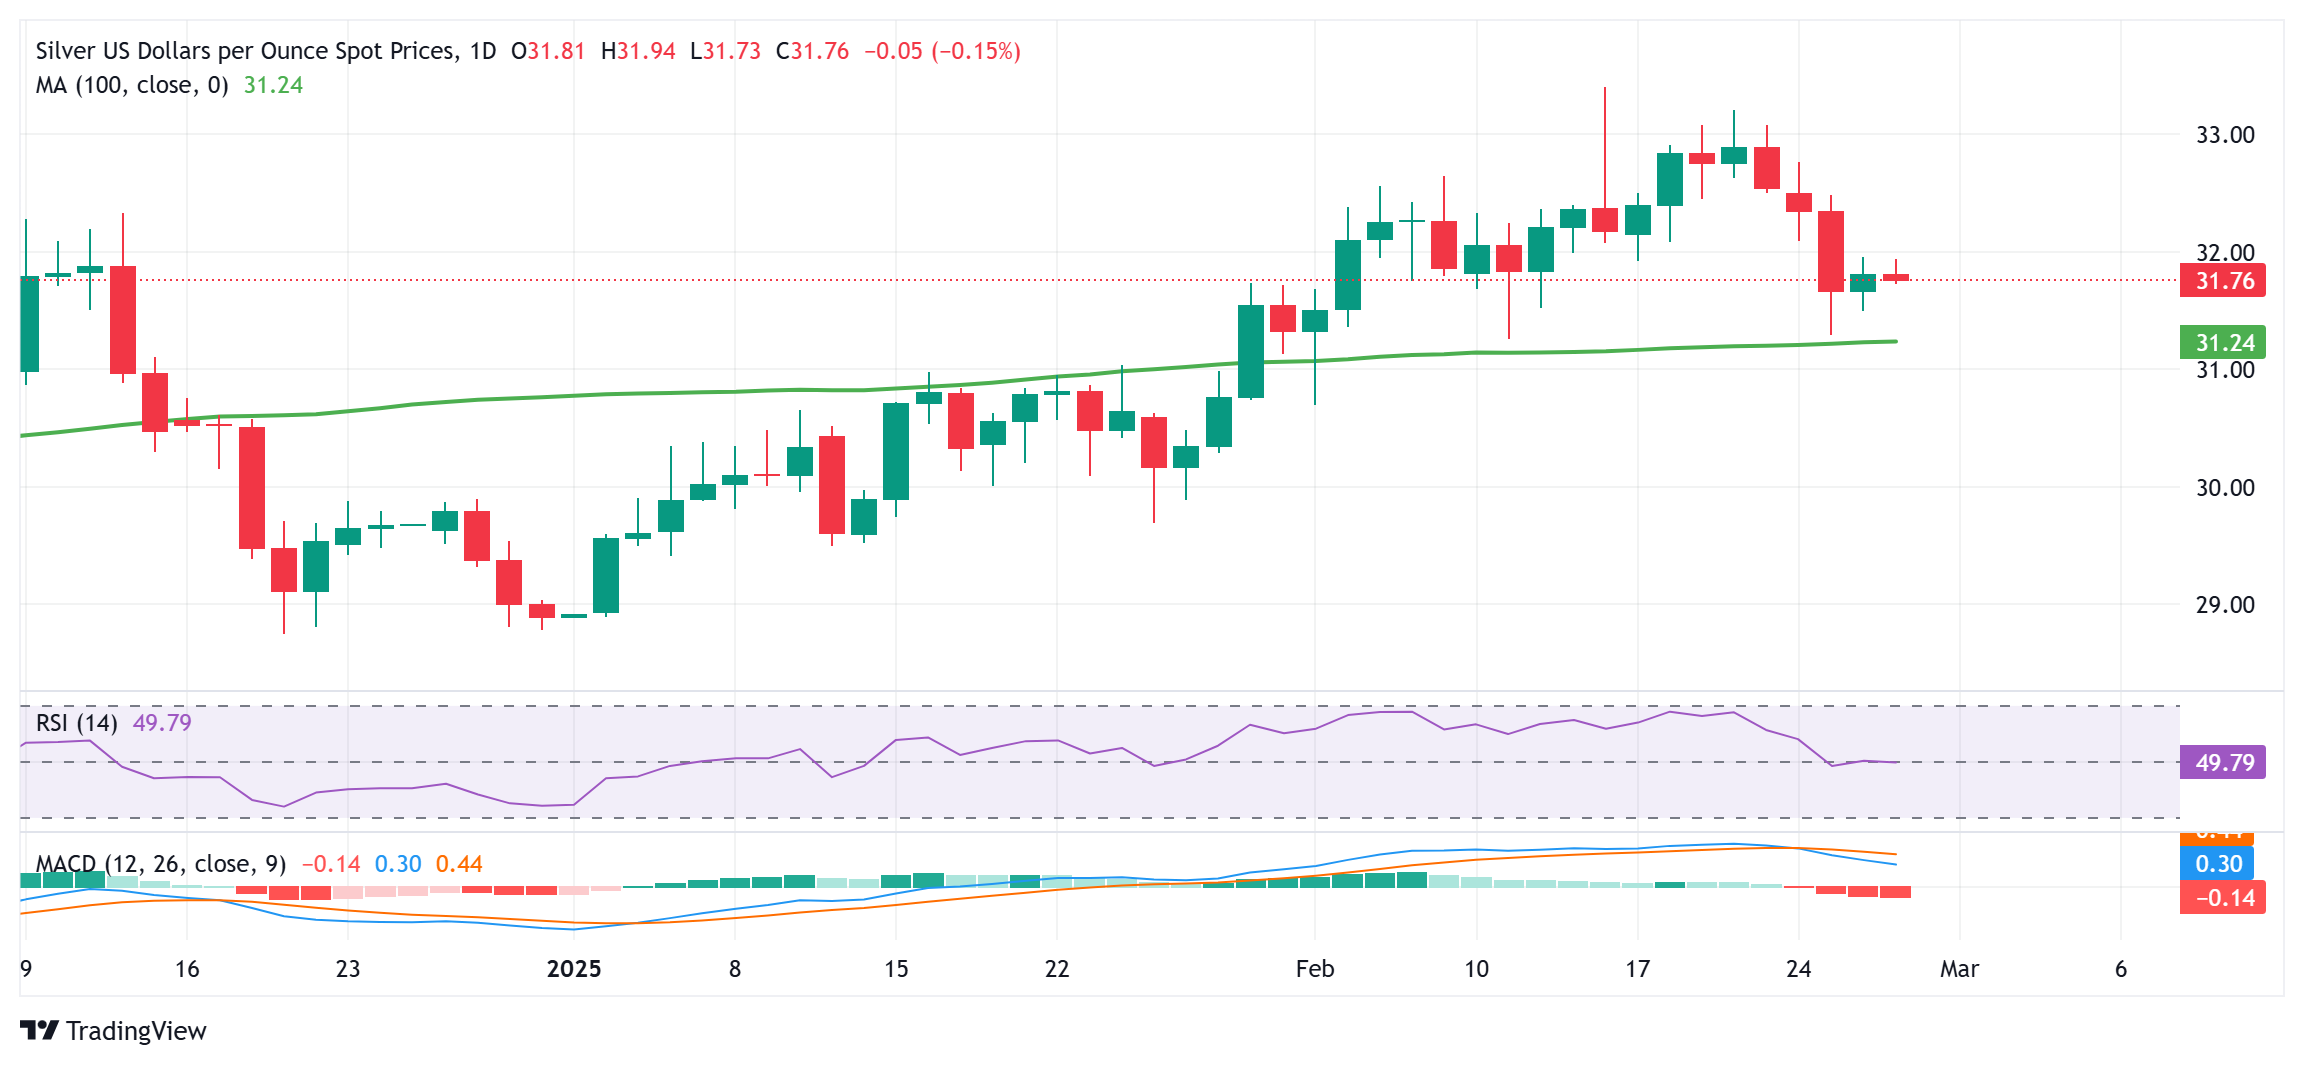
Silver FAQs
Silver is a precious metal highly traded among investors. It has been historically used as a store of value and a medium of exchange. Although less popular than Gold, traders may turn to Silver to diversify their investment portfolio, for its intrinsic value or as a potential hedge during high-inflation periods. Investors can buy physical Silver, in coins or in bars, or trade it through vehicles such as Exchange Traded Funds, which track its price on international markets.
Silver prices can move due to a wide range of factors. Geopolitical instability or fears of a deep recession can make Silver price escalate due to its safe-haven status, although to a lesser extent than Gold's. As a yieldless asset, Silver tends to rise with lower interest rates. Its moves also depend on how the US Dollar (USD) behaves as the asset is priced in dollars (XAG/USD). A strong Dollar tends to keep the price of Silver at bay, whereas a weaker Dollar is likely to propel prices up. Other factors such as investment demand, mining supply – Silver is much more abundant than Gold – and recycling rates can also affect prices.
Silver is widely used in industry, particularly in sectors such as electronics or solar energy, as it has one of the highest electric conductivity of all metals – more than Copper and Gold. A surge in demand can increase prices, while a decline tends to lower them. Dynamics in the US, Chinese and Indian economies can also contribute to price swings: for the US and particularly China, their big industrial sectors use Silver in various processes; in India, consumers’ demand for the precious metal for jewellery also plays a key role in setting prices.
Silver prices tend to follow Gold's moves. When Gold prices rise, Silver typically follows suit, as their status as safe-haven assets is similar. The Gold/Silver ratio, which shows the number of ounces of Silver needed to equal the value of one ounce of Gold, may help to determine the relative valuation between both metals. Some investors may consider a high ratio as an indicator that Silver is undervalued, or Gold is overvalued. On the contrary, a low ratio might suggest that Gold is undervalued relative to Silver.
-
03:47
USD/INR flat lines ahead of US GDP data
- The Indian Rupee trades on a flat note in Thursday’s Asian session.
- Rising US Dollar demand and continued capital outflows undermine the INR, but RBI intervention might cap its downside.
- The estimate of the US Q4 GDP report will take center stage later on Thursday.
The Indian Rupee (INR) holds steady on Thursday. The local currency remains on the defensive due to month-end US Dollar (USD) demand by importers. Additionally, capital outflows amid uncertainty over US trade tariffs contribute to the INR’s downside. Nonetheless, a likely foreign exchange intervention by the Reserve Bank of India (RBI) might help limit the Indian Rupee’s depreciation.
Looking ahead, traders will keep an eye on the estimate of US Gross Domestic Product (GDP) for the fourth quarter (Q4), along with the weekly Initial Jobless Claims, which are due later on Thursday. Fedspeak will be in focus as it might offer some hints about the interest rate path in the United States. The Federal Reserve’s (Fed) Michelle Bowman, Beth Hammack and Patrick Harker are scheduled to speak.Indian Rupee steadies amid USD demand and foreign outflows
- “Rupee traded very weak as FII sell-off continued and crude oil prices remained elevated amid US tariffs on Iran, which pushed oil demand higher. The dollar index at 106.65 also added to the pressure on the rupee,” said Jateen Trivedi, Research Analyst at LKP Securities.
- Late Wednesday, US President Donald Trump reiterated his insistence on 25% tariffs on Canada and Mexico, as well as adding the European Union (EU) to the list of countries from which he will penalize US consumers for importing.
- New Home Sales in the US fell by 10.5% MoM to 657,000 units in January from 734,000 units (revised from 698,000) in the previous reading, according to the Commerce Department's Census Bureau on Wednesday. This figure came in weaker than the 680,000 units expected.
- Atlanta Fed President Raphael Bostic said late Wednesday that the Fed should hold interest rates where they are, at a level that continues to put downward pressure on inflation, per Bloomberg.
- Richmond Fed President Thomas Barkin noted that he will follow a wait-and-see approach regarding central bank interest rate policy until it is clear inflation is returning to the Fed's 2% target.
USD/INR’s outlook remains bullish despite consolidation in the shorter term
The Indian Rupee trades flat on the day. The USD/INR maintains the constructive view on the daily chart, characterized by the price holding above the key 100-day Exponential Moving Average (EMA). The upward momentum is reinforced by the 14-day Relative Strength Index (RSI), which stands above the midline near 59.50, suggesting that further upside looks favorable.
In the bullish case, the first upside target to watch is 87.25, the high of February 25. Extended gains above this level could push the price to an all-time high near 88.00. The next hurdle is seen at 88.50.
On the flip side, the low of February 21 at 86.48 acts as an initial support level for the pair. Further south, the next contention level is located at 86.14, the low of January 27, followed by 85.65, the low of January 7.Indian Rupee FAQs
The Indian Rupee (INR) is one of the most sensitive currencies to external factors. The price of Crude Oil (the country is highly dependent on imported Oil), the value of the US Dollar – most trade is conducted in USD – and the level of foreign investment, are all influential. Direct intervention by the Reserve Bank of India (RBI) in FX markets to keep the exchange rate stable, as well as the level of interest rates set by the RBI, are further major influencing factors on the Rupee.
The Reserve Bank of India (RBI) actively intervenes in forex markets to maintain a stable exchange rate, to help facilitate trade. In addition, the RBI tries to maintain the inflation rate at its 4% target by adjusting interest rates. Higher interest rates usually strengthen the Rupee. This is due to the role of the ‘carry trade’ in which investors borrow in countries with lower interest rates so as to place their money in countries’ offering relatively higher interest rates and profit from the difference.
Macroeconomic factors that influence the value of the Rupee include inflation, interest rates, the economic growth rate (GDP), the balance of trade, and inflows from foreign investment. A higher growth rate can lead to more overseas investment, pushing up demand for the Rupee. A less negative balance of trade will eventually lead to a stronger Rupee. Higher interest rates, especially real rates (interest rates less inflation) are also positive for the Rupee. A risk-on environment can lead to greater inflows of Foreign Direct and Indirect Investment (FDI and FII), which also benefit the Rupee.
Higher inflation, particularly, if it is comparatively higher than India’s peers, is generally negative for the currency as it reflects devaluation through oversupply. Inflation also increases the cost of exports, leading to more Rupees being sold to purchase foreign imports, which is Rupee-negative. At the same time, higher inflation usually leads to the Reserve Bank of India (RBI) raising interest rates and this can be positive for the Rupee, due to increased demand from international investors. The opposite effect is true of lower inflation.
-
03:44
WTI hovers around $68.50 near two-month lows amid prospects of increased supply
- WTI price stays subdued amid rising supply expectations and a weakening demand outlook.
- Oil prices remain under pressure amid the possibility of a Russia-Ukraine peace deal and the potential easing of Russian sanctions.
- President Trump announced plans to revoke Chevron Corp.’s Oil license in Venezuela.
West Texas Intermediate (WTI) oil price remains near a two-month low at $68.29 recorded on February 26, hovering around $68.70 per barrel during Asian trading hours on Thursday. Crude oil prices continue to face pressure from expectations of increased supply and a bearish demand outlook.
The possibility of a Russia-Ukraine peace deal has also weighed on prices, as the potential easing of Russian sanctions could lead to a higher global Oil supply. Additionally, concerns over economic growth have added to the headwinds, with fears that tariffs imposed by US President Donald Trump on China and other trading partners could weaken demand.
In a related development, the United States (US) and Ukraine have reportedly agreed on the terms of a draft minerals deal crucial to Kyiv’s efforts to secure Washington’s support. According to sources cited by Reuters on Tuesday, President Donald Trump is seeking to swiftly end the conflict with Russia.
On Wednesday, President Trump announced plans to revoke Chevron Corp.’s Oil license in Venezuela. Venezuelan Vice President Delcy Rodriguez criticized the decision, calling it "damaging and inexplicable," as reported by Reuters.
In Iraq, the Kurdistan regional government has reached an agreement with the federal Oil ministry to resume Kurdish crude exports based on available volumes. However, the restart is pending Turkey’s approval. The pipeline has been shut since March 2023, following an International Chamber of Commerce (ICC) ruling ordering Turkey to pay Baghdad $1.5 billion in damages for unauthorized exports between 2014 and 2018.
WTI Oil FAQs
WTI Oil is a type of Crude Oil sold on international markets. The WTI stands for West Texas Intermediate, one of three major types including Brent and Dubai Crude. WTI is also referred to as “light” and “sweet” because of its relatively low gravity and sulfur content respectively. It is considered a high quality Oil that is easily refined. It is sourced in the United States and distributed via the Cushing hub, which is considered “The Pipeline Crossroads of the World”. It is a benchmark for the Oil market and WTI price is frequently quoted in the media.
Like all assets, supply and demand are the key drivers of WTI Oil price. As such, global growth can be a driver of increased demand and vice versa for weak global growth. Political instability, wars, and sanctions can disrupt supply and impact prices. The decisions of OPEC, a group of major Oil-producing countries, is another key driver of price. The value of the US Dollar influences the price of WTI Crude Oil, since Oil is predominantly traded in US Dollars, thus a weaker US Dollar can make Oil more affordable and vice versa.
The weekly Oil inventory reports published by the American Petroleum Institute (API) and the Energy Information Agency (EIA) impact the price of WTI Oil. Changes in inventories reflect fluctuating supply and demand. If the data shows a drop in inventories it can indicate increased demand, pushing up Oil price. Higher inventories can reflect increased supply, pushing down prices. API’s report is published every Tuesday and EIA’s the day after. Their results are usually similar, falling within 1% of each other 75% of the time. The EIA data is considered more reliable, since it is a government agency.
OPEC (Organization of the Petroleum Exporting Countries) is a group of 12 Oil-producing nations who collectively decide production quotas for member countries at twice-yearly meetings. Their decisions often impact WTI Oil prices. When OPEC decides to lower quotas, it can tighten supply, pushing up Oil prices. When OPEC increases production, it has the opposite effect. OPEC+ refers to an expanded group that includes ten extra non-OPEC members, the most notable of which is Russia.
-
03:30
Japanese Yen weakens amid sliding JGB yields; USD/JPY moves closer to mid-149.00s
- The Japanese Yen attracts some sellers amid the recent sharp pullback in JGB yields.
- Bets that the BoJ will hike interest rates further should help limit losses for the JPY.
- Expectations for more Fed rate cuts might cap the upside for the USD and USD/JPY.
The Japanese Yen (JPY) is ticking lower against its American counterpart during the Asian session on Thursday, though it remains close to the highest level since October 2024 touched earlier this week. Bank of Japan (BoJ) Governor Kazuo Ueda's comments last week about potentially increasing regular bond buying led to a further decline in the Japanese government (JGB) bond yields. Apart from this, concerns over US President Donald Trump's tariff plans and a positive risk tone turn out to be key factors undermining the JPY.
Any meaningful JPY depreciation, however, still seems elusive in the wake of the growing market acceptance that the BoJ will continue raising interest rates this year amid broadening inflation in Japan. In contrast, expectations that a cooling US economy would give the Federal Reserve (Fed) more impetus to cut interest rates keep the US Dollar (USD) bulls on the sidelines and cap the USD/JPY pair. Traders also seem reluctant ahead of the release of the US Personal Consumption Expenditure (PCE) Price Index on Friday.
Japanese Yen is pressured by declining JGB yields; downside seems limited amid BoJ rate hike bets
- Bank of Japan Governor Kazuo Ueda said last week the central bank was ready to increase government bond buying if long-term interest rates rise sharply, dragging Japanese government bond yields away from a more-than-a-decade high.
- In fact, the yield on the benchmark 10-year JGB touched its lowest level since February 12 and undermined the Japanese Yen, pushing the USD/JPY pair back closer to mid-149.00s during the Asian session on Thursday.
- Japan’s inflation accelerated at the fastest pace since the summer of 2023 in January and keeps the Bank of Japan on track to raise its benchmark interest rate further, which might hold back traders from placing aggressive JPY bearish bets.
- US President Donald Trump ordered an investigation on copper imports to assess whether tariffs should be imposed due to national security concerns. Trump also confirmed that tariffs on Canada and Mexico are "on time and on schedule".
- Trump has already raised tariffs on goods from China and threatened new reciprocal tariffs for each country. Furthermore, Trump said on Wednesday that his administration will soon announce a 25% tariff on imports from the European Union.
- Bets for more interest rate cuts by the Federal Reserve are on the rise amid the recent downbeat US macro data, which pointed to a cooling economy and fueled worries about the growth outlook. This keeps the US Dollar bulls on the defensive.
- Atlanta Fed President Raphael Bostic said on Wednesday that inflation has seen a lot of progress, though is still high and the US central bank should hold rates where they are, at a level that continues to put downward pressure on inflation.
- Investors now look forward to a slew of key economic reports from Japan, due on Friday, including Industrial Production, Retail Sales, and Tokyo inflation, which could provide further clarity on the BoJ's monetary policy outlook.
- Friday's economic docket also features the release of the US Personal Consumption Expenditure (PCE) Price Index – the Fed's preferred inflation gauge. This would influence the USD and provide a fresh impetus to the USD/JPY pair.
USD/JPY could attract fresh sellers near the overnight swing high and remain capped near 150.00
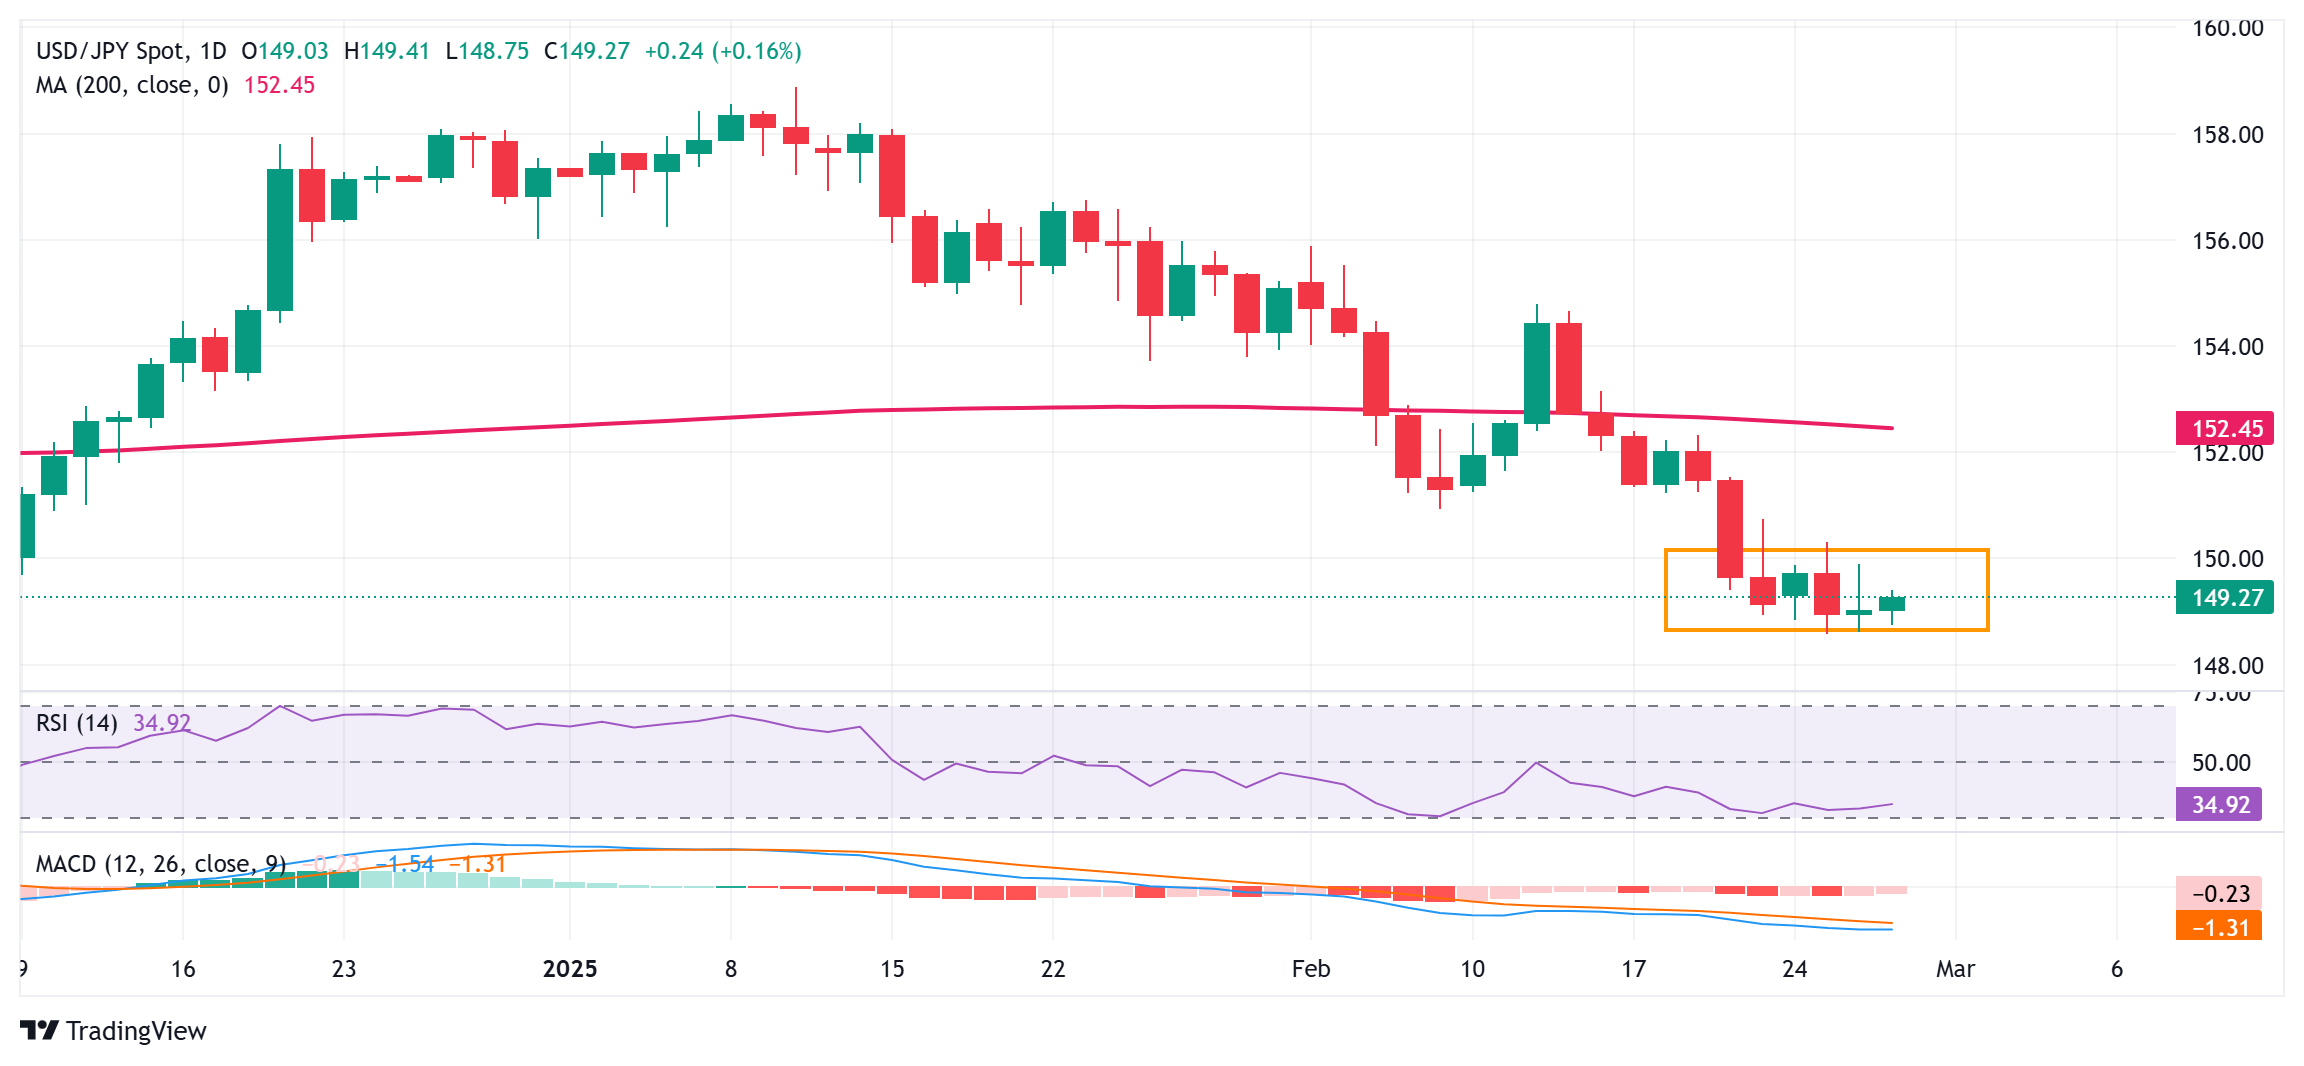
From a technical perspective, the USD/JPY pair has been oscillating in a familiar range since the beginning of this week. This comes on top of the recent downfall from the year-to-date high touched in January and might still be categorized as a bearish consolidation phase. Moreover, oscillators on the daily chart are holding deep in negative territory and are still away from being in the oversold zone, suggesting that the path of least resistance for spot prices remains to the downside.
Hence, any further move up could be seen as a selling opportunity near the 149.75-149.80 region and remain capped near the 150.00 psychological mark. A sustained strength beyond the latter, however, could trigger a short-covering rally and lift the USD/JPY pair further towards the 150.90-151.00 horizontal support breakpoint, now turned strong barrier.
On the flip side, the 149.00 round figure now seems to protect the immediate downside ahead of the 148.60 region, or the multi-month low. Some follow-through selling will be seen as a fresh trigger for bearish traders and drag the USD/JPY pair to the 148.00 mark en route to the next relevant support near the 147.35-147.30 area and the 147.00 round figure.
Japanese Yen FAQs
The Japanese Yen (JPY) is one of the world’s most traded currencies. Its value is broadly determined by the performance of the Japanese economy, but more specifically by the Bank of Japan’s policy, the differential between Japanese and US bond yields, or risk sentiment among traders, among other factors.
One of the Bank of Japan’s mandates is currency control, so its moves are key for the Yen. The BoJ has directly intervened in currency markets sometimes, generally to lower the value of the Yen, although it refrains from doing it often due to political concerns of its main trading partners. The BoJ ultra-loose monetary policy between 2013 and 2024 caused the Yen to depreciate against its main currency peers due to an increasing policy divergence between the Bank of Japan and other main central banks. More recently, the gradually unwinding of this ultra-loose policy has given some support to the Yen.
Over the last decade, the BoJ’s stance of sticking to ultra-loose monetary policy has led to a widening policy divergence with other central banks, particularly with the US Federal Reserve. This supported a widening of the differential between the 10-year US and Japanese bonds, which favored the US Dollar against the Japanese Yen. The BoJ decision in 2024 to gradually abandon the ultra-loose policy, coupled with interest-rate cuts in other major central banks, is narrowing this differential.
The Japanese Yen is often seen as a safe-haven investment. This means that in times of market stress, investors are more likely to put their money in the Japanese currency due to its supposed reliability and stability. Turbulent times are likely to strengthen the Yen’s value against other currencies seen as more risky to invest in.
-
03:06
US Commerce Secretary Howard Lutnick: April 2 is baseline reciprocal tariff data
US Commerce Secretary Howard Lutnick said late Wednesday that April 3 is baseline reciprocal tariff data. Lutnick further stated that he will not allow chinese vehicles in the US as China is his major worry.
Seperately, US Treasury Secretary Scott Bessent noted he is dedicated to working with Congress in making US President Donald Trump's tax cuts permanent.Market reaction
At the time of writing, the US Dollar Index (DXY) is trading 0.08% higher on the day to trade at 106.59.
Tariffs FAQs
Tariffs are customs duties levied on certain merchandise imports or a category of products. Tariffs are designed to help local producers and manufacturers be more competitive in the market by providing a price advantage over similar goods that can be imported. Tariffs are widely used as tools of protectionism, along with trade barriers and import quotas.
Although tariffs and taxes both generate government revenue to fund public goods and services, they have several distinctions. Tariffs are prepaid at the port of entry, while taxes are paid at the time of purchase. Taxes are imposed on individual taxpayers and businesses, while tariffs are paid by importers.
There are two schools of thought among economists regarding the usage of tariffs. While some argue that tariffs are necessary to protect domestic industries and address trade imbalances, others see them as a harmful tool that could potentially drive prices higher over the long term and lead to a damaging trade war by encouraging tit-for-tat tariffs.
During the run-up to the presidential election in November 2024, Donald Trump made it clear that he intends to use tariffs to support the US economy and American producers. In 2024, Mexico, China and Canada accounted for 42% of total US imports. In this period, Mexico stood out as the top exporter with $466.6 billion, according to the US Census Bureau. Hence, Trump wants to focus on these three nations when imposing tariffs. He also plans to use the revenue generated through tariffs to lower personal income taxes.
-
02:58
RBA’s Hauser: Tightness in Australia’s labor market is a challenge to inflation
Reserve Bank of Australia (RBA) Deputy Governor Andrew Hauser commented on the outlook on inflation and employment in his speech earlier on Thursday in the Asian session.
Key quotes
Expect further positive news on inflation.
Stresses need to see this good news first.
Tightness in Australia’s labour market is a challenge to inflation.
Market reaction
At the press time, AUD/USD is up 0.06% on the day, trading near 0.6300.
RBA FAQs
The Reserve Bank of Australia (RBA) sets interest rates and manages monetary policy for Australia. Decisions are made by a board of governors at 11 meetings a year and ad hoc emergency meetings as required. The RBA’s primary mandate is to maintain price stability, which means an inflation rate of 2-3%, but also “..to contribute to the stability of the currency, full employment, and the economic prosperity and welfare of the Australian people.” Its main tool for achieving this is by raising or lowering interest rates. Relatively high interest rates will strengthen the Australian Dollar (AUD) and vice versa. Other RBA tools include quantitative easing and tightening.
While inflation had always traditionally been thought of as a negative factor for currencies since it lowers the value of money in general, the opposite has actually been the case in modern times with the relaxation of cross-border capital controls. Moderately higher inflation now tends to lead central banks to put up their interest rates, which in turn has the effect of attracting more capital inflows from global investors seeking a lucrative place to keep their money. This increases demand for the local currency, which in the case of Australia is the Aussie Dollar.
Macroeconomic data gauges the health of an economy and can have an impact on the value of its currency. Investors prefer to invest their capital in economies that are safe and growing rather than precarious and shrinking. Greater capital inflows increase the aggregate demand and value of the domestic currency. Classic indicators, such as GDP, Manufacturing and Services PMIs, employment, and consumer sentiment surveys can influence AUD. A strong economy may encourage the Reserve Bank of Australia to put up interest rates, also supporting AUD.
Quantitative Easing (QE) is a tool used in extreme situations when lowering interest rates is not enough to restore the flow of credit in the economy. QE is the process by which the Reserve Bank of Australia (RBA) prints Australian Dollars (AUD) for the purpose of buying assets – usually government or corporate bonds – from financial institutions, thereby providing them with much-needed liquidity. QE usually results in a weaker AUD.
Quantitative tightening (QT) is the reverse of QE. It is undertaken after QE when an economic recovery is underway and inflation starts rising. Whilst in QE the Reserve Bank of Australia (RBA) purchases government and corporate bonds from financial institutions to provide them with liquidity, in QT the RBA stops buying more assets, and stops reinvesting the principal maturing on the bonds it already holds. It would be positive (or bullish) for the Australian Dollar.
-
02:43
Australian Dollar appreciates despite a disappointing Q4 Private Capital Expenditure
- The Australian Dollar holds gains after the release of a weaker-than-expected Private Capital Expenditure on Thursday.
- Australia’s Private Capital Expenditure unexpectedly contracted by 0.2% QoQ in Q4 2024, falling short of market expectations for 0.8% growth.
- The US Dollar continues to strengthen as traders evaluate the economy’s performance and the outlook on tariffs.
The Australian Dollar (AUD) holds gains against the US Dollar (USD) on Wednesday. The AUD/USD pair gains ground despite the release of disappointing Australia’s Private Capital Expenditure, which unexpectedly shrank by 0.2% quarter-on-quarter in the fourth quarter of 2024, missing market expectations of 0.8% growth and after an upwardly revised 1.6% expansion in the previous quarter.
Reserve Bank of Australia (RBA) Deputy Governor Andrew Hauser said he expects more positive news on inflation but emphasized the importance of seeing this progress materialize first. He noted that the tightness in Australia’s labor market remains a challenge for controlling inflation.
The AUD also faced challenges on Wednesday following Australia’s monthly Consumer Price Index (CPI), which rose by 2.5% year-over-year in January, compared to a 2.5% increase seen in December. The market forecast was for 2.6% growth in the reported period.
The AUD/USD pair faces challenges due to rising risk sentiment as US President Donald Trump said late Monday that sweeping US tariffs on imports from Canada and Mexico “will go forward” when a month-long delay on their implementation expires next week. Moreover, the Trump administration is aiming to tighten chip export controls on China, Australia’s close trading partner.
However, the downside of the AUD/USD pair could be limited as the People’s Bank of China (PBOC) injected CNY300 billion on Tuesday via the one-year Medium-term Lending Facility (MLF), maintaining the rate at 2%. Additionally, the PBOC injected CNY318.5 billion through seven-day reverse repos at 1.50%, consistent with the prior rate.
Australian Dollar could depreciate due to increased risk aversion
- The US Dollar Index (DXY), which measures the USD against six major currencies, gains ground as traders assess the strength of the economy and tariff outlook. The DXY extends its gains to near 106.50 at the time of writing.
- Federal Reserve Bank of Atlanta President Raphael Bostic said late Wednesday that the Fed should hold interest rates where they are, at a level that continues to put downward pressure on inflation, per Bloomberg.
- The White House said late Wednesday that US President Donald Trump issued an executive order aimed at implementing the Department of Government Efficiency's (DOGE) cost-cutting drive, per Reuters. The executive order requires agencies to justify spending, limit travel, and identify surplus federal properties that can be sold.
- President Trump signed a memorandum on Friday instructing the Committee on Foreign Investment in the United States (CFIUS) to limit Chinese investments in strategic sectors. Reuters cited a White House official saying that the national security memorandum seeks to encourage foreign investment while safeguarding US national security interests from potential threats posed by foreign adversaries like China.
- The Reserve Bank of Australia (RBA) lowered its Official Cash Rate (OCR) by 25 basis points to 4.10% last week—the first rate cut in four years. Reserve Bank of Australia (RBA) Governor Michele Bullock acknowledged the impact of high interest rates but cautioned that it was too soon to declare victory over inflation. She also emphasized the labor market's strength and clarified that future rate cuts are not guaranteed, despite market expectations.
Australian Dollar tests 0.6300 support as a bearish bias emerges
The AUD/USD pair hovers around 0.6300 on Thursday. Analysis of the daily chart indicates that the pair stays below the nine- and 14-day Exponential Moving Averages (EMAs), signaling weakening short-term price momentum. Moreover, the 14-day Relative Strength Index (RSI) remains below 50, reinforcing the prevailing bearish outlook.
The AUD/USD pair tests immediate support at the psychological level of 0.6300. A break below this threshold could push the pair toward the 0.6087 region, its lowest level since April 2020, recorded on February 3.
On the upside, the AUD/USD pair may face immediate resistance at the 14-day EMA of 0.6323, followed by the nine-day EMA at 0.6329. A decisive break above these levels could strengthen short-term price momentum, paving the way for the pair to challenge the two-month high of 0.6408, reached on February 21.
AUD/USD: Daily Chart
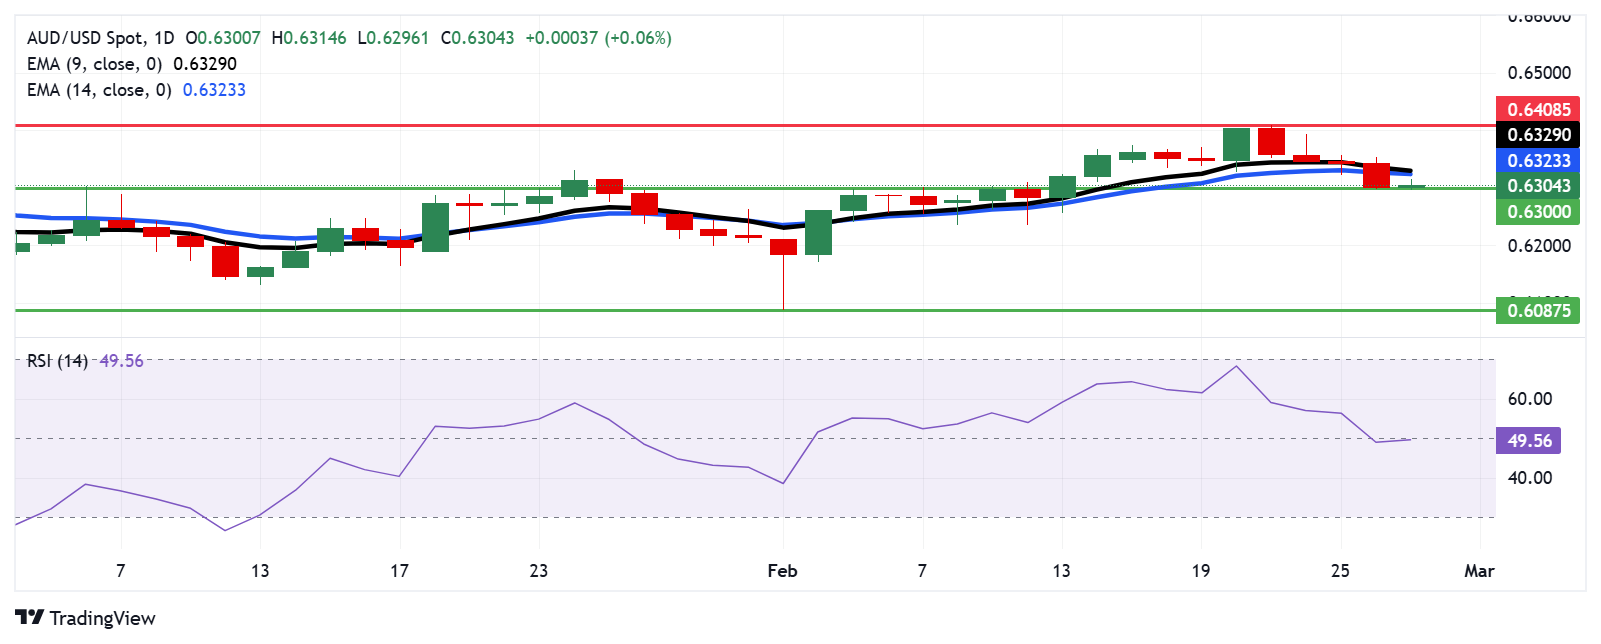
Australian Dollar PRICE Today
The table below shows the percentage change of Australian Dollar (AUD) against listed major currencies today. Australian Dollar was the strongest against the Swiss Franc.
USD EUR GBP JPY CAD AUD NZD CHF USD 0.05% 0.04% 0.07% 0.00% -0.15% -0.06% 0.10% EUR -0.05% -0.00% 0.03% -0.04% -0.19% -0.10% 0.05% GBP -0.04% 0.00% 0.06% -0.04% -0.19% -0.10% 0.05% JPY -0.07% -0.03% -0.06% -0.09% -0.24% -0.18% 0.00% CAD -0.00% 0.04% 0.04% 0.09% -0.14% -0.06% 0.09% AUD 0.15% 0.19% 0.19% 0.24% 0.14% 0.09% 0.24% NZD 0.06% 0.10% 0.10% 0.18% 0.06% -0.09% 0.16% CHF -0.10% -0.05% -0.05% -0.00% -0.09% -0.24% -0.16% The heat map shows percentage changes of major currencies against each other. The base currency is picked from the left column, while the quote currency is picked from the top row. For example, if you pick the Australian Dollar from the left column and move along the horizontal line to the US Dollar, the percentage change displayed in the box will represent AUD (base)/USD (quote).
Economic Indicator
Private Capital Expenditure
The Private Capital Expenditure released by the Australian Bureau of Statistics measures current and future capital expenditure intentions of the private sector. It is considered as an indicator for inflationary pressures. A high reading is seen as positive (or bullish) for the AUD, while a low reading is seen as negative (or bearish).
Read more.Last release: Thu Feb 27, 2025 00:30
Frequency: Quarterly
Actual: -0.2%
Consensus: 0.8%
Previous: 1.1%
Source: Australian Bureau of Statistics
-
02:22
NZD/USD remains on the defensive below 0.5700 as traders await US GDP release
- NZD/USD softens to near 0.5695 in Thursday’s early Asian session.
- Fresh US tariff threats could undermine the China-proxy Kiwi.
- The preliminary reading of the US Q4 GDP report will be in the spotlight later on Thursday.
The NZD/USD pair remains on the defensive around 0.5695 during the early Asian session on Thursday. The tariff uncertainty from US President Donald Trump weighs on the New Zealand Dollar (NZD). Investors brace for the preliminary reading of Gross Domestic Product (GDP) for the fourth quarter (Q4), which is due later on Thursday.
Trump has already raised tariffs on Chinese goods and has threatened to impose sweeping trade actions, including a 25% border tax on goods from Canada and Mexico, as well as new "reciprocal" tariffs for each country. Trump has also ordered an investigation into copper imports, which could lead to potential tariffs on the metal. Any signs of renewed US tariff threats could drag the China-proxy Kiwi lower as China is a major trading partner to New Zealand.
Furthermore, the expectation of further rate cuts from the Reserve Bank of New Zealand (RBNZ) might contribute to the NZD’s downside. "Our base case is the RBNZ will cut by 25bp at each of the following two meetings, in April and May," said ASB chief economist Nick Tuffley.
On the other hand, the weakening of the US Dollar (USD) due to the slow of softer US economic data might help limit the pair’s losses. US consumer confidence fell the most since August 2021, declining to 98.3 in February versus 105.3 prior, according to the Conference Board. Traders will take more cues from the Fedspeak later on Thursday. The Federal Reserve’s (Fed) Michelle Bowman, Beth Hammack and Patrick Harker are set to speak. These remarks might offer some hints about the US interest rate path this year.New Zealand Dollar FAQs
The New Zealand Dollar (NZD), also known as the Kiwi, is a well-known traded currency among investors. Its value is broadly determined by the health of the New Zealand economy and the country’s central bank policy. Still, there are some unique particularities that also can make NZD move. The performance of the Chinese economy tends to move the Kiwi because China is New Zealand’s biggest trading partner. Bad news for the Chinese economy likely means less New Zealand exports to the country, hitting the economy and thus its currency. Another factor moving NZD is dairy prices as the dairy industry is New Zealand’s main export. High dairy prices boost export income, contributing positively to the economy and thus to the NZD.
The Reserve Bank of New Zealand (RBNZ) aims to achieve and maintain an inflation rate between 1% and 3% over the medium term, with a focus to keep it near the 2% mid-point. To this end, the bank sets an appropriate level of interest rates. When inflation is too high, the RBNZ will increase interest rates to cool the economy, but the move will also make bond yields higher, increasing investors’ appeal to invest in the country and thus boosting NZD. On the contrary, lower interest rates tend to weaken NZD. The so-called rate differential, or how rates in New Zealand are or are expected to be compared to the ones set by the US Federal Reserve, can also play a key role in moving the NZD/USD pair.
Macroeconomic data releases in New Zealand are key to assess the state of the economy and can impact the New Zealand Dollar’s (NZD) valuation. A strong economy, based on high economic growth, low unemployment and high confidence is good for NZD. High economic growth attracts foreign investment and may encourage the Reserve Bank of New Zealand to increase interest rates, if this economic strength comes together with elevated inflation. Conversely, if economic data is weak, NZD is likely to depreciate.
The New Zealand Dollar (NZD) tends to strengthen during risk-on periods, or when investors perceive that broader market risks are low and are optimistic about growth. This tends to lead to a more favorable outlook for commodities and so-called ‘commodity currencies’ such as the Kiwi. Conversely, NZD tends to weaken at times of market turbulence or economic uncertainty as investors tend to sell higher-risk assets and flee to the more-stable safe havens.
-
02:15
PBOC sets USD/CNY reference rate at 7.1740 vs. 7.1732 previous
On Thursday, the People’s Bank of China (PBOC) set the USD/CNY central rate for the trading session ahead at 7.1740 as compared to the previous day's fix of 7.1732 and 7.2561 Reuters estimates.
PBOC FAQs
The primary monetary policy objectives of the People's Bank of China (PBoC) are to safeguard price stability, including exchange rate stability, and promote economic growth. China’s central bank also aims to implement financial reforms, such as opening and developing the financial market.
The PBoC is owned by the state of the People's Republic of China (PRC), so it is not considered an autonomous institution. The Chinese Communist Party (CCP) Committee Secretary, nominated by the Chairman of the State Council, has a key influence on the PBoC’s management and direction, not the governor. However, Mr. Pan Gongsheng currently holds both of these posts.
Unlike the Western economies, the PBoC uses a broader set of monetary policy instruments to achieve its objectives. The primary tools include a seven-day Reverse Repo Rate (RRR), Medium-term Lending Facility (MLF), foreign exchange interventions and Reserve Requirement Ratio (RRR). However, The Loan Prime Rate (LPR) is China’s benchmark interest rate. Changes to the LPR directly influence the rates that need to be paid in the market for loans and mortgages and the interest paid on savings. By changing the LPR, China’s central bank can also influence the exchange rates of the Chinese Renminbi.
Yes, China has 19 private banks – a small fraction of the financial system. The largest private banks are digital lenders WeBank and MYbank, which are backed by tech giants Tencent and Ant Group, per The Straits Times. In 2014, China allowed domestic lenders fully capitalized by private funds to operate in the state-dominated financial sector.
-
01:36
Gold Price Forecast: XAU/USD holds positive ground above $2,900 amid renewed US tariff threats
- Gold price posts modest gains to near $2,920 in Thursday’s early Asian session.
- Uncertainty and safe haven buying provide some support to Gold.
- A hawkish Fed might cap the upside for the Gold price.
Gold price (XAU/USD) trades with mild gains around $2,920 during the early Asian session on Thursday. Trade tensions and economic uncertainty continue to drive demand for safe-haven assets like Gold.
Late Wednesday, US President Donald Trump reiterated his insistence on 25% tariffs on Canada and Mexico, as well as adding the European Union (EU) to the mixed list of countries from which he will penalize US consumers for importing. Trump added that tariffs on Canada and Mexico will go into effect on April 2.
Market players will closely watch the developments surrounding further Trump’s tariff policies. The tariff uncertainty could boost the safe-haven flows, benefiting the precious metal.
On the other hand, Trump’s plans for higher tariffs have raised inflation worries at the US Federal Reserve (Fed), which might convince the US central bank to keep interest rates higher for longer. This, in turn, might cap the upside for the precious metal as higher interest rates tarnish non-yielding gold's appeal.
Additionally, analysts suggest that the pullback is part of a normal profit-taking cycle, with long-term bullish remains in place. “We continue to see an overall upward trend,” said David Meger, director of metals trading at High Ridge Futures. “This appears to be routine profit-booking rather than a shift in sentiment,” Meger added.Gold FAQs
Gold has played a key role in human’s history as it has been widely used as a store of value and medium of exchange. Currently, apart from its shine and usage for jewelry, the precious metal is widely seen as a safe-haven asset, meaning that it is considered a good investment during turbulent times. Gold is also widely seen as a hedge against inflation and against depreciating currencies as it doesn’t rely on any specific issuer or government.
Central banks are the biggest Gold holders. In their aim to support their currencies in turbulent times, central banks tend to diversify their reserves and buy Gold to improve the perceived strength of the economy and the currency. High Gold reserves can be a source of trust for a country’s solvency. Central banks added 1,136 tonnes of Gold worth around $70 billion to their reserves in 2022, according to data from the World Gold Council. This is the highest yearly purchase since records began. Central banks from emerging economies such as China, India and Turkey are quickly increasing their Gold reserves.
Gold has an inverse correlation with the US Dollar and US Treasuries, which are both major reserve and safe-haven assets. When the Dollar depreciates, Gold tends to rise, enabling investors and central banks to diversify their assets in turbulent times. Gold is also inversely correlated with risk assets. A rally in the stock market tends to weaken Gold price, while sell-offs in riskier markets tend to favor the precious metal.
The price can move due to a wide range of factors. Geopolitical instability or fears of a deep recession can quickly make Gold price escalate due to its safe-haven status. As a yield-less asset, Gold tends to rise with lower interest rates, while higher cost of money usually weighs down on the yellow metal. Still, most moves depend on how the US Dollar (USD) behaves as the asset is priced in dollars (XAU/USD). A strong Dollar tends to keep the price of Gold controlled, whereas a weaker Dollar is likely to push Gold prices up.
-
01:30
Australia Private Capital Expenditure registered at -0.2%, below expectations (0.8%) in 4Q
-
01:30
Australia Private Capital Expenditure registered at -0.2%, below expectations (0.8%) in 4Q
-
01:15
Currencies. Daily history for Wednesday, February 26, 2025
Pare Closed Change, % AUDUSD 0.63034 -0.6 EURJPY 156.322 -0.16 EURUSD 1.04824 -0.29 GBPJPY 189.008 0.21 GBPUSD 1.26745 0.09 NZDUSD 0.56937 -0.49 USDCAD 1.43399 0.2 USDCHF 0.89472 0.25 USDJPY 149.114 0.11 -
01:04
EUR/USD pulls back as tariff threats weigh
- EUR/USD shed 0.25% on Wednesday after new tariff threats hit newswires.
- US President Trump insists 25% tariffs are coming for the EU.
- Key US inflation figures are set to close out the week.
EUR/USD pulled back on Wednesday, shedding around one-quarter of one percent after US President Donald Trump insisted that tariffs are coming for the European Union too, not just Canada and Mexico.
Always eager to capitalize on opportunities, President Trump introduced new tariff threats on Wednesday, extending proposed import taxes to include a 25% tariff on European goods. While details are still vague, he outlined his intention to impose further tariffs on European products, specifically mentioning “cars and other items." He reiterated that the US does not “need” Canadian crude oil or lumber, stating that there will be tariff packages of 25% on both Canada and Mexico. Nevertheless, he again delayed the implementation, revealing that the confirmed tariffs on Canada and Mexico will take effect on April 2nd.
Forex Today: Markets’ attention remains on US economy and tariffs
The group of nations not facing tariff threats from the White House is rapidly diminishing. Should a full-scale trade war unfold, the Euro has now been added to the list of vulnerable currencies that may experience increased volatility due to shifting risk sentiment, as investors struggle to keep pace with the frequent updates emanating from the White House.
This week, UK data is relatively sparse, but a wealth of US data is available for investors to analyze as the trading week progresses. On Thursday, US Gross Domestic Product (GDP) growth figures for the fourth quarter of 2024 will be released, along with updates on Durable Goods orders for January.
The most significant data point this week will be the US Personal Consumption Expenditure (PCE) inflation report set for Friday. Inflation indicators in the US spiked at the beginning of 2025, and investors are looking for evidence that any immediate inflationary pressures do not seep into core inflation metrics.
EUR/USD continues to churn on the high side, but top-end momentum remains tepid. The pair is holding north of the 50-day Exponential Moving Average (EMA) at 1.0450, but a hard barrier is priced in from the 1.0550 level.
EUR/USD daily chart
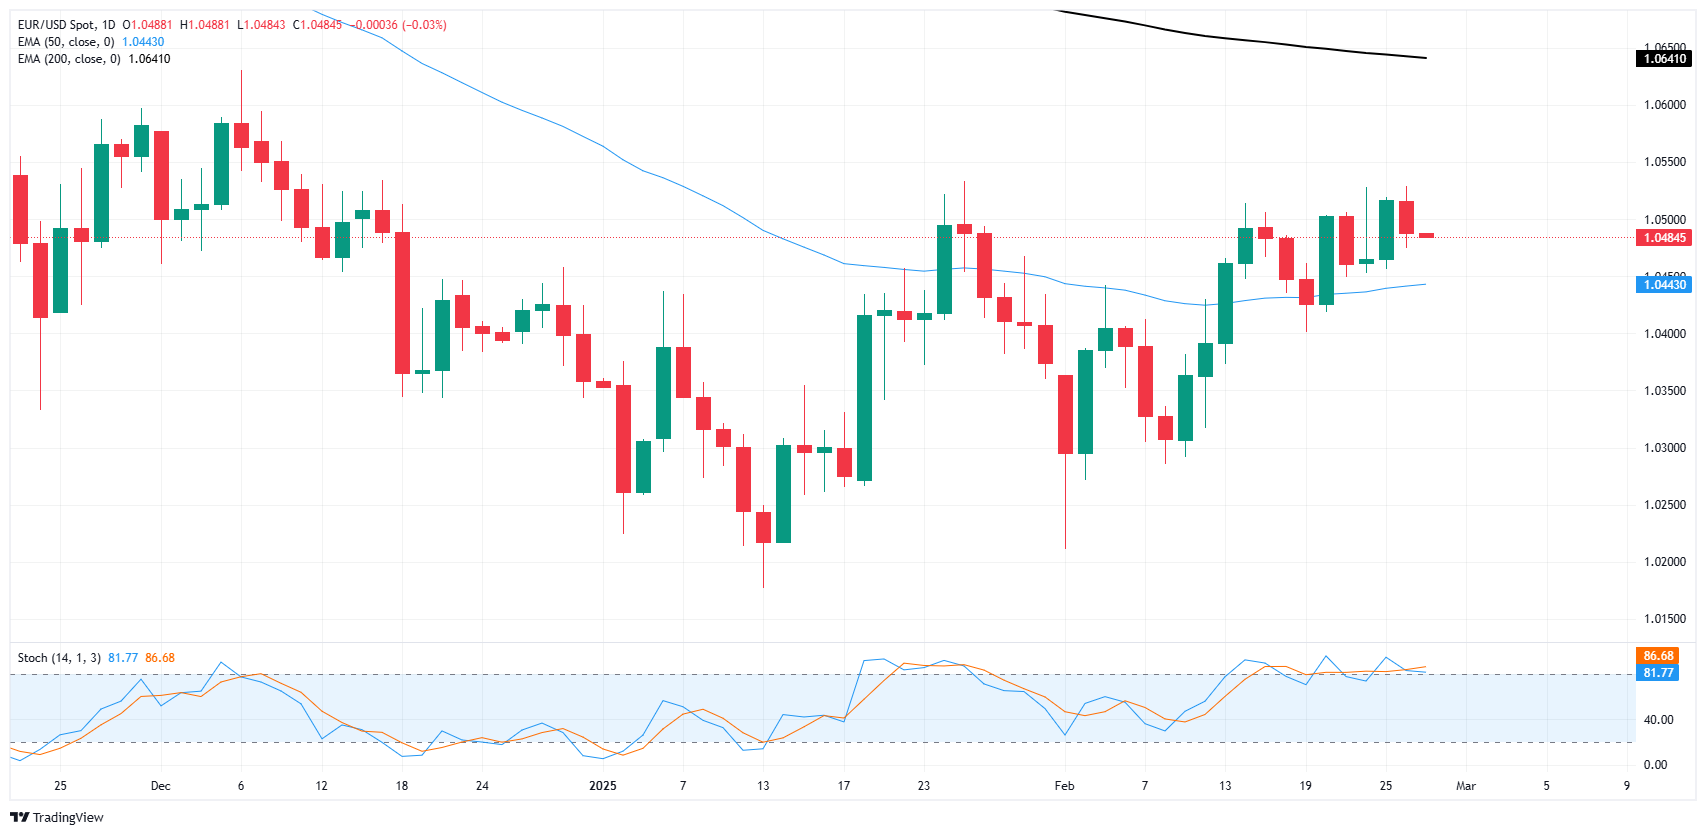
Euro FAQs
The Euro is the currency for the 19 European Union countries that belong to the Eurozone. It is the second most heavily traded currency in the world behind the US Dollar. In 2022, it accounted for 31% of all foreign exchange transactions, with an average daily turnover of over $2.2 trillion a day. EUR/USD is the most heavily traded currency pair in the world, accounting for an estimated 30% off all transactions, followed by EUR/JPY (4%), EUR/GBP (3%) and EUR/AUD (2%).
The European Central Bank (ECB) in Frankfurt, Germany, is the reserve bank for the Eurozone. The ECB sets interest rates and manages monetary policy. The ECB’s primary mandate is to maintain price stability, which means either controlling inflation or stimulating growth. Its primary tool is the raising or lowering of interest rates. Relatively high interest rates – or the expectation of higher rates – will usually benefit the Euro and vice versa. The ECB Governing Council makes monetary policy decisions at meetings held eight times a year. Decisions are made by heads of the Eurozone national banks and six permanent members, including the President of the ECB, Christine Lagarde.
Eurozone inflation data, measured by the Harmonized Index of Consumer Prices (HICP), is an important econometric for the Euro. If inflation rises more than expected, especially if above the ECB’s 2% target, it obliges the ECB to raise interest rates to bring it back under control. Relatively high interest rates compared to its counterparts will usually benefit the Euro, as it makes the region more attractive as a place for global investors to park their money.
Data releases gauge the health of the economy and can impact on the Euro. Indicators such as GDP, Manufacturing and Services PMIs, employment, and consumer sentiment surveys can all influence the direction of the single currency. A strong economy is good for the Euro. Not only does it attract more foreign investment but it may encourage the ECB to put up interest rates, which will directly strengthen the Euro. Otherwise, if economic data is weak, the Euro is likely to fall. Economic data for the four largest economies in the euro area (Germany, France, Italy and Spain) are especially significant, as they account for 75% of the Eurozone’s economy.
Another significant data release for the Euro is the Trade Balance. This indicator measures the difference between what a country earns from its exports and what it spends on imports over a given period. If a country produces highly sought after exports then its currency will gain in value purely from the extra demand created from foreign buyers seeking to purchase these goods. Therefore, a positive net Trade Balance strengthens a currency and vice versa for a negative balance.
-
01:01
Ireland Consumer Confidence down to 74.8 in February from previous 74.9
-
00:49
Fed's Bostic: Rates need to remain in restrictive territory
Federal Reserve Bank of Atlanta President Raphael Bostic said late Wednesday that the Fed should hold interest rates where they are, at a level that continues to put downward pressure on inflation, per Bloomberg.
Key quotes
We need to stay where we are.
You can say that we’re hitting our employment mandate, and now we have to get the price stability mandate under control.
We need to be in a restrictive posture.
Inflation is high but they have seen a lot of progress.
Outlook is for inflation to continue on the path to 2%.
Need to see more data to see if January inflation was a bump or a trend.
Fed policy is restrictive and needs to stay restrictive.Market reaction
At the time of writing, the US Dollar Index (DXY) is trading 0.07% lower on the day to trade at 106.42.
Fed FAQs
Monetary policy in the US is shaped by the Federal Reserve (Fed). The Fed has two mandates: to achieve price stability and foster full employment. Its primary tool to achieve these goals is by adjusting interest rates. When prices are rising too quickly and inflation is above the Fed’s 2% target, it raises interest rates, increasing borrowing costs throughout the economy. This results in a stronger US Dollar (USD) as it makes the US a more attractive place for international investors to park their money. When inflation falls below 2% or the Unemployment Rate is too high, the Fed may lower interest rates to encourage borrowing, which weighs on the Greenback.
The Federal Reserve (Fed) holds eight policy meetings a year, where the Federal Open Market Committee (FOMC) assesses economic conditions and makes monetary policy decisions. The FOMC is attended by twelve Fed officials – the seven members of the Board of Governors, the president of the Federal Reserve Bank of New York, and four of the remaining eleven regional Reserve Bank presidents, who serve one-year terms on a rotating basis.
In extreme situations, the Federal Reserve may resort to a policy named Quantitative Easing (QE). QE is the process by which the Fed substantially increases the flow of credit in a stuck financial system. It is a non-standard policy measure used during crises or when inflation is extremely low. It was the Fed’s weapon of choice during the Great Financial Crisis in 2008. It involves the Fed printing more Dollars and using them to buy high grade bonds from financial institutions. QE usually weakens the US Dollar.
Quantitative tightening (QT) is the reverse process of QE, whereby the Federal Reserve stops buying bonds from financial institutions and does not reinvest the principal from the bonds it holds maturing, to purchase new bonds. It is usually positive for the value of the US Dollar.
-
00:36
US President Donald Trump issues order on DOGE cost-cutting efforts
The White House said late Wednesday that US President Donald Trump issued an executive order aimed at implementing the Department of Government Efficiency's (DOGE) cost-cutting drive, per Reuters.
The executive order requires agencies to justify spending, limit travel, and identify surplus federal properties that can be sold. It comes as the administration signals deeper cuts, warning federal agencies to prepare for enormous layoffs in the months ahead.Market reaction
At the time of writing, the US Dollar Index (DXY) is trading 0.06% lower on the day to trade at 106.44.
US Dollar FAQs
The US Dollar (USD) is the official currency of the United States of America, and the ‘de facto’ currency of a significant number of other countries where it is found in circulation alongside local notes. It is the most heavily traded currency in the world, accounting for over 88% of all global foreign exchange turnover, or an average of $6.6 trillion in transactions per day, according to data from 2022. Following the second world war, the USD took over from the British Pound as the world’s reserve currency. For most of its history, the US Dollar was backed by Gold, until the Bretton Woods Agreement in 1971 when the Gold Standard went away.
The most important single factor impacting on the value of the US Dollar is monetary policy, which is shaped by the Federal Reserve (Fed). The Fed has two mandates: to achieve price stability (control inflation) and foster full employment. Its primary tool to achieve these two goals is by adjusting interest rates. When prices are rising too quickly and inflation is above the Fed’s 2% target, the Fed will raise rates, which helps the USD value. When inflation falls below 2% or the Unemployment Rate is too high, the Fed may lower interest rates, which weighs on the Greenback.
In extreme situations, the Federal Reserve can also print more Dollars and enact quantitative easing (QE). QE is the process by which the Fed substantially increases the flow of credit in a stuck financial system. It is a non-standard policy measure used when credit has dried up because banks will not lend to each other (out of the fear of counterparty default). It is a last resort when simply lowering interest rates is unlikely to achieve the necessary result. It was the Fed’s weapon of choice to combat the credit crunch that occurred during the Great Financial Crisis in 2008. It involves the Fed printing more Dollars and using them to buy US government bonds predominantly from financial institutions. QE usually leads to a weaker US Dollar.
Quantitative tightening (QT) is the reverse process whereby the Federal Reserve stops buying bonds from financial institutions and does not reinvest the principal from the bonds it holds maturing in new purchases. It is usually positive for the US Dollar.
-
00:15
USD/CAD extends upside to near 1.4350 ahead of US GDP release
- USD/CAD gains traction to around 1.4340 in Wednesday’s late American session.
- Lower crude prices and renewed US tariff threats exert some selling pressure on the Canadian Dollar.
- Fed officials need a clear signal before deciding on the next moves.
The USD/CAD pair extends the rally to near 1.4340 during the late American session on Wednesday. A decline in crude oil prices continues to weigh on the commodity-linked Canadian Dollar (CAD). The US weekly Initial Jobless Claims are due later on Thursday, along with the estimate of Q4 Gross Domestic Product (GDP) for the fourth quarter (Q4).
Crude oil prices fall to a two-month low amid raising supply concerns as prospects for a peace deal between Russia and Ukraine are improving. This, in turn, undermines the commodity-linked Loonie as Canada is the largest oil exporter to the United States (US), and lower crude oil prices tend to have a negative impact on the CAD value.
Furthermore, the renewed US tariff threats weigh on the CAD and act as a tailwind for USD/CAD. US President Donald Trump confirmed plans to impose 25% tariffs on Canadian goods and 10% on Canadian energy exports by April 2, reversing earlier delays tied to Canada’s border security measures. "It's another month, which is obviously good news for Canada, but the tariff uncertainty is a real drag on the Canadian economy," said Adam Button, chief currency analyst at ForexLive.
The US Dollar (USD) rebounds from 11-week lows as traders assess the strength of the economy and tariff outlook. Richmond Federal Reserve (Fed) President Tom Barkin said on Tuesday that he will follow a wait-and-see approach regarding Fed interest rate policy until it is clear inflation is returning to the central bank's 2% goal given the current uncertainty surrounding the economy.
The Fed officials are scheduled to speak later in the day, including Michelle Bowman, Beth Hammack and Patrick Harker. The hawkish comment from policymakers could lift the USD against the Canadian Dollar (CAD) in the near term.Canadian Dollar FAQs
The key factors driving the Canadian Dollar (CAD) are the level of interest rates set by the Bank of Canada (BoC), the price of Oil, Canada’s largest export, the health of its economy, inflation and the Trade Balance, which is the difference between the value of Canada’s exports versus its imports. Other factors include market sentiment – whether investors are taking on more risky assets (risk-on) or seeking safe-havens (risk-off) – with risk-on being CAD-positive. As its largest trading partner, the health of the US economy is also a key factor influencing the Canadian Dollar.
The Bank of Canada (BoC) has a significant influence on the Canadian Dollar by setting the level of interest rates that banks can lend to one another. This influences the level of interest rates for everyone. The main goal of the BoC is to maintain inflation at 1-3% by adjusting interest rates up or down. Relatively higher interest rates tend to be positive for the CAD. The Bank of Canada can also use quantitative easing and tightening to influence credit conditions, with the former CAD-negative and the latter CAD-positive.
The price of Oil is a key factor impacting the value of the Canadian Dollar. Petroleum is Canada’s biggest export, so Oil price tends to have an immediate impact on the CAD value. Generally, if Oil price rises CAD also goes up, as aggregate demand for the currency increases. The opposite is the case if the price of Oil falls. Higher Oil prices also tend to result in a greater likelihood of a positive Trade Balance, which is also supportive of the CAD.
While inflation had always traditionally been thought of as a negative factor for a currency since it lowers the value of money, the opposite has actually been the case in modern times with the relaxation of cross-border capital controls. Higher inflation tends to lead central banks to put up interest rates which attracts more capital inflows from global investors seeking a lucrative place to keep their money. This increases demand for the local currency, which in Canada’s case is the Canadian Dollar.
Macroeconomic data releases gauge the health of the economy and can have an impact on the Canadian Dollar. Indicators such as GDP, Manufacturing and Services PMIs, employment, and consumer sentiment surveys can all influence the direction of the CAD. A strong economy is good for the Canadian Dollar. Not only does it attract more foreign investment but it may encourage the Bank of Canada to put up interest rates, leading to a stronger currency. If economic data is weak, however, the CAD is likely to fall.
-
00:14
GBP/USD runs out of bullish gas at key technical levels
- GBP/USD briefly rose to a fresh 10-week high before receding.
- Market sentiment improved enough to bolster the Cable despite light data.
- Tariff threats have resumed from President Trump and now include Europe.
GBP/USD briefly tested a fresh 10-week high on Wednesday, piercing 1.2700 for the first time since mid-December. However, souring risk sentiment took hold during the US market session, dragging Cable back down into near-term consolidation and keeping the pair chained south of the 200-day Exponential Moving Average (EMA).
Always ready to seize an opportunity, President Trump issued fresh tariff threats on Wednesday, expanding his proposed import taxes to encompass a 25% tariff on European products. While specifics remain unclear, he revealed his plan to implement additional tariffs on European items, mentioning “cars and other things.” He also reiterated his stance that the US does not “need” Canadian crude oil or lumber, confirming that tariff packages of 25% on both Canada and Mexico are forthcoming. However, he once again postponed the timeline by announcing that the confirmed tariffs on Canada and Mexico will now be effective starting April 2nd.
Forex Today: Markets’ attention remains on US economy and tariffs
While the UK looks set to continue avoiding President Trump’s vengeful gaze, the circle of countries that the White House isn’t targeting with tariff threats is shrinking rapidly. If a full-blown trade war starts, the Pound Sterling could still see knock-on effects from global price increases.
UK data is notably limited this week, but there is plenty of US data for investors to chew on heading into the back half of the trading week. US Gross Domestic Product (GDP) growth figures for the fourth quarter of 2024 are due on Thursday, as well as an update to Durable Goods orders for January.
The key data print this week will be US Personal Consumption Expenditure (PCE) inflation due on Friday. US inflation metrics kicked higher at the start of 2025, and investors will be hoping for signs that a near-term flare up in inflation pressures will avoid trickling down to core inflation metrics.
GBP/USD price forecast
GBP/USD failed to chalk in a solid gain on Wednesday, pulling back from a new 10-week high and slumping back below the 200-day EMA at 1.2680. Bullish momentum has pinned Cable into the high end, but a near-term consolidation pattern is still baking into the technical chart. Technical oscillators have spent a worrying amount of time flashing overbought conditrions, and GBP/USD could be primed for a moderate pullback back below the 50-day EMA at 1.2532.
GBP/USD daily chart
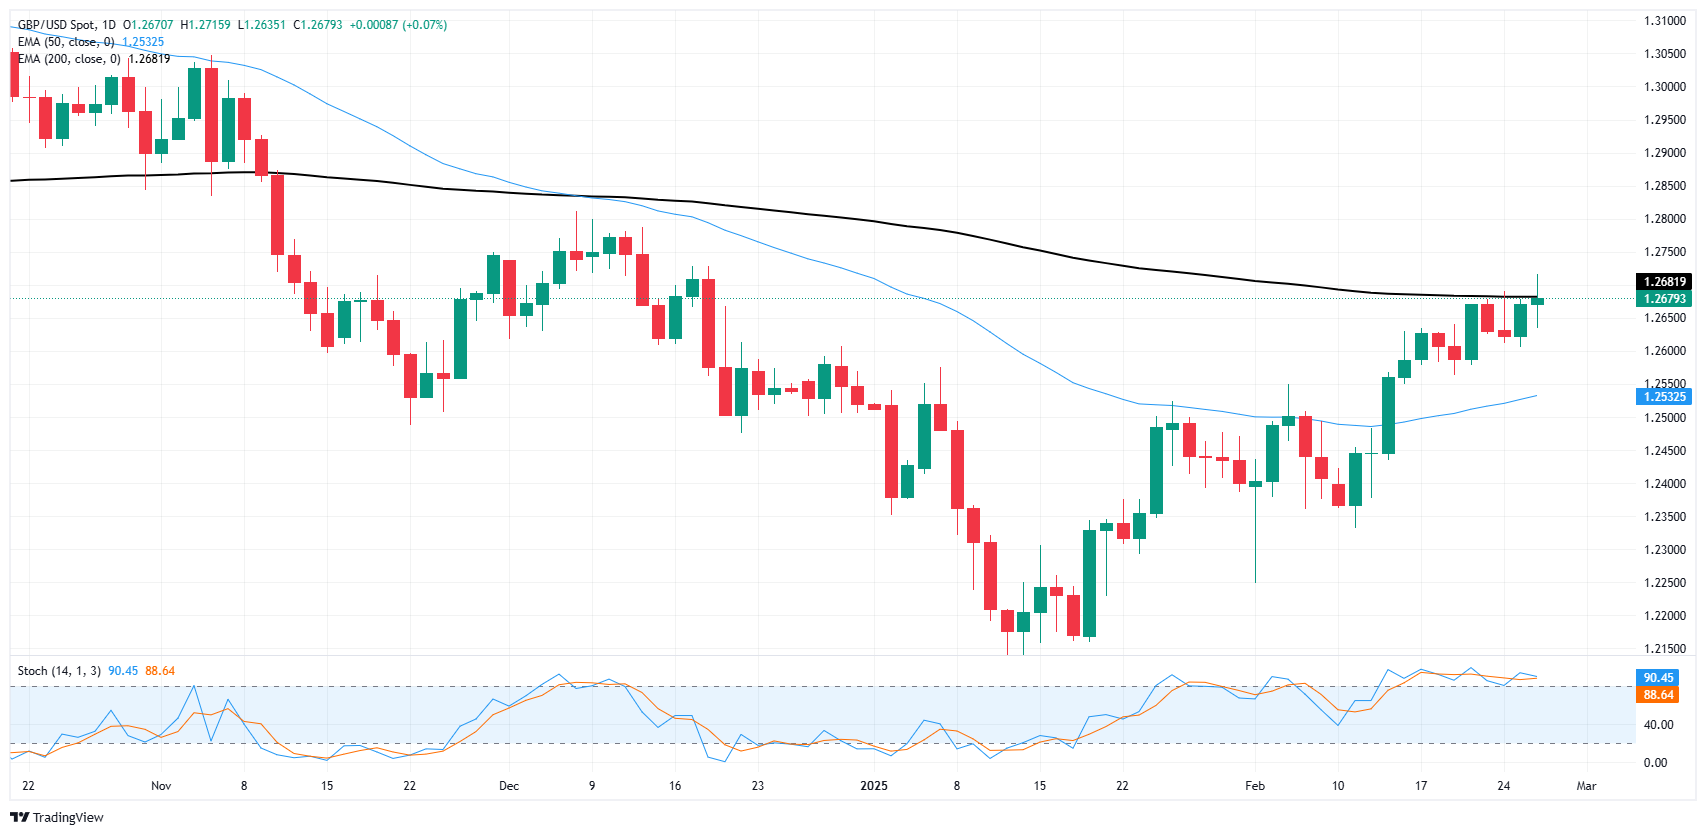
Pound Sterling FAQs
The Pound Sterling (GBP) is the oldest currency in the world (886 AD) and the official currency of the United Kingdom. It is the fourth most traded unit for foreign exchange (FX) in the world, accounting for 12% of all transactions, averaging $630 billion a day, according to 2022 data. Its key trading pairs are GBP/USD, also known as ‘Cable’, which accounts for 11% of FX, GBP/JPY, or the ‘Dragon’ as it is known by traders (3%), and EUR/GBP (2%). The Pound Sterling is issued by the Bank of England (BoE).
The single most important factor influencing the value of the Pound Sterling is monetary policy decided by the Bank of England. The BoE bases its decisions on whether it has achieved its primary goal of “price stability” – a steady inflation rate of around 2%. Its primary tool for achieving this is the adjustment of interest rates. When inflation is too high, the BoE will try to rein it in by raising interest rates, making it more expensive for people and businesses to access credit. This is generally positive for GBP, as higher interest rates make the UK a more attractive place for global investors to park their money. When inflation falls too low it is a sign economic growth is slowing. In this scenario, the BoE will consider lowering interest rates to cheapen credit so businesses will borrow more to invest in growth-generating projects.
Data releases gauge the health of the economy and can impact the value of the Pound Sterling. Indicators such as GDP, Manufacturing and Services PMIs, and employment can all influence the direction of the GBP. A strong economy is good for Sterling. Not only does it attract more foreign investment but it may encourage the BoE to put up interest rates, which will directly strengthen GBP. Otherwise, if economic data is weak, the Pound Sterling is likely to fall.
Another significant data release for the Pound Sterling is the Trade Balance. This indicator measures the difference between what a country earns from its exports and what it spends on imports over a given period. If a country produces highly sought-after exports, its currency will benefit purely from the extra demand created from foreign buyers seeking to purchase these goods. Therefore, a positive net Trade Balance strengthens a currency and vice versa for a negative balance.
-