Noticias del mercado
-
23:28
USD/JPY Price Forecast: Rallies and reclaims 150.00, bulls eye key resistance
- USD/JPY needs to clear 150.93 to invalidate the broader downtrend.
- Key resistance at 151.00 and Senkou Span A at 151.50.
- Failure to hold 150.00 could push the pair toward 148.57 support.
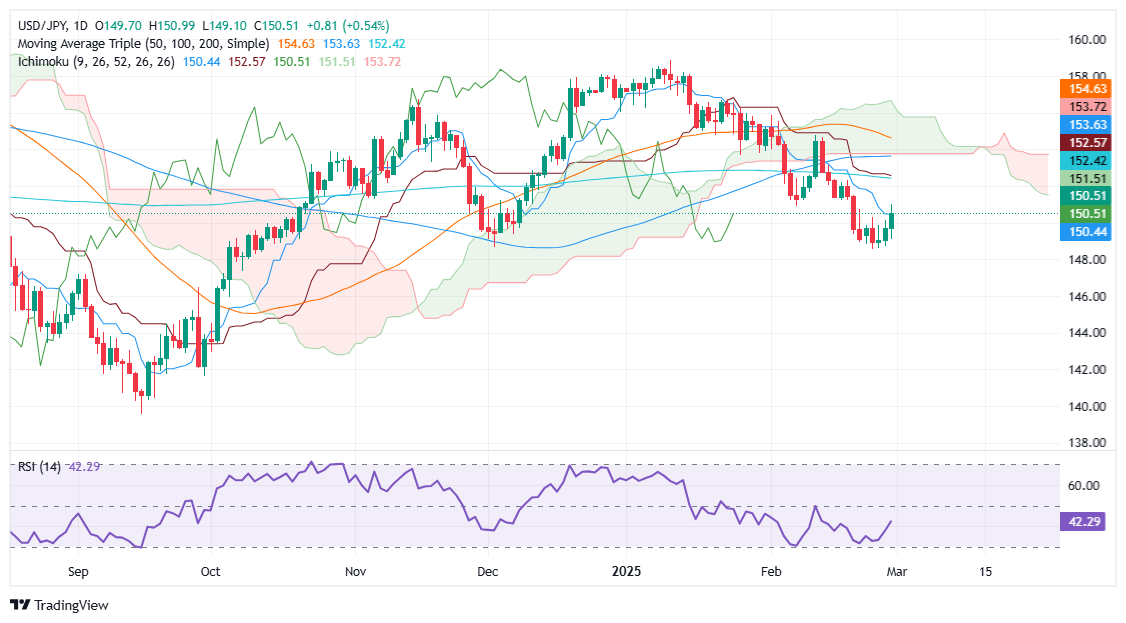
The USD/JPY rallied for the third straight day after bottoming near 148.60 on Tuesday. It gained over 0.54% and traded back above the 150.00 handle. At the time of writing, the pair is trading at 150.59.
USD/JPY Price Forecast: Technical outlook
The USD/JPY pair's downtrend will remain in place unless buyers reclaim 150.93, the February 7 daily low that turned resistance. The Tenkan-sen at 150.44 was already reclaimed, but key resistance levels reaffirm the USD/JPY bearish scenario.
Bulls must reclaim 151.00 ahead of challenging the Senkou Span A at 151.50. On further strength, up next lies the 200-day Simple Moving Average at 152.43
Conversely, if USD/JPY drops below 150.00, the next support would be the February 25 daily low of 148.57. Once hurdled, the next support would be the December 2024 swing low of 148.64.
USD/JPY Price Chart – Daily
Japanese Yen FAQs
The Japanese Yen (JPY) is one of the world’s most traded currencies. Its value is broadly determined by the performance of the Japanese economy, but more specifically by the Bank of Japan’s policy, the differential between Japanese and US bond yields, or risk sentiment among traders, among other factors.
One of the Bank of Japan’s mandates is currency control, so its moves are key for the Yen. The BoJ has directly intervened in currency markets sometimes, generally to lower the value of the Yen, although it refrains from doing it often due to political concerns of its main trading partners. The BoJ ultra-loose monetary policy between 2013 and 2024 caused the Yen to depreciate against its main currency peers due to an increasing policy divergence between the Bank of Japan and other main central banks. More recently, the gradually unwinding of this ultra-loose policy has given some support to the Yen.
Over the last decade, the BoJ’s stance of sticking to ultra-loose monetary policy has led to a widening policy divergence with other central banks, particularly with the US Federal Reserve. This supported a widening of the differential between the 10-year US and Japanese bonds, which favored the US Dollar against the Japanese Yen. The BoJ decision in 2024 to gradually abandon the ultra-loose policy, coupled with interest-rate cuts in other major central banks, is narrowing this differential.
The Japanese Yen is often seen as a safe-haven investment. This means that in times of market stress, investors are more likely to put their money in the Japanese currency due to its supposed reliability and stability. Turbulent times are likely to strengthen the Yen’s value against other currencies seen as more risky to invest in.
-
22:00
Mexico Fiscal Balance, pesos rose from previous -618.56B to -19.42B in January
-
21:45
Gold plunges 3% weekly as trade policies, recession fears fuel USD rally
- Gold drops over 1% Friday as USD strengthens, hitting 10-day high at 107.66.
- XAU/USD falls to $2,845 as Fed rate-cut bets rise
- Trump confirms 25% tariffs on Mexico and Canada, fueling market uncertainty.
- Fed expected to cut rates by 70 bps in 2025 with first cut projected for June.
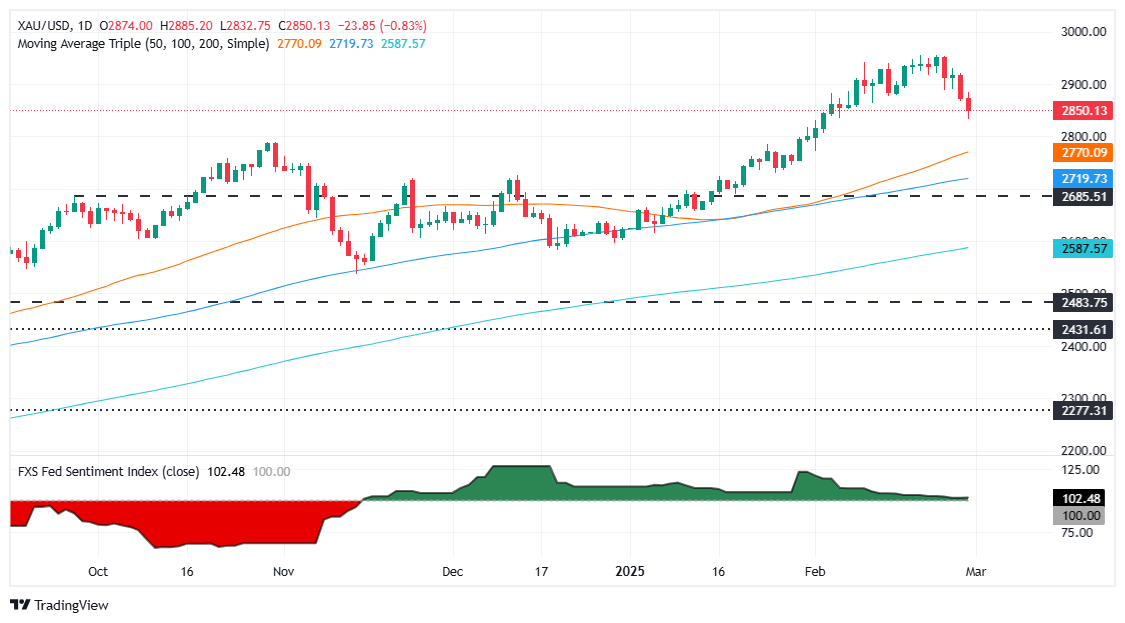
Gold extended its losses on Friday, down more than 1% and over 3% in the week. The US Dollar rose to a ten-day peak of 107.66 amid fears of trade policies in the United States (US) and data that has sparked recessionary worries. The XAU/USD trades at $2,845 after reaching a daily peak of $2,885.
According to US President Donald Trump, 25% tariffs on Mexican and Canadian products will be applied next week on March 4. The release of the Federal Reserve’s (Fed) preferred inflation gauge, the Core Personal Consumption Expenditures (PCE) Price Index, hinted that inflation continued progressing toward the 2% Fed goal.
Expectations that the Fed would continue to ease policy rose after the data. According to Prime Market Terminal, the Fed will lower interest rates by 70 basis points this year with investors projecting the first rate cut in June.
The Atlanta Fed GDPNow estimate has also been updated for Q1 2025. The model shows the economy will contract from a 2.3% expansion to -1.5 %. After the data, the 10-year US Treasury note yield dropped three basis points, and the US Dollar (USD) advanced on recession woes.
In the meantime, some Fed speakers crossed the wires. The Cleveland Fed’s Beth Hammack said that a rate hike is not in the cards, and the impact of trade policies on monetary policy and the economy remains uncertain.
Daily digest market movers: Gold price treads water as US recession looms
- The core PCE in the US rose 0.3% MoM from December and increased 2.6% YoY, as estimated, down from December's 2.8% increase.
- The headline PCE jumped by 2.5% YoY as expected, dipping from 2.6%, and remained unchanged every month at 0.3%, as projected.
- Meanwhile, traders continued to digest US President Donald Trump's tariff rhetoric. He said 25% tariffs on Mexico and Canada would start next week, alongside an additional 10% on China.
- The US 10-year Treasury note yield is at 4.229%, capping the Bullion price decline. US real yields, as measured by the yield in the US 10-year Treasury Inflation-Protected Securities (TIPS), edge lower five bps to 1.853%.
- Last week, Goldman Sachs revised Gold price projections to $3,100 by the end of 2025.
XAU/USD technical outlook: Gold extends losses beneath $2,850
Gold price registers back-to-back bearish candles, a sign that traders are booking profits ahead of the weekend and squaring their portfolios at the end of the month. Once XAU/USD dropped below $2,900, it extended its fall toward $2,832, but a daily close above 2,850 would keep buyers hopeful for higher prices.
In that outcome, XAU/USD first resistance would be the $2,900 mark, ahead of the year-to-date (YTD) high of $2,956. Otherwise, Gold’s first support would be $2,800, followed by the October 31 daily peak at $2,790 and by the 50-day Simple Moving Average (SMA) at $2,770.
Gold FAQs
Gold has played a key role in human’s history as it has been widely used as a store of value and medium of exchange. Currently, apart from its shine and usage for jewelry, the precious metal is widely seen as a safe-haven asset, meaning that it is considered a good investment during turbulent times. Gold is also widely seen as a hedge against inflation and against depreciating currencies as it doesn’t rely on any specific issuer or government.
Central banks are the biggest Gold holders. In their aim to support their currencies in turbulent times, central banks tend to diversify their reserves and buy Gold to improve the perceived strength of the economy and the currency. High Gold reserves can be a source of trust for a country’s solvency. Central banks added 1,136 tonnes of Gold worth around $70 billion to their reserves in 2022, according to data from the World Gold Council. This is the highest yearly purchase since records began. Central banks from emerging economies such as China, India and Turkey are quickly increasing their Gold reserves.
Gold has an inverse correlation with the US Dollar and US Treasuries, which are both major reserve and safe-haven assets. When the Dollar depreciates, Gold tends to rise, enabling investors and central banks to diversify their assets in turbulent times. Gold is also inversely correlated with risk assets. A rally in the stock market tends to weaken Gold price, while sell-offs in riskier markets tend to favor the precious metal.
The price can move due to a wide range of factors. Geopolitical instability or fears of a deep recession can quickly make Gold price escalate due to its safe-haven status. As a yield-less asset, Gold tends to rise with lower interest rates, while higher cost of money usually weighs down on the yellow metal. Still, most moves depend on how the US Dollar (USD) behaves as the asset is priced in dollars (XAU/USD). A strong Dollar tends to keep the price of Gold controlled, whereas a weaker Dollar is likely to push Gold prices up.
-
21:43
AUD/USD slides near 0.6200 after US PCE data, tariffs
- The Aussie extends its losing streak by about 0.54%, slipping near 0.6200 and approaching multi-week lows.
- A six-day decline sees the pair break below the 20-day Simple Moving Average, reinforcing short-term seller strength.
- Traders assess fresh tariff escalations, with President Trump threatening an extra 10% levy on Chinese imports.
- PCE data from the US from January met expectations.
The AUD/USD pair posts a fresh three-week low near 0.6200 in Friday’s trading session after extending its losing streak for the sixth straight day. The Aussie was already under downward pressure throughout the week but faced an extra blow following United States (US) President Donald Trump’s proposal of additional 10% tariffs on China on Thursday. Inflation data from the US also took center stage with the Personal Consumption Expenditures (PCE) data from January meeting expectations as well as Trump’s meeting with the Ukrainian president.
Daily digest market movers: Risk aversion grips Aussie amid trade tension and weak domestic indicators
- President Trump’s new 10% tariff threat on Chinese goods compounds existing duties, fueling fears of further retaliation. Tariffs for Mexico and Canadian goods are set to take place as soon as next week.
- Australian Private Capital Expenditure data unexpectedly shrank by 0.2% quarter-on-quarter in Q4 2024, missing a 0.8% forecast, highlighting weaker investment activity and undermining confidence in the Australian economy.
- Reserve Bank of Australia (RBA) Deputy Governor Andrew Hauser reiterates optimism for inflation improvements but stresses caution amid persistently tight labor-market conditions and uncertain price trends.
- Across the Pacific, the US Core Personal Consumption Expenditures Price Index, considered the Federal Reserve’s (Fed) key inflation measure, rose by 0.3% in January (month-over-month), matching expectations, as Fed policymakers weigh the implications of ongoing trade disputes.
- Ukrainian President Volodymyr Zelenskyy rejected President Trump’s “rare earth deal,” triggering an irate response from Trump and Vice President JD Vance, according to White House sources.
- The scuttled agreement intended to swap defense guarantees for mineral access was deemed ambiguous and insufficient to deter Russia’s invasion. Zelenskyy cited a more favorable proposal from the European Union, further dampening sentiment around the White House.
AUD/USD technical outlook: Sellers push below 20-day SMA as RSI heads toward negative zone
The AUD/USD pair fell by around 0.54% to trade near 0.6200 on Friday, extending a six-day losing streak and losing support from its 20-day Simple Moving Average. The Relative Strength Index (RSI) hovers in the lower part of the scale, suggesting waning bullish momentum, while the Moving Average Convergence Divergence (MACD) histogram shows decreasing green bars, reflecting diminishing upside pressure. Immediate support could emerge around the 0.6150 zone, whereas a bounce would likely face resistance near the 20-day SMA if risk sentiment improves or tariff anxieties recede.
Australian Dollar FAQs
One of the most significant factors for the Australian Dollar (AUD) is the level of interest rates set by the Reserve Bank of Australia (RBA). Because Australia is a resource-rich country another key driver is the price of its biggest export, Iron Ore. The health of the Chinese economy, its largest trading partner, is a factor, as well as inflation in Australia, its growth rate and Trade Balance. Market sentiment – whether investors are taking on more risky assets (risk-on) or seeking safe-havens (risk-off) – is also a factor, with risk-on positive for AUD.
The Reserve Bank of Australia (RBA) influences the Australian Dollar (AUD) by setting the level of interest rates that Australian banks can lend to each other. This influences the level of interest rates in the economy as a whole. The main goal of the RBA is to maintain a stable inflation rate of 2-3% by adjusting interest rates up or down. Relatively high interest rates compared to other major central banks support the AUD, and the opposite for relatively low. The RBA can also use quantitative easing and tightening to influence credit conditions, with the former AUD-negative and the latter AUD-positive.
China is Australia’s largest trading partner so the health of the Chinese economy is a major influence on the value of the Australian Dollar (AUD). When the Chinese economy is doing well it purchases more raw materials, goods and services from Australia, lifting demand for the AUD, and pushing up its value. The opposite is the case when the Chinese economy is not growing as fast as expected. Positive or negative surprises in Chinese growth data, therefore, often have a direct impact on the Australian Dollar and its pairs.
Iron Ore is Australia’s largest export, accounting for $118 billion a year according to data from 2021, with China as its primary destination. The price of Iron Ore, therefore, can be a driver of the Australian Dollar. Generally, if the price of Iron Ore rises, AUD also goes up, as aggregate demand for the currency increases. The opposite is the case if the price of Iron Ore falls. Higher Iron Ore prices also tend to result in a greater likelihood of a positive Trade Balance for Australia, which is also positive of the AUD.
The Trade Balance, which is the difference between what a country earns from its exports versus what it pays for its imports, is another factor that can influence the value of the Australian Dollar. If Australia produces highly sought after exports, then its currency will gain in value purely from the surplus demand created from foreign buyers seeking to purchase its exports versus what it spends to purchase imports. Therefore, a positive net Trade Balance strengthens the AUD, with the opposite effect if the Trade Balance is negative.
-
21:32
United States CFTC S&P 500 NC Net Positions rose from previous $-40K to $-32.8K
-
21:32
Australia CFTC AUD NC Net Positions climbed from previous $-56.7K to $-45.6K
-
21:32
United States CFTC Gold NC Net Positions dipped from previous $268.7K to $261.6K
-
21:32
United Kingdom CFTC GBP NC Net Positions climbed from previous £-0.6K to £4.5K
-
21:32
Japan CFTC JPY NC Net Positions climbed from previous ¥60.6K to ¥96K
-
21:31
Eurozone CFTC EUR NC Net Positions rose from previous €-51.4K to €-25.4K
-
21:31
United States CFTC Oil NC Net Positions: 171.2K vs previous 197.6K
-
20:29
Mexican Peso plunges as Trump confirms March tariffs, Peso faces weekly losses
- USD/MXN rises 0.22% to 20.52 as tariff fears weigh on sentiment.
- Mexico’s trade deficit widens and unemployment ticks higher, adding to economic concerns.
- Banxico’s dovish stance and US trade policies could push USD/MXN toward 21.00.
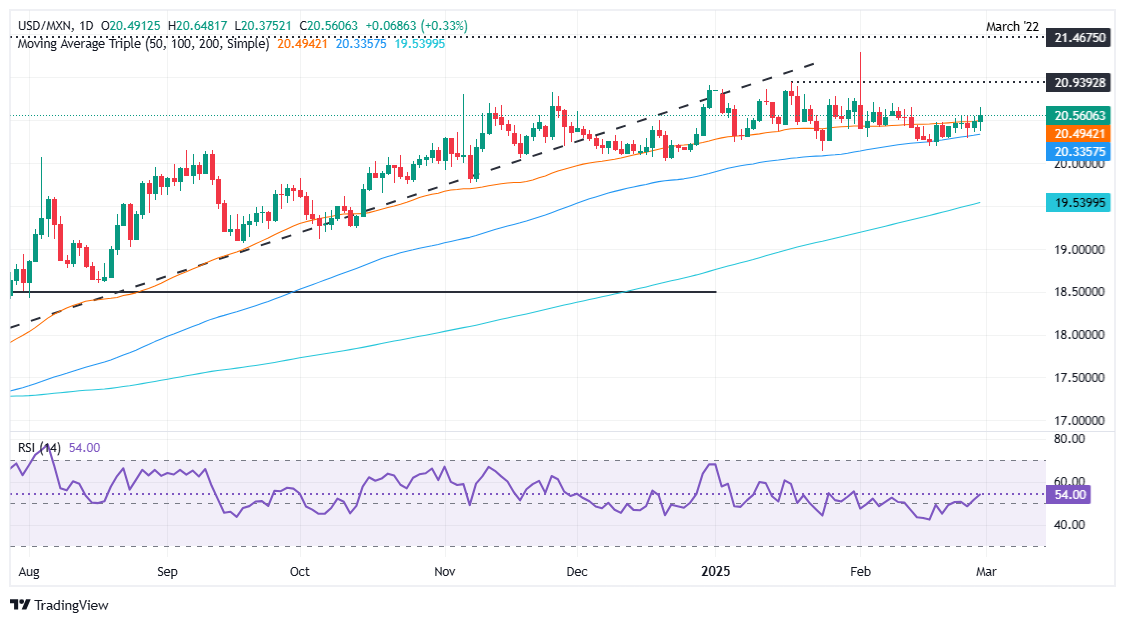
The Mexican Peso (MXN) prolonged its agony and depreciated against the Greenback on Friday, set to achieve weekly losses of over 0.59% as the President of the United States (US) Donald Trump emphasized that tariffs on Mexico are moving forward on March 4. USD/MXN trades at 20.52, up 0.22%.
The emerging market currency remains pressured by US trade policies to be enacted next week. Mexico’s current week’s data showed the Balance of Trade registered a deficit in January, in contrast to December surpluses. Meanwhile, the Unemployment Rate rose two tenths, which could weigh on economic growth.
Traders continued to digest US President Trump's tariffs, saying that 25% duties on Mexico and Canada would start next week, alongside an additional 10% on China. Meanwhile, Mexican Economy Secretary Marcelo Ebrard will meet with Trade Representative Jamieson Greer on Thursday and Commerce Secretary Howard Lutnick on Friday.
Across the border, the Federal Reserve’s (Fed) preferred inflation gauge, the Core Personal Consumption Expenditures (PCE) Price Index, dipped annually, showing progress in monthly and yearly figures.
Given the fundamental backdrop, the USD/MXN pair could rise in the short term. Trade policies, geopolitics, and Banxico's dovish stance could push the pair to challenge the 21.00 level.
Cleveland Fed Beth Hammack stated that a rate hike is not in the outlook and added that the potential economic impact of tariffs and how they might influence monetary policy is uncertain.
Daily digest market movers: Mexican Peso treads water as Trump’s tariff deadline approaches
- The Peso remains adrift to discussions between Mexican and US officials in Washington.
- Mexico’s Balance of Trade witnessed a more pronounced deficit than the $3.8 billion expected in January. It widened to $4.55 billion after sustaining a surplus of $2.576 billion in December.
- The Unemployment Rate in Mexico rose by 2.7% as expected in January, up from December’s 2.4%.
- The US Core Personal Consumption Expenditures (PCE) Price Index, the Fed’s preferred inflation gauge, rose 0.3% Month over Month in January, matching expectations and accelerating from December. On a year-over-year (YoY) basis, core PCE eased to 2.6%, down from December’s 2.9%.
- US headline inflation expanded 2.5% YoY, in line with forecasts but slightly lower than December’s 2.6%. Monthly, it remained unchanged at 0.3%, as projected.
- The swaps markets hint that the Federal Reserve might ease policy by 58 basis points, up from last week's 70 bps in 2025, via data from the Chicago Board of Trade (CBOT).
- Trade disputes between the US and Mexico remain front and center. Although the countries found common ground previously, USD/MXN traders should know that the 30-day pause is about to end, and tensions could trigger volatility in the pair during the rest of the week.
USD/MXN technical outlook: Mexican Peso falls as USD/MXN hurdles 50-day SMA
USD/MXN maintains a bullish bias and a break above the 50-day Simple Moving Average (SMA) at 20.45 would pave the way for a push toward 20.50. The Relative Strength Index (RSI), now above 50, reached its highest level in February, signaling strong bullish momentum. Buyers will aim to clear the January 17 high of 20.93, followed by 21.00, and the year-to-date (YTD) high of 21.28.
On the downside, failure to hold above the 50-day SMA could trigger a pullback toward the 100-day SMA at 20.24. Further weakness could be seen in the pair breaking below this dynamic support, potentially testing the psychological 20.00 level.
Mexican Peso FAQs
The Mexican Peso (MXN) is the most traded currency among its Latin American peers. Its value is broadly determined by the performance of the Mexican economy, the country’s central bank’s policy, the amount of foreign investment in the country and even the levels of remittances sent by Mexicans who live abroad, particularly in the United States. Geopolitical trends can also move MXN: for example, the process of nearshoring – or the decision by some firms to relocate manufacturing capacity and supply chains closer to their home countries – is also seen as a catalyst for the Mexican currency as the country is considered a key manufacturing hub in the American continent. Another catalyst for MXN is Oil prices as Mexico is a key exporter of the commodity.
The main objective of Mexico’s central bank, also known as Banxico, is to maintain inflation at low and stable levels (at or close to its target of 3%, the midpoint in a tolerance band of between 2% and 4%). To this end, the bank sets an appropriate level of interest rates. When inflation is too high, Banxico will attempt to tame it by raising interest rates, making it more expensive for households and businesses to borrow money, thus cooling demand and the overall economy. Higher interest rates are generally positive for the Mexican Peso (MXN) as they lead to higher yields, making the country a more attractive place for investors. On the contrary, lower interest rates tend to weaken MXN.
Macroeconomic data releases are key to assess the state of the economy and can have an impact on the Mexican Peso (MXN) valuation. A strong Mexican economy, based on high economic growth, low unemployment and high confidence is good for MXN. Not only does it attract more foreign investment but it may encourage the Bank of Mexico (Banxico) to increase interest rates, particularly if this strength comes together with elevated inflation. However, if economic data is weak, MXN is likely to depreciate.
As an emerging-market currency, the Mexican Peso (MXN) tends to strive during risk-on periods, or when investors perceive that broader market risks are low and thus are eager to engage with investments that carry a higher risk. Conversely, MXN tends to weaken at times of market turbulence or economic uncertainty as investors tend to sell higher-risk assets and flee to the more-stable safe havens.
-
19:34
US Dollar steadies after in-line PCE data
- January’s Personal Consumption Expenditures data aligned with expectations.
- President Trump confirms that tariffs on Canada, Mexico, and China will take effect on March 4.
- DXY is set to record a 0.60% weekly gain, holding onto Thursday’s rally.
The US Dollar Index (DXY), which measures the value of the US Dollar against a basket of six major currencies, remains firm above 107.00 on Friday after January’s Personal Consumption Expenditures (PCE) inflation data came in line with forecasts, easing concerns over unexpected inflation spikes.
The Greenback retains its recent gains as President Donald Trump reaffirms that tariffs on Canada, Mexico, and China will be implemented on March 4. Meanwhile, risk sentiment improves with US equity markets erasing earlier losses and moving higher.
Daily digest market movers: US Dollar holds firm after PCE report
- DXY hovers around 107.30, aiming to sustain its bullish momentum heading into the weekend.
- Trump administration confirms that tariffs on Canada and Mexico will take effect on March 4, with China facing an additional 10% levy.
- January’s PCE inflation data met expectations with monthly headline PCE at 0.3%, unchanged from the prior reading.
- Core PCE at 0.3%, ticking up from December’s 0.2%, while the annual headline PCE at 2.6%, slightly exceeding expectations but in line with December’s 2.6%. Core PCE arrived at 2.6%, easing from a revised 2.9% in December.
- In addition, the Chicago Purchasing Managers Index (PMI) jumps to 45.5, surpassing the 40.6 consensus and improving from January’s 39.5.
- Regarding expectations, the CME FedWatch Tool indicates a 30% probability that the Federal Reserve will keep rates unchanged at 4.25%-4.50% in June, with the rest pointing to potential cuts.
- On the foreign policy front, tensions rise between US President Donald Trump and Ukrainian leader Volodymyr Zelenskyy over peace deal negotiations.Zelenskyy pushed for US promises on defense, while Trump accused him of being “disrespectful” in a heated public exchange.
DXY technical outlook: Holding steady with weekly gains
The US Dollar Index remains above 107.00, consolidating its 0.60% weekly gain after rebounding above the 100-day Simple Moving Average (SMA) at 106.60. Technical indicators, including the Relative Strength Index (RSI) and Moving Average Convergence Divergence (MACD), signal mild recovery, but further bullish momentum is needed. Resistance is seen at 107.50, while support lies at 106.60 and 106.00, acting as key levels if selling pressure emerges.
Inflation FAQs
Inflation measures the rise in the price of a representative basket of goods and services. Headline inflation is usually expressed as a percentage change on a month-on-month (MoM) and year-on-year (YoY) basis. Core inflation excludes more volatile elements such as food and fuel which can fluctuate because of geopolitical and seasonal factors. Core inflation is the figure economists focus on and is the level targeted by central banks, which are mandated to keep inflation at a manageable level, usually around 2%.
The Consumer Price Index (CPI) measures the change in prices of a basket of goods and services over a period of time. It is usually expressed as a percentage change on a month-on-month (MoM) and year-on-year (YoY) basis. Core CPI is the figure targeted by central banks as it excludes volatile food and fuel inputs. When Core CPI rises above 2% it usually results in higher interest rates and vice versa when it falls below 2%. Since higher interest rates are positive for a currency, higher inflation usually results in a stronger currency. The opposite is true when inflation falls.
Although it may seem counter-intuitive, high inflation in a country pushes up the value of its currency and vice versa for lower inflation. This is because the central bank will normally raise interest rates to combat the higher inflation, which attract more global capital inflows from investors looking for a lucrative place to park their money.
Formerly, Gold was the asset investors turned to in times of high inflation because it preserved its value, and whilst investors will often still buy Gold for its safe-haven properties in times of extreme market turmoil, this is not the case most of the time. This is because when inflation is high, central banks will put up interest rates to combat it. Higher interest rates are negative for Gold because they increase the opportunity-cost of holding Gold vis-a-vis an interest-bearing asset or placing the money in a cash deposit account. On the flipside, lower inflation tends to be positive for Gold as it brings interest rates down, making the bright metal a more viable investment alternative.
-
19:15
Dow Jones Industrial Average rises then falls as headline turmoil resumes
- The Dow Jones recovered 200 points on Friday but still remains down on the week.
- Equities broadly recovered after US PCE inflation came in as expected.
- Coming up next week: maybe, maybe not tariffs and another NFP print.
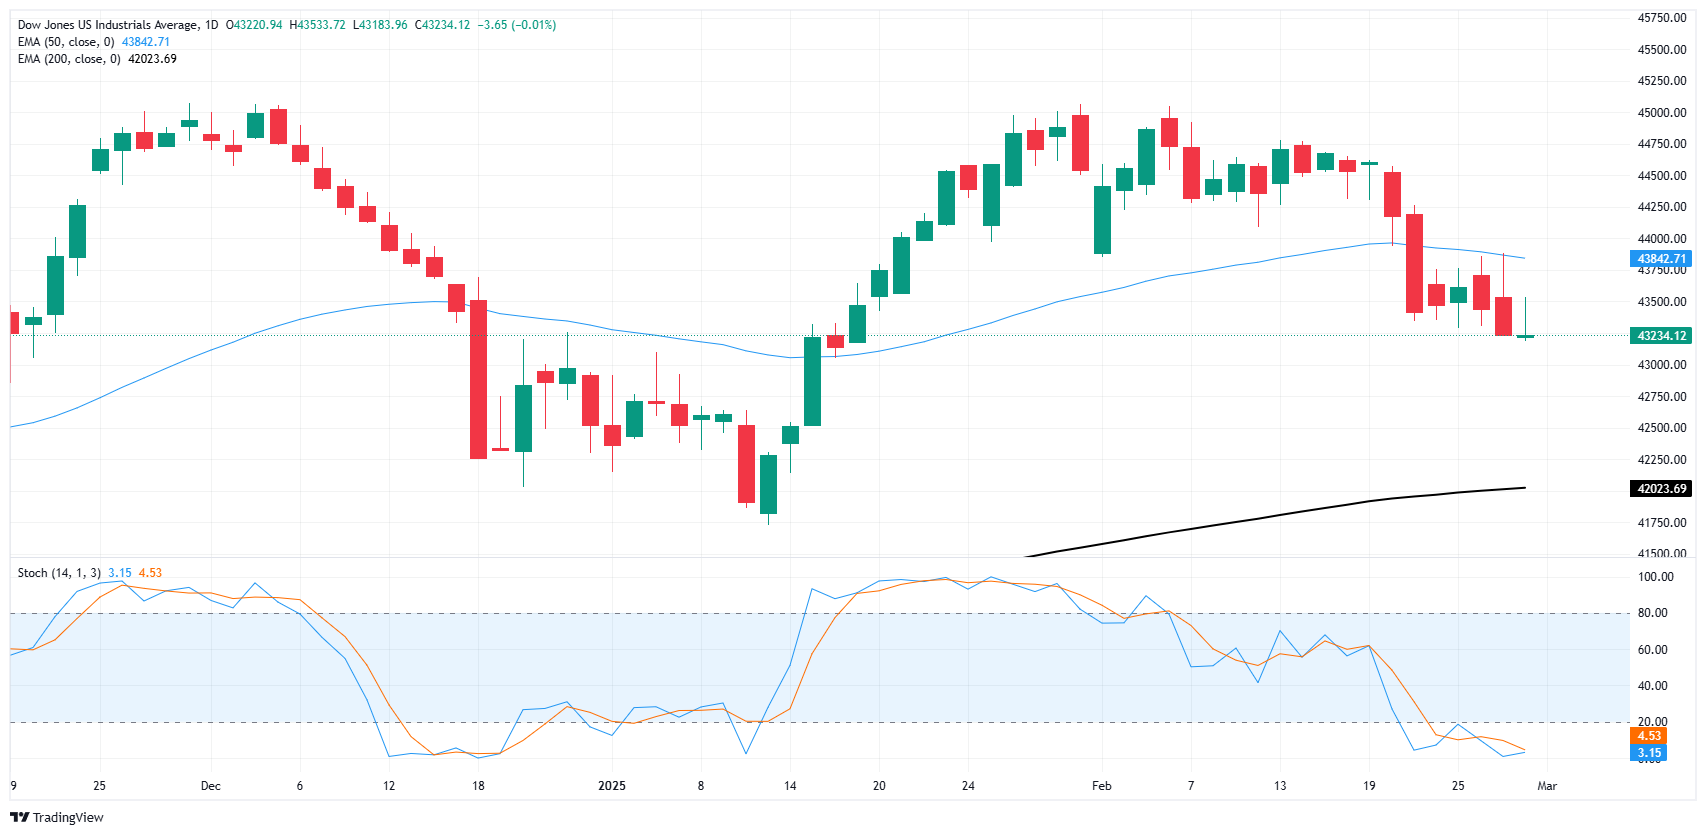
The Dow Jones Industrial Average (DJIA) recovered some lost ground on Friday, rebounding about 200 points to remain in contention with the 43,500 level before giving up and falling back to the day’s opening bids. Despite Friday’s bullish attempt, the major equity index remains down from Monday’s opening prices. US President Donald Trump got in a row with Ukrainian President Volodymyr Zelenskyy after the Ukrainian leader declined to sign Donald Trump’s defense agreement without asking questions or seeking expanded clarification on the contents of President Trump’s much-desired “rare earths deal”.
Read more: US President Trump, Ukrainian President Zelenskyy exchange barbs over defense deal
Despite a recent uptick in headline inflation figures, US Personal Consumption Expenditure Price Index (PCEPI) inflation data still came in broadly as expected, helping to soothe some frayed investor nerves. January’s core PCE Price Index eased to 2.6% YoY from a revised 2.9% YoY, matching median market forecasts. Despite the overall upbeat tone of Friday’s inflation print, market exuberance is unlikely to stretch too far: US inflation factors remain volatile in the face of inconsistent trade policy from the White House, and core metrics continue to run hotter than the Federal Reserve’s (Fed) ideal target of 2%.
A recent uptick in hostile trade language from US President Donald Trump has stepped up investor concerns this week. Markets have generally gotten used to brushing off Donald Trump’s trade tariff bluster after several walkbacks on his own arbitrary timelines for imposing widespread tariffs on most of the US’ closest trading partners. However, President Trump revamped his recent tariff threats, pivoting on his latest delay and declaring that a 25% tariff package on both Canada and Mexico would be coming into effect on March 4.
Adding to market pressures next week, a fresh iteration of US Nonfarm Payrolls (NFP) data looms ahead next Friday. Recent economic data has tilted toward the downside, making investors increasingly concerned about a potential slowdown. Recent jobless figures also accelerated, raising concerns that the US labor market may be showing cracks. Next week’s NFP print will carry additional weight, outside of the usual heavy-hitter it tends to be.
Dow Jones news
The Dow Jones is trading roughly half-and-half on Friday, with winners and losers hung across the middle. 3M (MMM) gained 1.7%, climbing to $153 per share, while IBM (IBM) fell 2%, slipping below $250 per share.
Dow Jones price forecast
The Dow Jones continues to churn lower into bear country, trading on the south side of the 50-day Exponential Moving Average (EMA) near 43,840. The major equity index is still holding above the 200-day EMA at the 42,000 handle, but that particular bull run is growing long in the tooth with the Dow entirely outrunning its own 200-day EMA for over two years. Bullish momentum has certainly faded, but time is running out for sellers as technical oscillators grind into oversold territory, and the DJIA is barely down 4% from its last swing high near 45,000.
Dow Jones daily chart
Dow Jones FAQs
The Dow Jones Industrial Average, one of the oldest stock market indices in the world, is compiled of the 30 most traded stocks in the US. The index is price-weighted rather than weighted by capitalization. It is calculated by summing the prices of the constituent stocks and dividing them by a factor, currently 0.152. The index was founded by Charles Dow, who also founded the Wall Street Journal. In later years it has been criticized for not being broadly representative enough because it only tracks 30 conglomerates, unlike broader indices such as the S&P 500.
Many different factors drive the Dow Jones Industrial Average (DJIA). The aggregate performance of the component companies revealed in quarterly company earnings reports is the main one. US and global macroeconomic data also contributes as it impacts on investor sentiment. The level of interest rates, set by the Federal Reserve (Fed), also influences the DJIA as it affects the cost of credit, on which many corporations are heavily reliant. Therefore, inflation can be a major driver as well as other metrics which impact the Fed decisions.
Dow Theory is a method for identifying the primary trend of the stock market developed by Charles Dow. A key step is to compare the direction of the Dow Jones Industrial Average (DJIA) and the Dow Jones Transportation Average (DJTA) and only follow trends where both are moving in the same direction. Volume is a confirmatory criteria. The theory uses elements of peak and trough analysis. Dow’s theory posits three trend phases: accumulation, when smart money starts buying or selling; public participation, when the wider public joins in; and distribution, when the smart money exits.
There are a number of ways to trade the DJIA. One is to use ETFs which allow investors to trade the DJIA as a single security, rather than having to buy shares in all 30 constituent companies. A leading example is the SPDR Dow Jones Industrial Average ETF (DIA). DJIA futures contracts enable traders to speculate on the future value of the index and Options provide the right, but not the obligation, to buy or sell the index at a predetermined price in the future. Mutual funds enable investors to buy a share of a diversified portfolio of DJIA stocks thus providing exposure to the overall index.
-
19:02
United States Baker Hughes US Oil Rig Count climbed from previous 487 to 489
-
18:39
US President Trump, Ukrainian President Zelenskyy exchange barbs over defense deal
A meeting between US President Donald Trump and Ukrainian leader Volodymyr Zelenskyy devolved into an argument on Friday. According to President Zelenskyy, the terms of the deal are either too ambiguous or missing key components, but is otherwise a good first step.
President Donald Trump, who was operating on the understanding that the deal was finished and President Zelenskyy was visiting simply to finalize the deal, was beyond irate during the public meeting, accusing the Ukranian President of being "disrespectful".
More to come...
-
17:22
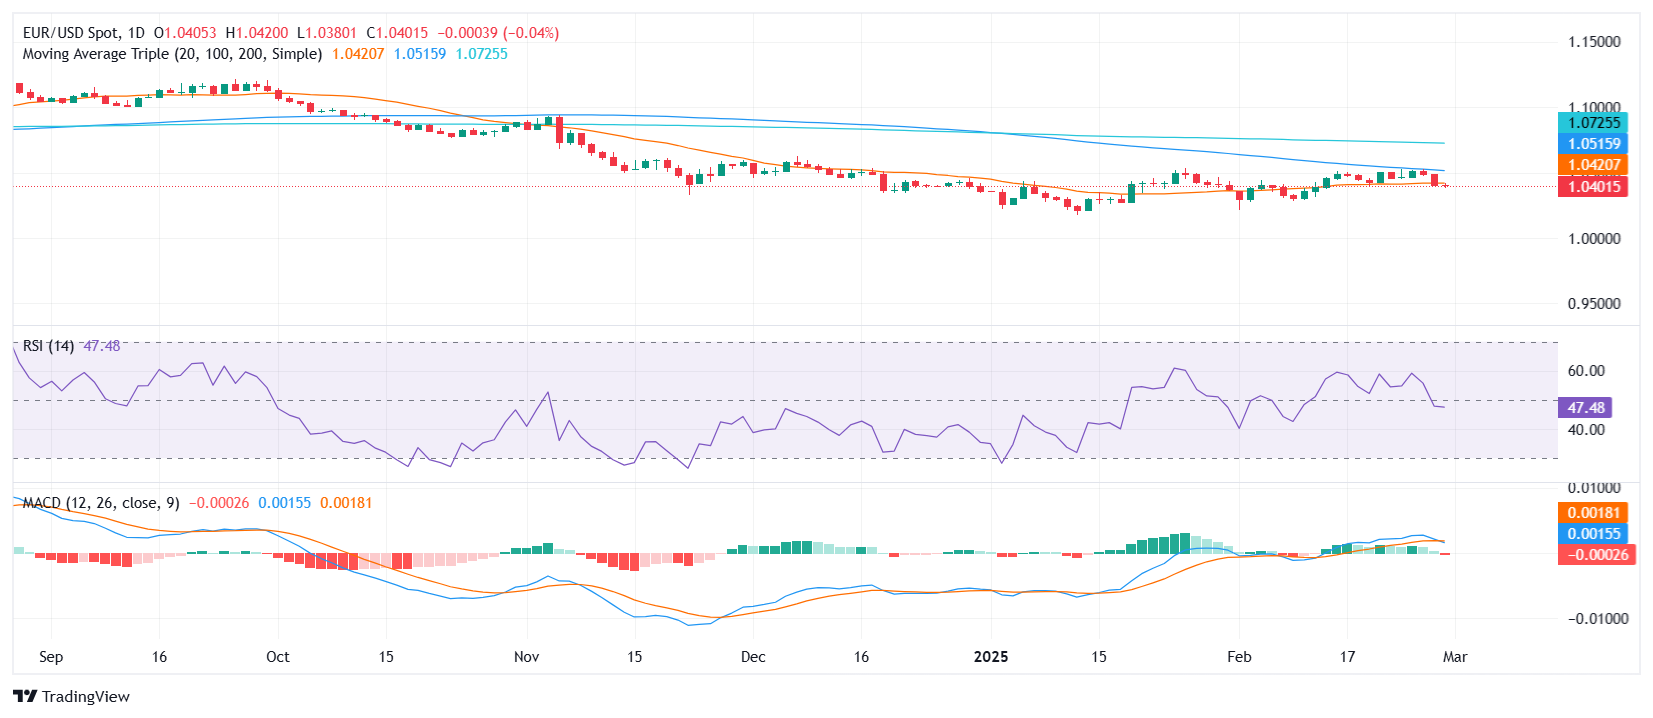
EUR/USD Price Analysis: Pair stabilizes below 20-day SMA, sharp weekly decline
- EUR/USD posts mild movements after a volatile week, bouncing slightly after recent sharp losses.
- After facing a third rejection at the 100-day SMA, the pair plummeted to a two-week low, shedding over 0.70% before stabilizing.
- Key resistance stands at the 20-day SMA near 1.0420.
EUR/USD closed the week with a slight recovery but remains in a vulnerable position after failing to sustain gains above the 100-day Simple Moving Average (SMA). The pair faced a decisive rejection at this level, which now appears to be converging with the 20-day SMA, increasing the likelihood of a bearish crossover.
Despite this downside pressure, by the end of the week, the pair managed to stabilize just below the 20-day SMA, limiting further downside momentum. However, technical signals remain cautious, with the Relative Strength Index (RSI) in negative territory but flat, suggesting a temporary pause in the bearish momentum. Meanwhile, the Moving Average Convergence Divergence (MACD) histogram showed a fresh red bar, indicating the presence of selling pressure.
Looking ahead, immediate resistance is seen at the 20-day SMA, which needs to be reclaimed for a sustained recovery. A break above this level could expose the 100-day SMA once again. On the downside, support is located at 1.0380, followed by 1.0350, a key level that could determine the next directional move.
EUR/USD daily chart
-
16:57
GBP/USD struggles at 1.2600 set to first monthly gain since September
- Core PCE rises 2.6% YoY, signaling stalled disinflation but staying near Fed’s target.
- Trump confirms 25% tariffs on Mexico and Canada, adding to trade concerns.
- BoE’s Ramsden sees inflation risks balanced, no longer tilted to the downside.
The Pound Sterling struggles to clear the 1.2600 figure against the US Dollar yet is set for it first monthly gain since September 2024. The Federal Reserve’s (Fed) preferred inflation gauge report was aligned with estimates, hinting that the disinflation process stalled, but it remains near the Fed’s goal. The GBP/USD trades at 1.2607, virtually unchanged.
Pound steadies as US inflation data aligns with expectations
The Core Personal Consumption Expenditures (PCE) Price Index in the US rose 0.3% Month over Month from December and increased 2.6% year over year, as estimated, down from December's 2.8% increase. Headline inflation expanded to 2.5% YoY as expected, dipped from 2.6%, and was unchanged every month as projected at 0.3%.
Meanwhile, traders continued to digest US President Donald Trump's tariff rhetoric. He said 25% tariffs on Mexico and Canada would start next week, alongside an additional 10% on China.
Earlier, Cleveland Fed Beth Hammack said that a rate hike is not in her current outlook, that inflation expectations are still anchored, and that it is unclear how far tariffs could affect the economy and, consequently, monetary policy.
Across the pond, Bank of England (BoE) Governor David Ramsen said that the risks of hitting the 2% inflation target in the medium term are two-sided and no longer tilted to the downside.
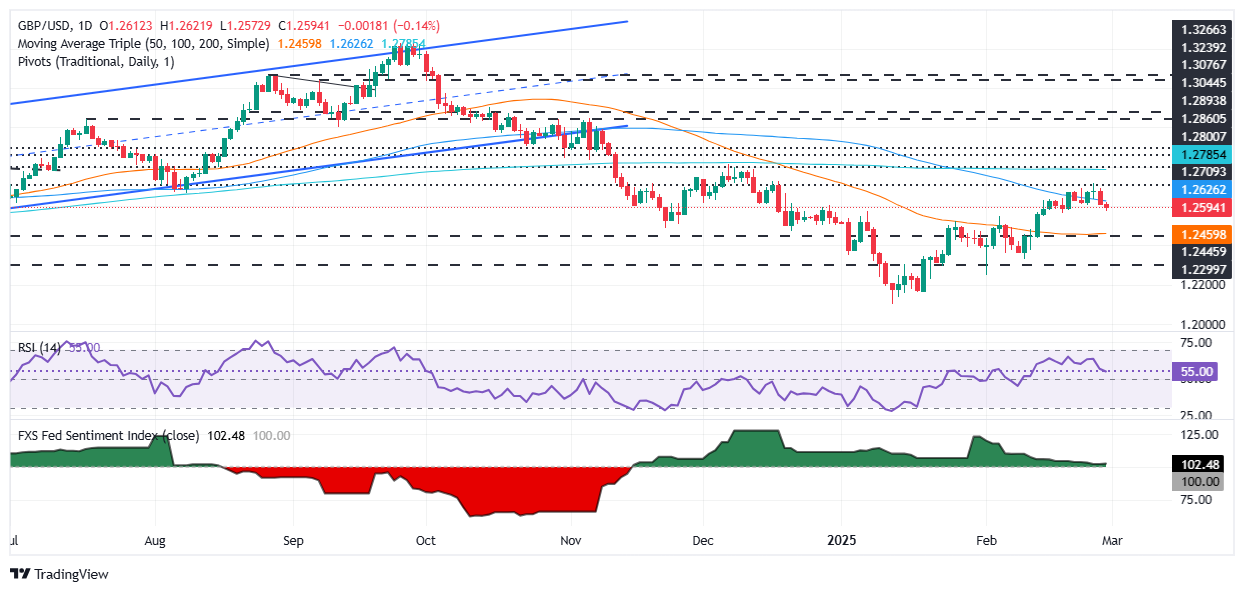
GBP/USD Price Analysis: Technical outlook
The GBP/USD has recovered some ground, yet it remains tilted to the downside despite consolidating at around the 1.2549 – 1.2700 range. To extend their gains, buyers must clear the 1.2700 mark, followed by the 200-day Simple Moving Average (SMA) at 1.2785. Further gains are seen above 1.2800.
Conversely, if sellers keep the major from closing daily above 1.2600, this could pave the way for a test of the 1.2549 February 5 daily peak. If surpassed, sellers could challenge the 50-day SMA at 1.2457.
Pound Sterling FAQs
The Pound Sterling (GBP) is the oldest currency in the world (886 AD) and the official currency of the United Kingdom. It is the fourth most traded unit for foreign exchange (FX) in the world, accounting for 12% of all transactions, averaging $630 billion a day, according to 2022 data. Its key trading pairs are GBP/USD, also known as ‘Cable’, which accounts for 11% of FX, GBP/JPY, or the ‘Dragon’ as it is known by traders (3%), and EUR/GBP (2%). The Pound Sterling is issued by the Bank of England (BoE).
The single most important factor influencing the value of the Pound Sterling is monetary policy decided by the Bank of England. The BoE bases its decisions on whether it has achieved its primary goal of “price stability” – a steady inflation rate of around 2%. Its primary tool for achieving this is the adjustment of interest rates. When inflation is too high, the BoE will try to rein it in by raising interest rates, making it more expensive for people and businesses to access credit. This is generally positive for GBP, as higher interest rates make the UK a more attractive place for global investors to park their money. When inflation falls too low it is a sign economic growth is slowing. In this scenario, the BoE will consider lowering interest rates to cheapen credit so businesses will borrow more to invest in growth-generating projects.
Data releases gauge the health of the economy and can impact the value of the Pound Sterling. Indicators such as GDP, Manufacturing and Services PMIs, and employment can all influence the direction of the GBP. A strong economy is good for Sterling. Not only does it attract more foreign investment but it may encourage the BoE to put up interest rates, which will directly strengthen GBP. Otherwise, if economic data is weak, the Pound Sterling is likely to fall.
Another significant data release for the Pound Sterling is the Trade Balance. This indicator measures the difference between what a country earns from its exports and what it spends on imports over a given period. If a country produces highly sought-after exports, its currency will benefit purely from the extra demand created from foreign buyers seeking to purchase these goods. Therefore, a positive net Trade Balance strengthens a currency and vice versa for a negative balance.
-
16:28
ECB: Keeping all options open – Rabobank
A growing group of policymakers is calling for a pause soon, but this will not affect next week’s meeting, Rabobank’s Senior Macro Strategist Bas van Geffen reports.
ECB to cut the deposit rate by 25bp in at next week’s meeting
“The staff projections will probably include an upward revision to 2025 inflation, but they may be outdated already. Plus, US tariffs could shorten the shelf life of these forecasts.”
“The ECB could perhaps include a scenario with placeholder tariffs to underscore its reaction function. Factoring in placeholder tariffs, we estimate a longer time for inflation to converge to target than the ECB.”
“We expect the ECB to cut the deposit rate by 25bp in at next week’s meeting. Our base case remains one further cut in April, but we see increasing risks that the next move is delayed to June.”
-
16:01
Colombia National Jobless Rate: 11.6% (January) vs 9.1%
-
15:45
United States Chicago Purchasing Managers' Index registered at 45.5 above expectations (40.6) in February
-
15:44
USD/CAD ticks lower after US PCE Inflation, Canadian GDP data release
- USD/CAD falls slightly after the release of the US PCE inflation data for January and the Canadian Q4 and December GDP data.
- The US core PCE decelerated to 2.6% from 2.8% in December, as expected.
- The Canadian economy surprisingly rose at a higher growth rate of 2.6% on an annualized basis.
The USD/CAD pair edges lower to near but holds onto Thursday’s gains around 1.4430 in North American trading hours on Friday. The Loonie pair ticks lower after the release of the United States (US) Personal Consumption Expenditure Price Index (PCE) data for January and the Canadian Gross Domestic Product (GDP) data for the December month and the fourth quarter of 2024.
The US core PCE inflation – which excludes volatile food and energy items – grew at a slower pace of 2.6%, as expected, on year against 2.8% in December. On month, the underlying inflation rose expectedly by 0.3%, faster than the former reading of 0.2%.
An expected slowdown in US inflation is expected to provide relief to the Federal Reserve (Fed), which has been endorsing a restrictive interest rate stance. This could also compel them to discuss for how long the borrowing rates should remain in the current range of 4.25%-4.50%.
Meanwhile, the Canadian GDP data has remained mixed. The Canadian economy expanded by 2.6%, compared to same quarter of 2023 and surprisingly faster than 2.2% growth seen in third quarter of the previous year, upwardly revised from 1%. Market participants expected the economy to have expanded at a slower pace of 1.9%.
In December, the Canadian economy grew by 0.2%, the same pace at which it declined in November. Economists expected a higher growth rate of 0.3%.
Broadly, the outlook of the Canadian Dollar (CAD) remains weak as US President Donald Trump has confirmed that he will impose 25% tariffs on Canada and Mexico on March 4 for failing to restrict the flow of fentanyl, made in and supplied by China, into the US economy.
-
14:39
United States Goods Trade Balance below expectations ($-114.7B) in January: Actual ($-153.3B)
-
14:30
United States Wholesale Inventories above forecasts (0.1%) in January: Actual (0.7%)
-
14:30
United States Core Personal Consumption Expenditures - Price Index (MoM) in line with expectations (0.3%) in January
-
14:30
United States Personal Income (MoM) registered at 0.9% above expectations (0.3%) in January
-
14:30
United States Personal Consumption Expenditures - Price Index (MoM) in line with expectations (0.3%) in January
-
14:30
Canada Gross Domestic Product (MoM) came in at 0.2% below forecasts (0.3%) in December
-
14:30
United States Goods Trade Balance registered at $153.3B above expectations ($-114.7B) in January
-
14:30
United States Personal Spending came in at -0.2%, below expectations (0.1%) in January
-
14:30
United States Core Personal Consumption Expenditures - Price Index (YoY) meets forecasts (2.6%) in January
-
14:30
United States Personal Consumption Expenditures - Price Index (YoY) meets expectations (2.5%) in January
-
14:30
Canada Gross Domestic Product (QoQ) rose from previous 0.3% to 0.6% in 4Q
-
14:30
Canada Gross Domestic Product Annualized came in at 2.6%, above forecasts (1.9%) in 4Q
-
14:28
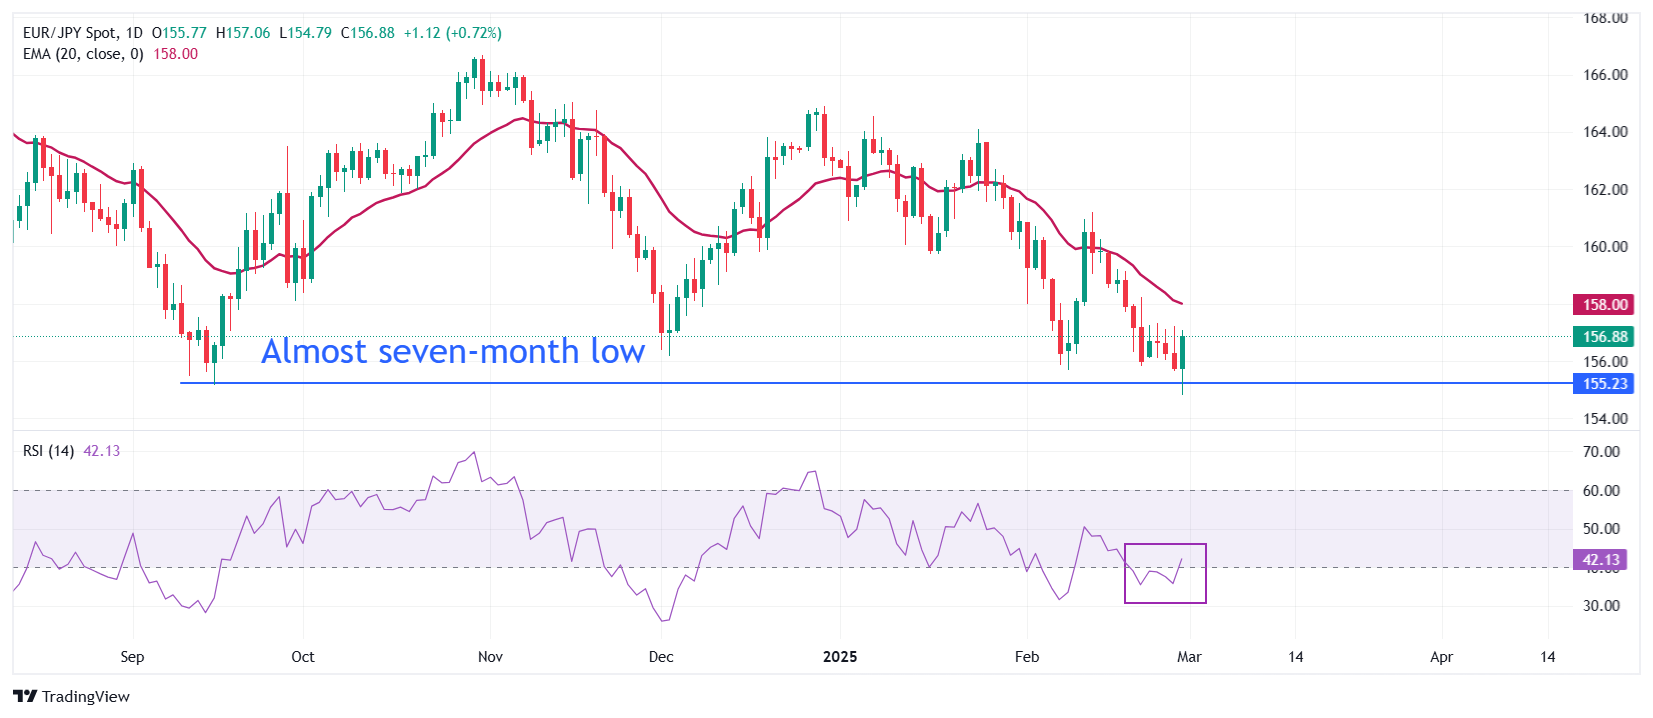
EUR/JPY Price Forecast: Rallies to near 157.00 as Yen weakens across the board
- EUR/JPY surges to near 157.00 as soft Tokyo CPI data sends the Yen on the backfoot.
- Moderate Tokyo CPI growth is expected to weigh on BoJ hawkish bets.
- Steady German HICP growth is unlikely to restrict the ECB from easing monetary policy further.
The EUR/JPY pair rallies to near 157.00 in the North American session on Friday. The pair strengthens as the Japanese Yen (JPY) is underperforming across the board after the release of the soft Tokyo Consumer Price Index (CPI) data for February.
Japanese Yen PRICE Today
The table below shows the percentage change of Japanese Yen (JPY) against listed major currencies today. Japanese Yen was the strongest against the New Zealand Dollar.
USD EUR GBP JPY CAD AUD NZD CHF USD -0.08% 0.06% 0.66% -0.16% 0.31% 0.52% 0.31% EUR 0.08% 0.15% 0.75% -0.06% 0.40% 0.62% 0.40% GBP -0.06% -0.15% 0.59% -0.22% 0.25% 0.46% 0.24% JPY -0.66% -0.75% -0.59% -0.80% -0.35% -0.14% -0.35% CAD 0.16% 0.06% 0.22% 0.80% 0.46% 0.68% 0.46% AUD -0.31% -0.40% -0.25% 0.35% -0.46% 0.21% -0.00% NZD -0.52% -0.62% -0.46% 0.14% -0.68% -0.21% -0.22% CHF -0.31% -0.40% -0.24% 0.35% -0.46% 0.00% 0.22% The heat map shows percentage changes of major currencies against each other. The base currency is picked from the left column, while the quote currency is picked from the top row. For example, if you pick the Japanese Yen from the left column and move along the horizontal line to the US Dollar, the percentage change displayed in the box will represent JPY (base)/USD (quote).
Statistics Bureau of Japan reported that the Tokyo headline CPI decelerated significantly to 2.9% from 3.4% in January. In the same period, the Tokyo CPI ex. Fresh Food rose by 2.2%, slower than estimates of 2.3% and the former release of 2.5%. Soft Tokyo CPI data is likely to weigh on market expectations that the Bank of Japan (BoJ) will raise interest rates again this year.
Meanwhile, the Euro (EUR) outperforms its major peers despite fears that United States (US) President Donald Trump’s tariff agenda will be unfavorable for the Eurozone economy. On Wednesday, Trump threatened to impose 25% tariffs on cars and other things imported from the Eurozone sooner.
On the domestic front, hotter-than-expected flash German Harmonized Index of Consumer Prices (HICP) data for February is unlikely to ease market expectations that the European Central Bank (ECB) will reduce its Deposit Facility rate by 25 basis points (bps) to 2.5% in the policy meeting on Thursday.
German HICP rose steadily by 2.8%, faster than estimates of 2.7% on year. Month-on-month HICP grew at a faster pace of 0.6% than expectations of 0.5%. In January, the underlying inflation data deflated by 0.2%.
EUR/JPY recovers strongly after revisiting an almost seven-month low of 155.15 on Friday. However, the near-term outlook of the cross is still bearish as the 20-day Exponential Moving Average (EMA) is sloping downwards to near 158.00.
The 14-day Relative Strength Index (RSI) bounced back to the 40.00-60.00 range, which indicates that bearish momentum has ended. However, the negative bias remains intact.
More recovery in the EUR/JPY pair above the February 25 high of 157.30 would allow it to gain further towards the 20-day EMA around 158.00, followed by the February 19 high of 159.14.
On the flip side, a downside move by the pair below the intraday low of 154.80 would expose it to the August 5 low of 154.40 and the 19-month low of 153.17.
EUR/JPY daily chart
Japanese Yen FAQs
The Japanese Yen (JPY) is one of the world’s most traded currencies. Its value is broadly determined by the performance of the Japanese economy, but more specifically by the Bank of Japan’s policy, the differential between Japanese and US bond yields, or risk sentiment among traders, among other factors.
One of the Bank of Japan’s mandates is currency control, so its moves are key for the Yen. The BoJ has directly intervened in currency markets sometimes, generally to lower the value of the Yen, although it refrains from doing it often due to political concerns of its main trading partners. The BoJ ultra-loose monetary policy between 2013 and 2024 caused the Yen to depreciate against its main currency peers due to an increasing policy divergence between the Bank of Japan and other main central banks. More recently, the gradually unwinding of this ultra-loose policy has given some support to the Yen.
Over the last decade, the BoJ’s stance of sticking to ultra-loose monetary policy has led to a widening policy divergence with other central banks, particularly with the US Federal Reserve. This supported a widening of the differential between the 10-year US and Japanese bonds, which favored the US Dollar against the Japanese Yen. The BoJ decision in 2024 to gradually abandon the ultra-loose policy, coupled with interest-rate cuts in other major central banks, is narrowing this differential.
The Japanese Yen is often seen as a safe-haven investment. This means that in times of market stress, investors are more likely to put their money in the Japanese currency due to its supposed reliability and stability. Turbulent times are likely to strengthen the Yen’s value against other currencies seen as more risky to invest in.
-
14:23
GBP holds up well on the day – Scotiabank
Pound Sterling (GBP) is the best performing G10 currency on the week but is still trading with a 0.3% loss against the generally firmer USD, Scotiabank's Chief FX Strategist Shaun Osborne notes.
PM Starmer visit to Washington goes well
"PM Starmer’s visit to Washington was an apparent success, with some agreement on security and trade issues. Rather than tariffs, trade dialogue seems to be the order of the day. Trade and monetary policy risks suggest EUR/GBP should put major support at 0.82 under more pressure in the coming weeks."
"Spot continues to chop around the 100- day MA (1.2628). Intraday losses may be steadying ahead of short-term support at 1.2555/65. Resistance is 1.2610/20 ahead of 1.2690/00."
-
14:15
EUR soft but off lows – Scotiabank
Inflation data from France showed unchanged prices on the February month (versus expectations of a 0.2% rise), Scotiabank's Chief FX Strategist Shaun Osborne notes.
Trade/ tariff concerns continue to weigh on the EUR
"Trade/ tariff concerns continue to weigh on the EUR outlook, driving a deeper divergence with my estimated spot fair value of 1.0687, driven by improving real yields and significantly superior EZ equity market returns."
"Range parameters are being defined by the 100-day MA at 1.0517 and the 40-day MA at 1.0392 currently. Trend momentum signals are not especially strong on the intraday and daily oscillators, suggesting range trading may extend."
"But short-term price action does lean a little more bearish after repeated EUR failures in the low 1.05 zone this month and the loss of support in the low 1.04 zone, however. Risks may be tilted towards a push to 1.02 in the short run."
-
14:11
CAD resists deeper USD advance through mid-1.44s – Scotiabank
Right, so border tariffs are back on for next Tuesday. But maybe only for a short period? So much tariff-mongering, so little clarity, Scotiabank's Chief FX Strategist Shaun Osborne notes.
CAD little changed on the day
"The president is certainly keeping Canadian and Mexican feet to the fire on the border issue but it remains to be seen exactly what emerges next week. The risk of highly punitive tariffs has increased but the FX reaction has been relatively subdued—certainly compared to the early February moves."
"The cost to the Canadian economy will be significant but the impact on the US is non-negligible—via higher prices and negative repercussions for the US auto sector, for example. Stocks closed softly yesterday, with the S&P 500 ending below its 100-day MA for the first time since August. If it does come to 25% tariffs it may be that they are in place for a relatively short period—until the president can point to concrete signs that his stance is having an effect."
"After the quick USD advance to the low 1.44 region yesterday, spot has consolidated through the overnight session. Ranges have been narrow but, at the margin, minor CAD gains in early Asian trade may signal scope for some, minor CAD recovery intraday. The USD enjoys bullish trend momentum on the intraday and daily charts which should limit the CAD’s ability to recover significant ground at this point. Support is 1.4350/75. Resistance is 1.4465/75."
-
14:08
USD extends gains as Asia FX underperforms – Scotiabank
Solid gains for the US Dollar (USD) yesterday reflected renewed tariff concerns, weaker stocks and underperforming alternative havens, such as gold, Scotiabank's Chief FX Strategist Shaun Osborne notes.
USD holds gains amid tariff focus and equity market weakness
"The USD remains firm this morning but is trading off its highs. Asian stocks plunged and European markets are soft while US equity futures are modestly higher at writing. Still, amped up tariff threats are having an impact on risk sentiment and price action (in the S&P 500) is clearly challenging the recent bull run. The 'disciplining' effect of markets might yet have a say on how the US proceeds with tariffs."
"The MXN and CAD are moderate outperformers through the overnight session so far, in fact, and trade little changed on the mostly firmer USD. Asian regional FX and the CHF are underperforming. Bond markets are trading mostly higher, nudging yields 1-2bps lower on the day. In broad terms, spreads continue to narrow against the USD, suggesting some fundamental restraint on gains—were it not for the largely headline-driven nature of market moves at the moment."
"Intraday price action does suggest the DXY’s rise is stalling near 107.5 which may prompt some consolidation or sideways movement in FX overall into the weekend. This morning’s US Personal Income and Spending data is expected to reflect a 0.4% gain in income and a 0.2% rise in spending in January. The core PCE deflator is forecast to show a 0.3% rise in the month—still a little on the warm side—but a moderation in the pace of Y/Y gains to 2.6% (from 2.8%)."
-
14:04
Germany annual CPI inflation holds steady at 2.3% in February as expected
- Annual inflation in Germany held steady at 2.3% in February.
- EUR/USD continues to trade in daily range near 1.0400.
Inflation in Germany, as measured by the change in the Consumer Price Index (CPI), held steady at 2.3% on a yearly basis in February, Destatis' flash estimate showed on Friday. This reading came in line with the market expectation.
On a monthly basis, the CPI rose by 0.4% after falling 0.2% in January.
The Harmonized Index of Consumer Prices in Germany, the European Central Bank's preferred gauge of inflation, rose by 2.8% on a yearly basis, matching January's increase.
Market reaction
EUR/USD showed no immediate reaction to this report and was last seen trading marginally higher on the day at around 1.0400.
-
14:00
Germany Consumer Price Index (YoY) meets forecasts (2.3%) in February
-
14:00
Germany Harmonized Index of Consumer Prices (YoY) registered at 2.8% above expectations (2.7%) in February
-
14:00
Germany Harmonized Index of Consumer Prices (MoM) came in at 0.6%, above expectations (0.5%) in February
-
14:00
Germany Consumer Price Index (MoM) meets forecasts (0.4%) in February
-
13:38
US Dollar holds steady while President Zelenskyy heads to the White House
- The US Dollar holds steady on Friday ahead of the US PCE reading for January.
- Traders expect a stronger PCE after the uptick in PCE under the quarterly GDP release on Thursday.
- The US Dollar Index (DXY) tries to consolidate gains above 107.00.
The US Dollar Index (DXY), which tracks the performance of the US Dollar (USD) against six major currencies, trades around 107.40 at the time of writing on Friday and tries to keep a hold on that level. Markets got shaken up again overnight as United States (US) President Donald Trump confirmed that tariffs for Canada and Mexico are going into effect on March 4. Meanwhile, China will face an additional 10% levy on the same day.
On the economic data front, all eyes on Friday are on the Personal Consumption Expenditures (PCE) data for January. In the second reading of the US Gross Domestic Product (GBP) for the fourth quarter of 2024 on Thursday, the PCE components for both the headline and the core reading were revised up. This tweaks traders’ anticipation at the last minute to possibly see a surprise uptick in the Federal Reserve’s (Fed) preferred inflation gauge.
Daily digest market movers: Inflation and tariffs
- Ukraine President Volodymyr Zelenskyy is heading to Washington D.C. to sign a rare-earth deal with US President Donald Trump this Friday.
- At 13:30 GMT, the Personal Consumption Expenditures Price Index for January is due:
- The monthly headline PCE is expected to come in at 0.3%, unchanged from the previous reading.
- The monthly core PCE reading is expected to tick up to 0.3% from 0.2% in December.
- The headline PCE is expected to rise 2.5% year-over-year compared to 2.6% in December, while the core PCE is expected to rise 2.6% in January compared to 2.8% in the previous month.
- At 14:45 GMT, the Chicago Purchase Managers Index for February is due. The expectation is still for a contraction at 40.6, coming from 39.5 in January.
- Equities are very split this Friday, with heavy losses in Asian trading, while Europe sees mild losses, and US futures are ready for a positive tone just hours before the US opening bell.
- The CME Fedwatch Tool projects a 29.7% chance that interest rates will remain at the current range of 4.25%-4.50% in June, with the rest showing a possible rate cut.
- The US 10-year yield trades around 4.25%, further down from last week’s high at 4.574%.
US Dollar Index Technical Analysis: 107.00 holds
Finally, the US Dollar Index (DXY) might have had a nice uptick. Holding current ground will be key, with the biggest challenge coming from US yields still trending lower, narrowing the rate differential between the US and other countries. Another leg lower is possible should inflation concerns swirl back and push US yields higher again, supporting a stronger US Dollar.
On the upside, the 55-day Simple Moving Average (SMA) is the first resistance to watch for any rejections, currently at 107.97. In case the DXY can break above the 108.00 round level, 108.50 is coming back in scope.
On the downside, as already mentioned, 107.00 needs to hold as support. Nearby, 106.80 (100-day SMA) and 106.52, as a pivotal level, should act as support and avoid any returns to the lower 106-region.
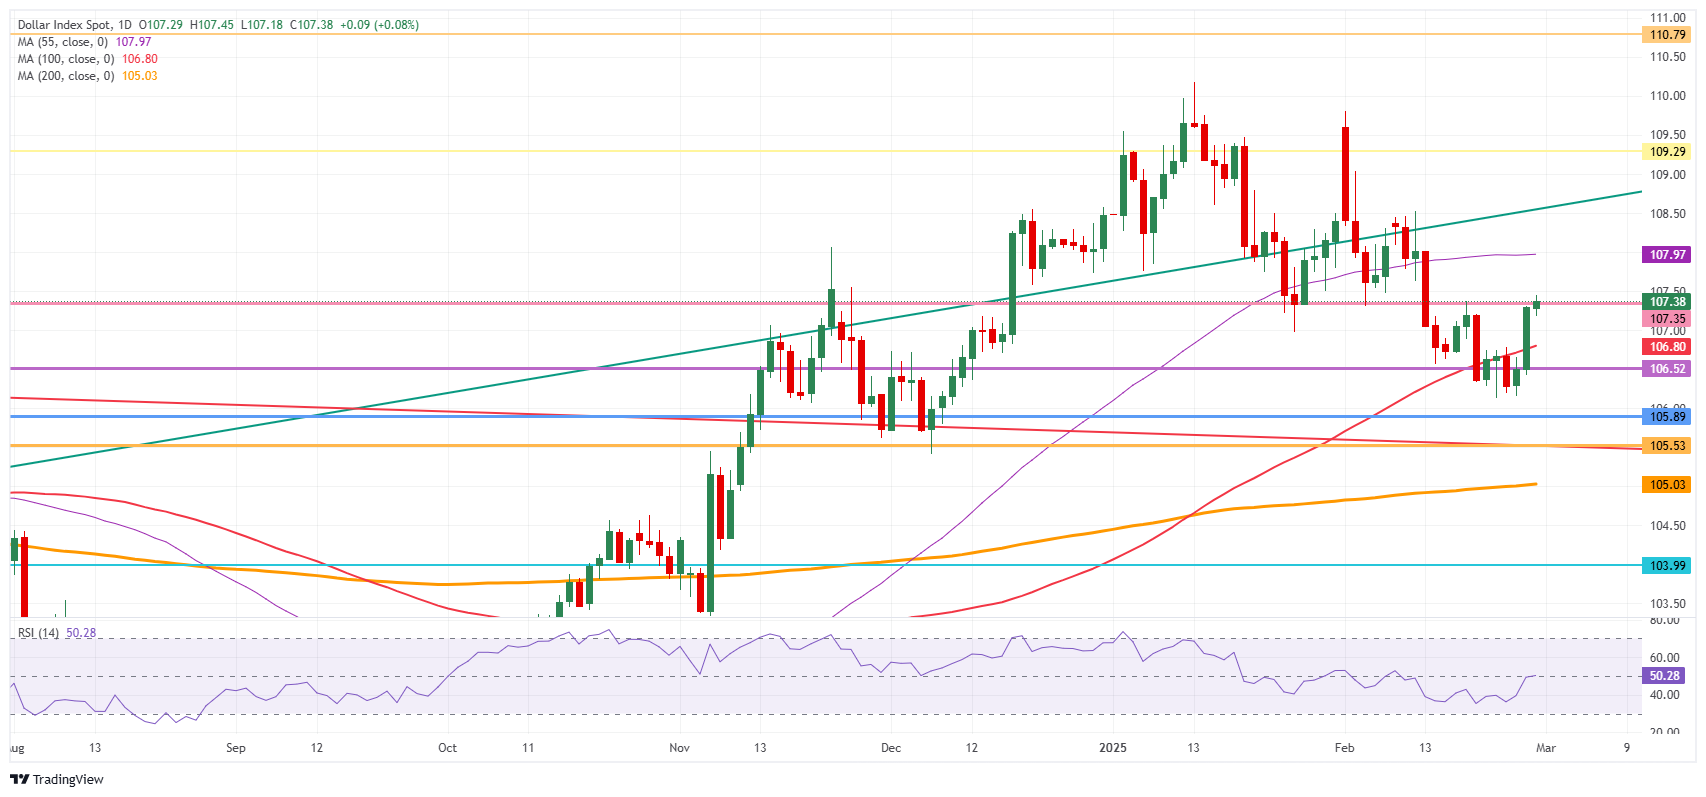
US Dollar Index: Daily Chart
US Dollar FAQs
The US Dollar (USD) is the official currency of the United States of America, and the ‘de facto’ currency of a significant number of other countries where it is found in circulation alongside local notes. It is the most heavily traded currency in the world, accounting for over 88% of all global foreign exchange turnover, or an average of $6.6 trillion in transactions per day, according to data from 2022. Following the second world war, the USD took over from the British Pound as the world’s reserve currency. For most of its history, the US Dollar was backed by Gold, until the Bretton Woods Agreement in 1971 when the Gold Standard went away.
The most important single factor impacting on the value of the US Dollar is monetary policy, which is shaped by the Federal Reserve (Fed). The Fed has two mandates: to achieve price stability (control inflation) and foster full employment. Its primary tool to achieve these two goals is by adjusting interest rates. When prices are rising too quickly and inflation is above the Fed’s 2% target, the Fed will raise rates, which helps the USD value. When inflation falls below 2% or the Unemployment Rate is too high, the Fed may lower interest rates, which weighs on the Greenback.
In extreme situations, the Federal Reserve can also print more Dollars and enact quantitative easing (QE). QE is the process by which the Fed substantially increases the flow of credit in a stuck financial system. It is a non-standard policy measure used when credit has dried up because banks will not lend to each other (out of the fear of counterparty default). It is a last resort when simply lowering interest rates is unlikely to achieve the necessary result. It was the Fed’s weapon of choice to combat the credit crunch that occurred during the Great Financial Crisis in 2008. It involves the Fed printing more Dollars and using them to buy US government bonds predominantly from financial institutions. QE usually leads to a weaker US Dollar.
Quantitative tightening (QT) is the reverse process whereby the Federal Reserve stops buying bonds from financial institutions and does not reinvest the principal from the bonds it holds maturing in new purchases. It is usually positive for the US Dollar.
-
13:02
South Africa Trade Balance (in Rands) fell from previous 15.46B to -16.42B in January
-
13:00
India Gross Domestic Product Quarterly (YoY) below expectations (6.3%) in 4Q: Actual (6.2%)
-
12:33
WTI retreats from $70 as Trump threatens additional 10% tariff on China
- The Oil price falls back from $70.00 as fresh Trump’s tariff threats have raised concerns over China’s economic growth.
- Trump announced additional 10% tariffs on China for pouring fentanyl into the US economy.
- Investors await US Trump’s meet with Ukrainian Zelenskyy on minerals deal.
West Texas Intermediate (WTI), futures on NYMEX, falls back to near $69.20 in European trading hours on Friday. The Oil price rebounded to near $70.00 on Thursday after recovering from a fresh two-month low around $68.30, which it posted on Wednesday.
The Oil price faces sharp selling pressure as fresh tariff threats from United States (US) President Donald Trump have escalated global growth concerns. On Thursday, Trump communicated in his tweet on Truth.Social that he is poised to impose additional 10% tariffs on China. Trump clarified that drugs pouring into the US economy through the borders of Canada and Mexico are majorly in the form of fentanyl, which is made in and supplied by China.
The imposition of additional import duties on China by the US is expected to make Chinese products less competitive in the global market. Such a scenario indicates a weak Oil demand outlook, given that China is the largest importer of Oil in the world.
President Donald Trump has also confirmed that Canada and Mexico will face 25% tariffs on March 4.
Meanwhile, growing optimism over peace in the war between Russia and Ukraine has already kept the Oil price on the back foot. Investors await Donald Trump’s meeting with Ukrainian leader Volodymyr Zelenskyy over the minerals deal on Friday. They are also expected to discuss terms for peace in Ukraine. Positive developments over peace between Russia and Ukraine would be an unfavorable scenario for the Oil price, assuming that the Eurozone and the US will revoke sanctions on Russia, which will result in an increase in seaborne oil flows into the global market.
WTI Oil FAQs
WTI Oil is a type of Crude Oil sold on international markets. The WTI stands for West Texas Intermediate, one of three major types including Brent and Dubai Crude. WTI is also referred to as “light” and “sweet” because of its relatively low gravity and sulfur content respectively. It is considered a high quality Oil that is easily refined. It is sourced in the United States and distributed via the Cushing hub, which is considered “The Pipeline Crossroads of the World”. It is a benchmark for the Oil market and WTI price is frequently quoted in the media.
Like all assets, supply and demand are the key drivers of WTI Oil price. As such, global growth can be a driver of increased demand and vice versa for weak global growth. Political instability, wars, and sanctions can disrupt supply and impact prices. The decisions of OPEC, a group of major Oil-producing countries, is another key driver of price. The value of the US Dollar influences the price of WTI Crude Oil, since Oil is predominantly traded in US Dollars, thus a weaker US Dollar can make Oil more affordable and vice versa.
The weekly Oil inventory reports published by the American Petroleum Institute (API) and the Energy Information Agency (EIA) impact the price of WTI Oil. Changes in inventories reflect fluctuating supply and demand. If the data shows a drop in inventories it can indicate increased demand, pushing up Oil price. Higher inventories can reflect increased supply, pushing down prices. API’s report is published every Tuesday and EIA’s the day after. Their results are usually similar, falling within 1% of each other 75% of the time. The EIA data is considered more reliable, since it is a government agency.
OPEC (Organization of the Petroleum Exporting Countries) is a group of 12 Oil-producing nations who collectively decide production quotas for member countries at twice-yearly meetings. Their decisions often impact WTI Oil prices. When OPEC decides to lower quotas, it can tighten supply, pushing up Oil prices. When OPEC increases production, it has the opposite effect. OPEC+ refers to an expanded group that includes ten extra non-OPEC members, the most notable of which is Russia.
-
12:31
India Infrastructure Output (YoY): 4.6% (January) vs 4%
-
12:30
India FX Reserves, USD increased to $640.48B in February 17 from previous $635.72B
-
12:21
CAD: US tariff threat raises BOC rate cut bets – BBH
USD/CAD surged almost 1% as US tariff threat raised Bank of Canada (BOC) rate cut bets, BBH's FX analysts report.
Canada's business investment is expected to remain subdued
"Markets price-in over 50% odds of a 25bps BOC policy rate cut in March and a total of 60bps of easing over the next 12 months vs. 40bps earlier this week. We expect the BoC to pause easing at its next March 12 meeting in part because core inflation (average of trim and median CPI) is tracking above the BOC’s Q1 projection of 2.5%."
"Canada monthly and quarterly GDP data are due today. Statistics Canada advance information indicates that real GDP by industry increased 0.2% m/m after falling -0.2% in November. The January GDP estimate will be published at the same time."
"Over Q4, the Bank of Canada (BOC) projects real GDP by expenditure at 1.8% SAAR vs. 1.0% in Q3 driven by consumer spending, residential investment, and net exports. Business investment is expected to remain subdued while inventory destocking is forecast to be the main drag to growth in Q4."
-
12:18
India Federal Fiscal Deficit, INR climbed from previous 9140.89B to 11695.42B in January
-
12:15
BOJ to hike policy rate to 1.00% over the next two years – BBH
USD/JPY rallied above 150.00, BBH's FX analysts report.
BoJ normalization cycle to continue
"Tokyo February CPI inflation cools more than anticipated and supports the case for a gradual Bank of Japan normalization cycle. Headline CPI and core ex-fresh food inflation eased to 2.9% y/y (consensus: 3.2%, prior: 3.4%) and 2.2% y/y (consensus: 2.3%, prior: 2.5%). Core ex-fresh food and energy remained at 1.9% y/y (consensus: 2.0%, prior: 1.9%)."
"The market continues to imply about 50bps of BOJ policy rate hikes over the next two years to 1.00% which limits JPY upside."
-
12:11
USD/CNH: A small chance of testing 7.3100 in short term – UOB Group
US Dollar could test 7.3100 vs Chinese Yuan; a sustained break above this level seems unlikely. In the longer run, strong advance indicates there is potential for USD to rise to 7.3250, UOB Group’s FX analysts Quek Ser Leang and Peter Chia note.
There is potential for USD to rise to 7.3250
24-HOUR VIEW: "When USD was at 7.2640 yesterday, we indicated that 'the current price movements are likely part of a range trading phase, probably between 7.2530 and 7.2750.' USD traded within our expected range until the NY session, when it lifted off and surged to a high of 7.3016. Conditions are deeply overbought, but provided that 7.2770 (minor support is at 7.2850) is not breached, USD could test 7.3100. A sustained break above this level seems unlikely today, and the major resistance at 7.3250 is also unlikely to come under trade."
1-3 WEEKS VIEW: "We revised our USD view from negative to neutral yesterday (27 Feb, spot at 7.2640), indicating that 'downward momentum has largely faded.' We also indicated that USD 'has likely entered a range trading phase and is expected to trade between 7.2400 and 7.2900 for the time being.' The subsequent strong advance indicates there is potential for USD to rise to 7.3250. The upside risk will remain intact as long as USD does not break below the ‘strong support’ level, currently at 7.2600."
-
12:08
USD/JPY: Downward momentum is slowing – UOB Group
US Dollar (USD) is expected to trade in a 148.80/150.20 range. In the longer run, downward momentum is slowing; a breach of 150.20 would mean the weakness in USD has stabilised, UOB Group’s FX analysts Quek Ser Leang and Peter Chia note.
Weakness in USD has stabilised
24-HOUR VIEW: "We indicated yesterday that the price movements in USD 'are likely part of a range trading phase, probably between 148.55 and 149.75.' We did not anticipate the volatile price action as USD fluctuated between 148.73 and 150.17. The choppy movements have resulted in a mixed outlook. Today, we expect USD to trade in a 148.80/150.20 range."
1-3 WEEKS VIEW: "We have been expecting a lower USD since the middle of the month. In our latest narrative from two days ago (26 Feb, spot at 149.15), we highlighted that 'although the USD weakness from early last week has not stabilised, oversold conditions suggest the pace of any further decline is likely to be slower.' We added, 'only a breach of 150.20 (‘strong resistance’ level) would indicate that the weakness has stabilised.' Yesterday, USD traded choppily, touching a high of 150.17. Downward momentum is slowing, and if USD breaks above 150.20, it would mean that the weakness has stabilised."
-
12:04
NZD/USD: The 0.5590 level is likely out of reach for now – UOB Group
Although deeply oversold, New Zealand Dollar (NZD) could decline further, but 0.5590 is likely out of reach for now. In the longer run, NZD could weaken further; the level to monitor is 0.5590, UOB Group’s FX analysts Quek Ser Leang and Peter Chia note.
NZD can weaken further
24-HOUR VIEW: "After NZD fell to a low of 0.5689 on Wednesday, we indicated yesterday (Thursday) that it 'could decline further.' However, we noted that NZD 'does not seem to have enough momentum to break and remain below 0.5680.' However, NZD not only broke clearly below 0.5680 but also dropped further to 0.5630. Although deeply oversold, AUD could decline further. That said, the major support at 0.5590 is likely out of reach for now. On the upside, any recovery is likely to remain below 0.5665 (minor resistance is at 0.5645)."
1-3 WEEKS VIEW: "Yesterday (27 Feb, spot at 0.5700), we highlighted that 'downward momentum is beginning to build, and if NZD breaks and remains below 0.5680, it could trigger a decline to 0.5645.' We did not quite expect NZD to easily break below both 0.5680 and 0.5645. The price action suggests further NZD weakness, and the level to monitor is 0.5590. Overall, the downward pressure would remain intact as long as NZD does not break above 0.5685 (‘strong resistance’ level was at 0.5755 yesterday)."
-
12:01
Ireland Retail Sales (YoY) dipped from previous 0.8% to -0.3% in January
-
12:01
Ireland Retail Sales (MoM): -0.5% (January) vs previous 1.1%
-
12:00
Portugal Gross Domestic Product (QoQ) in line with forecasts (1.5%) in 4Q
-
12:00
Portugal Gross Domestic Product (YoY) registered at 2.8% above expectations (2.7%) in 4Q
-
11:55
Gold plummets near 3% from all-time high on Trump’s tariffs coming into effect
- US President Trump confirmed overnight that Mexico and Canada tariffs will go into effect on March 4.
- Panic hits markets with equities, cryptos and Gold selling across the globe, while safe-haven bonds are bid.
- The precious metal is no longer considered to be a tariff safe haven for now although US yields are dropping off further.
Gold’s price (XAU/USD) sees losses accelerate going into Friday with a near 3% loss since it printed a new all-time high at $2,956 on Monday. The precious metal currently trades at $2,860 at the time of writing, after United States (US) President Donald Trump reiterated that tariffs for Mexico and Canada will start on March 4, while China will see an additional 10%, raising the total rates to20% on imports into the US. This dampens hopes markets still had for a possible delay in the implementation of these tariffs.
Meanwhile, China is set to retaliate and it is ready to hit back at Trump’s trade tariffs, raising the risk of a tit-for-tat trade war between the two big economies. “If the US insists on having its own way, China will counter with all necessary measures to defend its legitimate rights and interests,” a spokesperson for the Chinese Ministry of Commerce said this Friday.
Daily digest market movers: March is just around the corner
- Gold ETF’s (Exchange Traded Fund) are the sweet spot in China this year. Funds are swelling as the metal sets records, investors seek alternative assets, and local rules are tweaked to allow greater access. Onshore fund holdings increased by 17.7 tons in the first three weeks of February, close to the monthly record inflow of 20.9 tons set last October, according to data from the producer-funded World Gold Council, Bloomberg reports.
- In early European trading, the risk-off mood this Friday is seeing deep losses with indices in Asia booking multiple percentage losses near their closing bell. European ones are facing losses of over 1% intraday.
- The CME Fedwatch Tool sees chances for a June rate cut increase even further than Thursday. Odds are growing to a 71.8% chance approx for a rate cut against only 28.1% for keeping rates unchanged.
Technical Analysis: Look for the stops
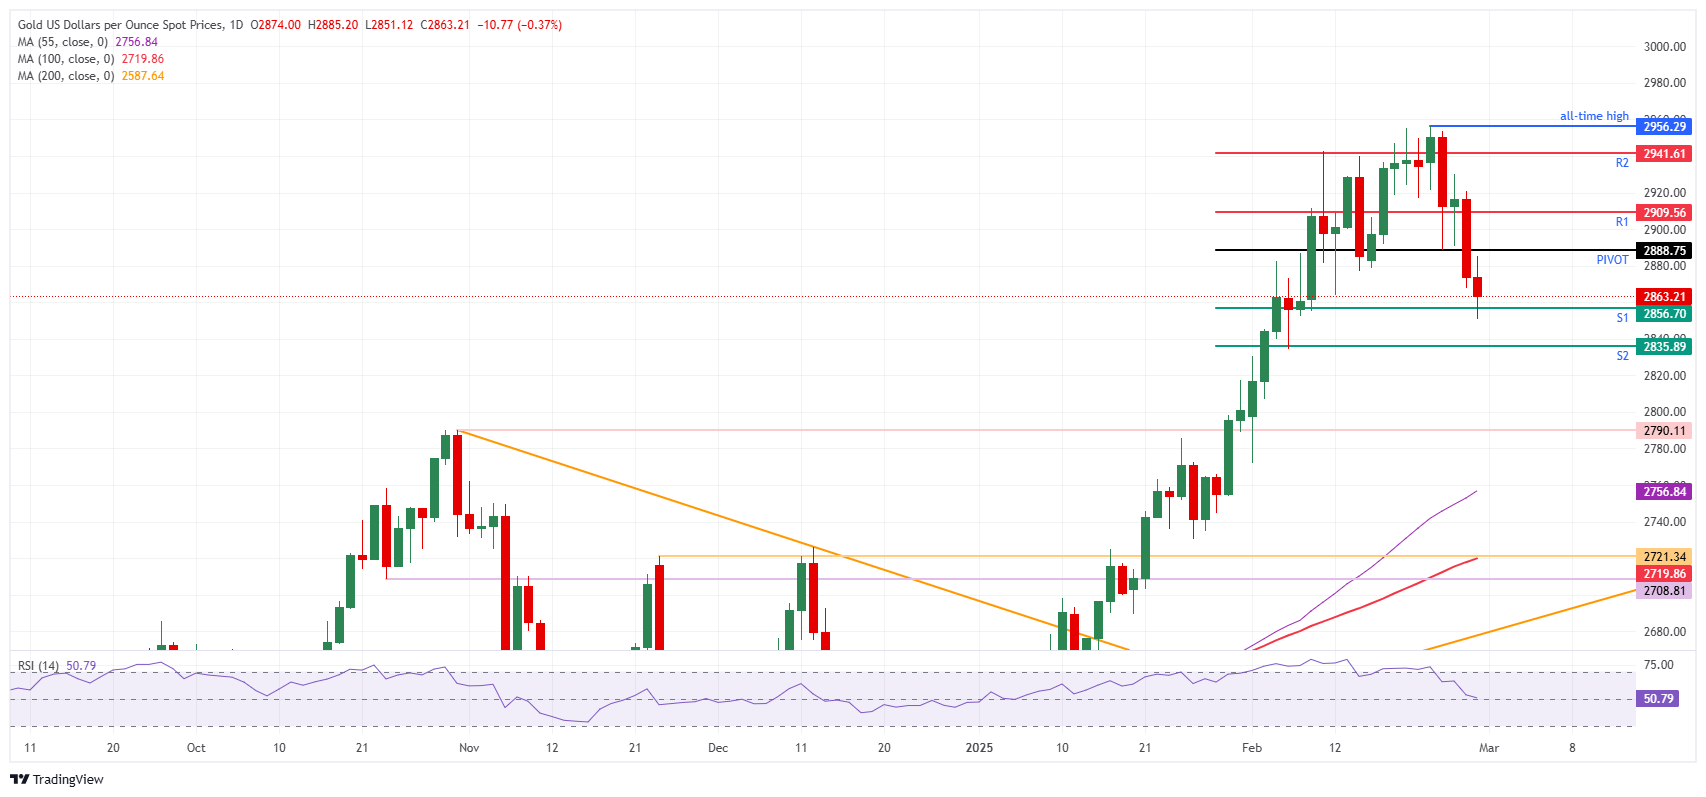
The signs projected earlier this week are being proven right on Friday, with a near 3% loss in the precious metal so far this week. However, the fundamentals still look good for more upside in Gold, with tariffs still being a main theme and not just a one-off event. Look to support levels such as $2,790 to be ready and buy back in large amounts to participate in the next rally.
On the upside, the daily Pivot Point at $2,888 is the main level to look out for as resistance in the short term. That is just below the $2,900 big figure, and the daily R1 resistance at $2,909 is also in place. Thus, some chunky resistance makes recovering back to R2 resistance at $2,941 nearly impossible this Friday.
On the downside, vigilant Bullion buyers will surely be happy to pick up some Gold at interesting support levels. The S1 support at $2,856 looks rather feeble for now. Look to S2 support at $2,835 for broad support, ahead of $2,800 round level and $2,790. Indeed, that last level should see many buy orders waiting to be filled.
XAU/USD: Daily Chart
Gold FAQs
Gold has played a key role in human’s history as it has been widely used as a store of value and medium of exchange. Currently, apart from its shine and usage for jewelry, the precious metal is widely seen as a safe-haven asset, meaning that it is considered a good investment during turbulent times. Gold is also widely seen as a hedge against inflation and against depreciating currencies as it doesn’t rely on any specific issuer or government.
Central banks are the biggest Gold holders. In their aim to support their currencies in turbulent times, central banks tend to diversify their reserves and buy Gold to improve the perceived strength of the economy and the currency. High Gold reserves can be a source of trust for a country’s solvency. Central banks added 1,136 tonnes of Gold worth around $70 billion to their reserves in 2022, according to data from the World Gold Council. This is the highest yearly purchase since records began. Central banks from emerging economies such as China, India and Turkey are quickly increasing their Gold reserves.
Gold has an inverse correlation with the US Dollar and US Treasuries, which are both major reserve and safe-haven assets. When the Dollar depreciates, Gold tends to rise, enabling investors and central banks to diversify their assets in turbulent times. Gold is also inversely correlated with risk assets. A rally in the stock market tends to weaken Gold price, while sell-offs in riskier markets tend to favor the precious metal.
The price can move due to a wide range of factors. Geopolitical instability or fears of a deep recession can quickly make Gold price escalate due to its safe-haven status. As a yield-less asset, Gold tends to rise with lower interest rates, while higher cost of money usually weighs down on the yellow metal. Still, most moves depend on how the US Dollar (USD) behaves as the asset is priced in dollars (XAU/USD). A strong Dollar tends to keep the price of Gold controlled, whereas a weaker Dollar is likely to push Gold prices up.
-
11:45
USD/CNH: Trump 2.0 tariff regime can be worse than Trump 1.0 one – ING
Turning to China, the extra 10% tariff next Tuesday is an aggressive surprise and follows a 10% across-the-board increase in tariffs on 4 February, ING’s FX analysts Chris Turner notes.
Weaker CNH to keep the EMFX complex on the backfoot.
"If it goes through, the new tariff regime could potentially be worse than anything seen under Trump 1.0. There is clearly a powerplay at work here, where President Trump speaks to a joint session of Congress on Tuesday, the day before Chinese Premier Li delivers the Government Work Report at the Two Sessions gathering."
"These tariffs look more ideological than transactional and could potentially trigger a sharper response from Beijing. It is not our baseline view, but speculation may resurface that China will allow a weaker currency after all."
"Expect more attention on USD/CNH now and we have seen the three-month risk reversal - the price of a USD/CNH call option over an equivalent USD/CNH put option - rise back towards early February highs. The threat of a weaker renminbi can keep the majority of the EMFX complex on the backfoot."
-
11:28
Pound Sterling edges higher as BoE seems to follow moderate policy-easing cycle
- The Pound Sterling gains marginally against its peers on a broader note as investors expect the BoE to follow a slower policy-easing cycle this year.
- US President Trump proposes an additional 10% tariffs on China.
- Investors await the US PCE inflation data that will influence the Fed’s policy outlook.
The Pound Sterling (GBP) ticks higher broadly against its major peers on Friday as investors expect the Bank of England’s (BoE) monetary easing cycle to be more moderate this year than other central bankers from major economies. Traders have fully priced in two interest rate cuts by the BoE. On the contrary, the European Central Bank (ECB) is expected to cut interest rates thrice and the Federal Reserve (Fed) is anticipated to reduce them by 60 basis points (bps).
Market participants have been expecting a slower BoE policy easing cycle due to strong wage growth. Average Earnings Excluding bonuses in three months ending December accelerated to 5.9%, the highest level seen since April 2024.
BoE Deputy Governor Dave Ramsden also said in his speech at Stellenbosch University in South Africa during early European trading hours on Friday that wage growth is “stronger than he expected”. However, Ramsden remained confident that the “core disinflationary process remains intact”. On the global front, he said it is difficult to ascertain whether the impact of United States (US) President Donald Trump’s tariffs will be “inflationary or deflationary” for the economy.
Meanwhile, the meeting between United Kingdom (UK) Prime Minister Keir Starmer and the US President on Thursday concluded without a deal. However, Trump said there was "a very good chance" of a trade deal "where tariffs wouldn't be necessary." Trump added that such a deal could be made "pretty quickly," BBC reported.
Daily digest market movers: Pound Sterling underperforms US Dollar
- The Pound Sterling slightly extends its downside move to near 1.2570 against the US Dollar (USD) in Friday’s European session. The GBP/USD pair faces pressure as the US Dollar gains further amid a risk-off market mood. The US Dollar Index (DXY), which tracks the Greenback’s value against six major currencies, moves higher to 107.45.
- Market participants are cautious as President Donald Trump has announced more levies on China and provided more clarification on the timeline for 25% import duties on Canada and Mexico and reciprocal tariffs.
- In his tweet at Truth Social on Thursday, Trump said that 25% tariffs on Canada and Mexico will come into effect on March 4. His tweet confirmed that he is not providing an additional month-long extension to his North American allies as “drugs are still pouring” into the economy. Trump announced an additional 10% levy on China, arguing that drugs entering the US are in the form of fentanyl, which is made in and supplied by China. He added that reciprocal tariffs could come into full force and effect on April 2.
- Investors see Trump’s fresh tariff threats as a critical escalation in the global trade war that could lead to an economic slowdown across the globe.
- On the domestic front, investors await the US Personal Consumption Expenditure Price Index (PCE) data for January, which will be published at 13:30 GMT. Economists expect the US core PCE inflation – which excludes volatile food and energy prices – to have decelerated to 2.6% year-over-year from 2.8% in December. Month-on-month inflation data is estimated to have grown by 0.3%, faster than the former reading of 0.2%.
- Investors will pay close attention to the US core PCE inflation data as it is the Federal Reserve’s (Fed) preferred inflation gauge. These figures will influence market expectations for the central bank’s monetary policy outlook.
Technical Analysis: Pound Sterling struggles around 38.2% Fibo retracement at 1.2620
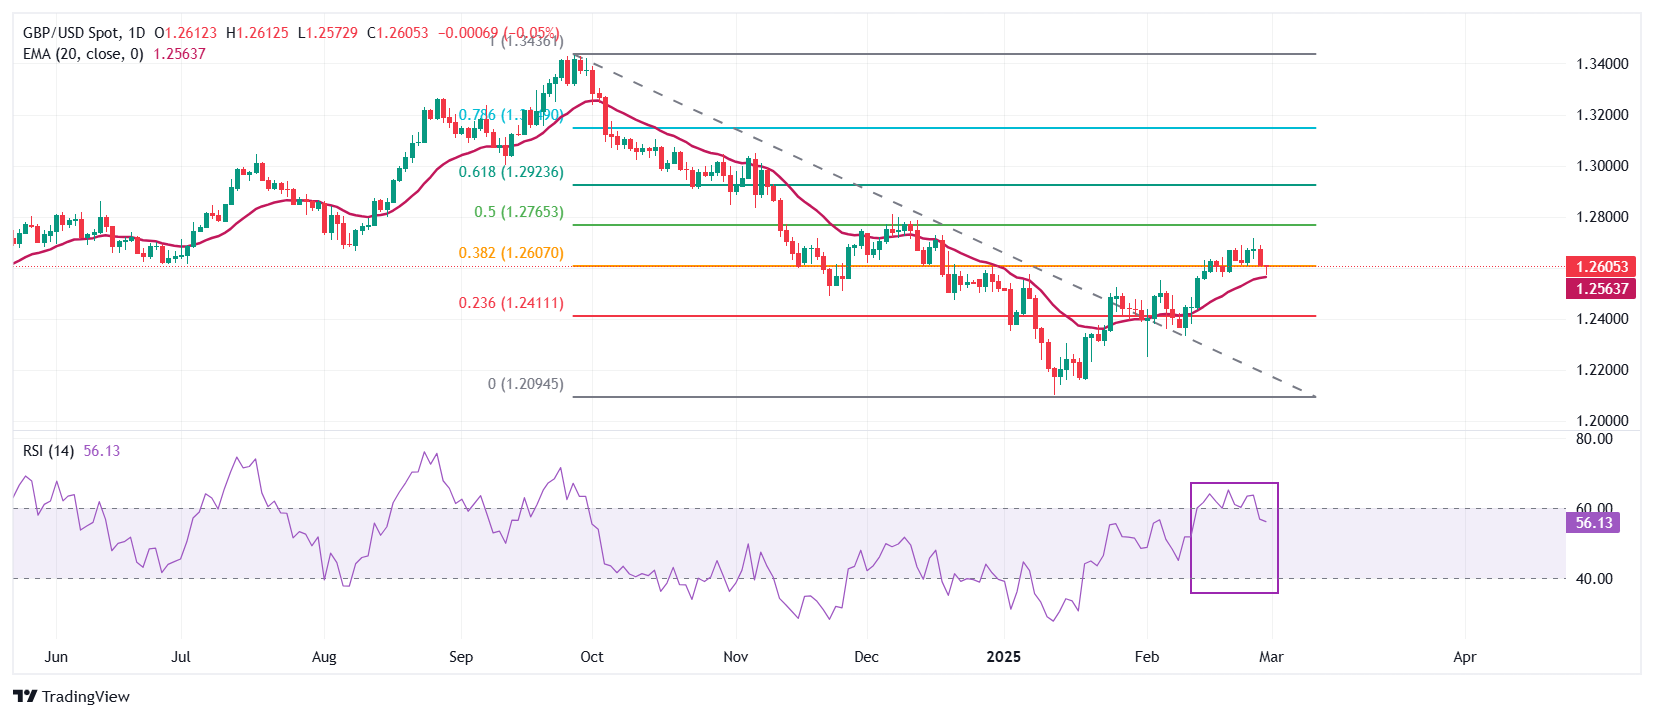
The Pound Sterling struggles to hold above the 38.2% Fibonacci retracement from the end-September high to the mid-January low downtrend against the US Dollar around 1.2610 on Friday. The 20-day Exponential Moving Average (EMA) near 1.2560 continues to provide support to the pair.
The 14-day Relative Strength Index (RSI) falls back down within the 40.00-60.00 range, suggesting that the bullish momentum has concluded for now. However, the positive bias remains intact.
Looking down, the February 11 low of 1.2333 will act as a key support zone for the pair. On the upside, the 50% Fibonacci retracement at 1.2765 will act as a key resistance zone.
Pound Sterling FAQs
The Pound Sterling (GBP) is the oldest currency in the world (886 AD) and the official currency of the United Kingdom. It is the fourth most traded unit for foreign exchange (FX) in the world, accounting for 12% of all transactions, averaging $630 billion a day, according to 2022 data. Its key trading pairs are GBP/USD, also known as ‘Cable’, which accounts for 11% of FX, GBP/JPY, or the ‘Dragon’ as it is known by traders (3%), and EUR/GBP (2%). The Pound Sterling is issued by the Bank of England (BoE).
The single most important factor influencing the value of the Pound Sterling is monetary policy decided by the Bank of England. The BoE bases its decisions on whether it has achieved its primary goal of “price stability” – a steady inflation rate of around 2%. Its primary tool for achieving this is the adjustment of interest rates. When inflation is too high, the BoE will try to rein it in by raising interest rates, making it more expensive for people and businesses to access credit. This is generally positive for GBP, as higher interest rates make the UK a more attractive place for global investors to park their money. When inflation falls too low it is a sign economic growth is slowing. In this scenario, the BoE will consider lowering interest rates to cheapen credit so businesses will borrow more to invest in growth-generating projects.
Data releases gauge the health of the economy and can impact the value of the Pound Sterling. Indicators such as GDP, Manufacturing and Services PMIs, and employment can all influence the direction of the GBP. A strong economy is good for Sterling. Not only does it attract more foreign investment but it may encourage the BoE to put up interest rates, which will directly strengthen GBP. Otherwise, if economic data is weak, the Pound Sterling is likely to fall.
Another significant data release for the Pound Sterling is the Trade Balance. This indicator measures the difference between what a country earns from its exports and what it spends on imports over a given period. If a country produces highly sought-after exports, its currency will benefit purely from the extra demand created from foreign buyers seeking to purchase these goods. Therefore, a positive net Trade Balance strengthens a currency and vice versa for a negative balance.
-
11:26
AUD/USD: The major support at 0.6190 could be just out of reach – UOB Group
Australian Dollar (AUD) could continue to decline vs US Dollar (USD), but the major support at 0.6190 could be just out of reach. In the longer run, further AUD declines seem likely; the level to monitor is 0.6190, UOB Group’s FX analysts Quek Ser Leang and Peter Chia note.
Further AUD declines seem likely
24-HOUR VIEW: "While we pointed out yesterday that 'the risk for AUD is on the downside,' we were of the view that 'any decline may not break the major support at 0.6280.' AUD then dropped but held above 0.6280 until the NY session when it plunged to 0.6232. Today, AUD could continue to decline, but the major support at 0.6190 could be just out of reach. Resistance levels are at 0.6255 and 0.6275."
1-3 WEEKS VIEW: "Yesterday, 27 Feb, when AUD was at 0.6310, we highlighted that it 'could edge lower, but it must break clearly below 0.6280 before a move to 0.6255 can be expected.' We also highlighted that 'the likelihood of AUD breaking clearly below 0.6280 will remain intact provided that the ‘strong resistance’ level at 0.6375 is not breached.' We did not expect the subsequent sharp drop that sent AUD to a low of 0.6232. Further declines seem likely, and the level to monitor is 0.6190. On the upside, the ‘strong resistance’ level has moved lower to 0.6305 from 0.6375."
-
11:20
AUD/USD slides to near 0.6200 as Trump proposes additional 10% tariffs on China
- AUD/USD refreshes three-week low near 0.6200 as US President Trump threatens to impose additional 10% tariffs on China.
- RBA Hauser supports keeping interest rates steady until he sees more progress in the disinflation trend toward the 2% target.
- Investors await the US PCE inflation as it will influence the Fed’s monetary policy outlook.
The AUD/USD pair posts a fresh three-week low near 0.6200 in European trading session after extending its losing streak for the sixth trading day on Friday. The Aussie pair was already facing pressure the entire week but sensed more pressure after United States (US) President Donald Trump threatened to impose additional 10% tariffs on China on Thursday.
US President Trump said in a tweet from his Truth.Social account that he will slap an additional 10% levy on China due to continuous flows of drugs into the economy through the borders of Canada and Mexico. Trump also confirmed that the 25% tariffs proposed for Canada and Mexico are coming into effect on March 4.
Additional import duties from the US are expected to further weigh on Chinese economic growth. Donald Trump also imposed 10% tariffs on China earlier this month. The Australian economy relies heavily on exports to China, and higher import duties by the US on the world’s second-largest economy make its products less competitive. Therefore, Trump’s tariffs have indirectly impacted the Australian Dollar (AUD), which is vulnerable to policies that weigh on demand for Chinese products.
On the monetary policy front, the Reserve Bank of Australia (RBA) is unlikely to cut interest rates again soon. RBA Deputy Governor Andrew Hauser said on Thursday that he wants to see more “positive inflation data” before considering further rate cuts.
On the US Dollar (USD) front, investors await the United States (US) Personal Consumption Expenditure Price Index (PCE) data for January, which will be published at 13:30 GMT. Investors will pay close attention to the core PCE inflation data as it is the Federal Reserve’s (Fed) preferred inflation gauge. The inflation data will influence market expectations for the Fed’s monetary policy outlook.
Australian Dollar FAQs
One of the most significant factors for the Australian Dollar (AUD) is the level of interest rates set by the Reserve Bank of Australia (RBA). Because Australia is a resource-rich country another key driver is the price of its biggest export, Iron Ore. The health of the Chinese economy, its largest trading partner, is a factor, as well as inflation in Australia, its growth rate and Trade Balance. Market sentiment – whether investors are taking on more risky assets (risk-on) or seeking safe-havens (risk-off) – is also a factor, with risk-on positive for AUD.
The Reserve Bank of Australia (RBA) influences the Australian Dollar (AUD) by setting the level of interest rates that Australian banks can lend to each other. This influences the level of interest rates in the economy as a whole. The main goal of the RBA is to maintain a stable inflation rate of 2-3% by adjusting interest rates up or down. Relatively high interest rates compared to other major central banks support the AUD, and the opposite for relatively low. The RBA can also use quantitative easing and tightening to influence credit conditions, with the former AUD-negative and the latter AUD-positive.
China is Australia’s largest trading partner so the health of the Chinese economy is a major influence on the value of the Australian Dollar (AUD). When the Chinese economy is doing well it purchases more raw materials, goods and services from Australia, lifting demand for the AUD, and pushing up its value. The opposite is the case when the Chinese economy is not growing as fast as expected. Positive or negative surprises in Chinese growth data, therefore, often have a direct impact on the Australian Dollar and its pairs.
Iron Ore is Australia’s largest export, accounting for $118 billion a year according to data from 2021, with China as its primary destination. The price of Iron Ore, therefore, can be a driver of the Australian Dollar. Generally, if the price of Iron Ore rises, AUD also goes up, as aggregate demand for the currency increases. The opposite is the case if the price of Iron Ore falls. Higher Iron Ore prices also tend to result in a greater likelihood of a positive Trade Balance for Australia, which is also positive of the AUD.
The Trade Balance, which is the difference between what a country earns from its exports versus what it pays for its imports, is another factor that can influence the value of the Australian Dollar. If Australia produces highly sought after exports, then its currency will gain in value purely from the surplus demand created from foreign buyers seeking to purchase its exports versus what it spends to purchase imports. Therefore, a positive net Trade Balance strengthens the AUD, with the opposite effect if the Trade Balance is negative.
-
11:19
USD/CAD can potentially trade at 1.48 if tariffs be implemented – ING
Markets have been here before with tariff threats and there are still four days for deals to be cut, ING’s FX analysts Chris Turner notes.
Markets continue to see downside risks to the Canadian dollar
"Turning to Canada and Mexico, it seems Mexico is most likely to cut a deal given that it's probably got the most to lose. The Mexican peso is actually holding in quite well - presumably on the view that a deal would be cut. The chances of a deal with Canada might be lower in that the beleaguered Liberal party is performing well as it stands up to the US."
"And Canada might be more resistant to being bounced out of other trade agreements, such as the CPTPP. This is an agreement with several partners in Asia, including Vietnam and may well be seen by the US as a back-door route for Chinese products to enter the US."
"We continue to see downside risks to the Canadian dollar, with USD/CAD potentially trading at 1.48 should tariffs be implemented."
-
11:07
GBP/USD: Any decline is part of a lower 1.2570/12640 range – UOB Group
Rapid drop in Pound Sterling (GBP) could extend vs US Dollar (USD); oversold conditions suggest any decline is part of a lower 1.2570/12640 range. In the longer run, two-week GBP strength has ended; for the time being, it is likely to trade between 1.2520 and 1.2670, UOB Group’s FX analysts Quek Ser Leang and Peter Chia note.
Two-week GBP strength has ended
24-HOUR VIEW: "Yesterday, we expected GBP to 'trade between 1.2640 and 1.2700.' GBP subsequently rose to 1.2689, and then in a sudden move during the NY session, plunged to 1.2598. While the rapid drop could extend, oversold conditions suggest any decline is likely part of a lower 1.2570/1.2640 range. In other words, GBP is unlikely to break clearly below 1.2570."
1-3 WEEKS VIEW: "We revised our view to positive two weeks ago on 14 Feb, when GBP was at 1.2560. Tracking the advance, we indicated yesterday (27 Feb, spot at 1.2670) that 'upward momentum has slowed further, and a breach of 1.2615 would indicate that GBP is not strengthening further.' GBP then broke below 1.2615, indicating that GBP strength has ended. The current price movements are likely part of a range trading phase. For the time being, we expected to trade between 1.2520 and 1.2670."
-
11:01
Italy Consumer Price Index (EU Norm) (MoM) in line with expectations (0.1%) in February
-
11:01
Italy Consumer Price Index (YoY) in line with forecasts (1.7%) in February
-
11:01
Italy Consumer Price Index (EU Norm) (YoY) registered at 1.7%, below expectations (1.8%) in February
-
11:01
Italy Consumer Price Index (MoM) in line with expectations (0.2%) in February
-
11:00
Greece Retail Sales (YoY) dipped from previous 1.1% to -5.4% in December
-
11:00
Greece Producer Price Index (YoY) increased to 0.3% in January from previous -0.8%
-
11:00
Belgium Gross Domestic Product (QoQ) in line with forecasts (0.2%) in 4Q
-
10:59
USD: Dominant tariff factor buoys the dollar – ING
Just as we were discussing the diminishing impact of tariff rhetoric on FX markets, President Trump yesterday emphatically delivered 4 March as the date on which tariffs would go into effect, ING’s FX analysts Chris Turner notes.
DXY can move up to 108 today.
"Financial markets have responded. The US Dollar (USD) is firmer against most currencies, equity markets are down - and down quite sharply at 3% in Japan and Korea - and bond markets have seen a little bull flattening consistent on the back of lower growth expectations."
"We are keeping one eye on the sharp fall in crypto this week. The MVDA index, a basket of the 100 largest digital assets, has fallen 20% this week. Given the prevalence of crypto across US households, any further sharp fall and the threat of broader asset market deleveraging strongly favours defensive positioning in FX."
"A soft January real spending figure and a downside surprise to the core PCE deflator could prove a mild USD negative. And we also see the January advanced trade release today. Another monthly deficit around $110-120bn should be a reminder that Trump means business as he seeks to correct the goods deficit which last year stood at a staggering $1.2tr. Given DXY is heavily weighted towards European currencies, look for a move up to 108 today. However, the yen should outperform on the crosses."
-
10:30
Silver price today: Silver falls, according to FXStreet data
Silver prices (XAG/USD) fell on Friday, according to FXStreet data. Silver trades at $31.16 per troy ounce, down 0.17% from the $31.22 it cost on Thursday.
Silver prices have increased by 7.86% since the beginning of the year.
Unit measure Silver Price Today in USD Troy Ounce 31.16 1 Gram 1.00
The Gold/Silver ratio, which shows the number of ounces of Silver needed to equal the value of one ounce of Gold, stood at 91.86 on Friday, down from 92.06 on Thursday.
Silver FAQs
Silver is a precious metal highly traded among investors. It has been historically used as a store of value and a medium of exchange. Although less popular than Gold, traders may turn to Silver to diversify their investment portfolio, for its intrinsic value or as a potential hedge during high-inflation periods. Investors can buy physical Silver, in coins or in bars, or trade it through vehicles such as Exchange Traded Funds, which track its price on international markets.
Silver prices can move due to a wide range of factors. Geopolitical instability or fears of a deep recession can make Silver price escalate due to its safe-haven status, although to a lesser extent than Gold's. As a yieldless asset, Silver tends to rise with lower interest rates. Its moves also depend on how the US Dollar (USD) behaves as the asset is priced in dollars (XAG/USD). A strong Dollar tends to keep the price of Silver at bay, whereas a weaker Dollar is likely to propel prices up. Other factors such as investment demand, mining supply – Silver is much more abundant than Gold – and recycling rates can also affect prices.
Silver is widely used in industry, particularly in sectors such as electronics or solar energy, as it has one of the highest electric conductivity of all metals – more than Copper and Gold. A surge in demand can increase prices, while a decline tends to lower them. Dynamics in the US, Chinese and Indian economies can also contribute to price swings: for the US and particularly China, their big industrial sectors use Silver in various processes; in India, consumers’ demand for the precious metal for jewellery also plays a key role in setting prices.
Silver prices tend to follow Gold's moves. When Gold prices rise, Silver typically follows suit, as their status as safe-haven assets is similar. The Gold/Silver ratio, which shows the number of ounces of Silver needed to equal the value of one ounce of Gold, may help to determine the relative valuation between both metals. Some investors may consider a high ratio as an indicator that Silver is undervalued, or Gold is overvalued. On the contrary, a low ratio might suggest that Gold is undervalued relative to Silver.
(An automation tool was used in creating this post.)
-
10:20
CAD: Starting to take the tariff threat more seriously – ING
USD/CAD rallied yesterday as Trump outlined a tariff schedule that explicitly includes duties on Canada and Mexico from 4 March, ING's FX analyst Chris Turner notes.
Upside risks to USD/CAD today
"The pair is currently embedding around 2% of risk premium, according to our short-term fair value model. That is above the 1.5 standard deviation, but still well below the nearly 4% peak risk premium that was embedded in USD/CAD on 3 February."
"Back then, we published a note to discuss our view on CAD under the assumption that 25% tariffs would go ahead. Most of those considerations stand, and depending on how long tariffs remain in place, a move to 1.50 is a definite possibility. The difference this time is that markets are treating Trump’s tariff threat with more scepticism, refusing to price in the full tariff effect and partly betting on another last minute deal."
"We still see upside risks to USD/CAD today unless there are any reports of a de-escalation. We see 1.45 as the level that would mark a shift to markets pricing in the tariff risk as a base case. If duties are levied on Tuesday, then we’ll look at 1.480 as the key resistance to be tested."
-
10:14
USD/CNH: Break below 7.22 can lead to deeper downtrend – Societe Generale
USD/CNH has experienced a gradual decline after facing strong resistance at graphical level of 7.37 representing highs of 2022/2023, Societe Generale's FX analysts report.
Inability to overcome 7.37 denotes risk of a down move
"It has revisited the 200-DMA near 7.22 which is an interim support. A brief bounce is taking shape but inability to overcome 7.37 could denote risk of persistence in down move. Break below 7.22 can lead to deeper downtrend towards next projections of 7.19 and 7.16."
-
10:08
GBP: PM Starmer performs well in Washington – ING
The continued measure of UK PM Keir Starmer's relatively warm relationship with Donald Trump can be marked by the fact that when tariff noise picks up, EUR/GBP trades lower, ING's FX analyst Chris Turner notes.
GBP/USD can go all the way back to 1.22/23
"Whether the UK and the US can secure a new trade deal remains to be seen, but certainly the UK is less exposed to tariffs than its European counterparts. It is hard to argue against EUR/GBP testing major lows at 0.8225 next week."
"We are bearish on GBP/USD, however. And later in March, the refocus on the domestic UK story - and probable government spending cuts - could send GBP/USD all the way back to 1.22/23."
-
10:06
EUR/USD: Significant support at 1.0330 is unlikely to come into view – UOB Group
Steep decline appears to be excessive, but Euro (EUR) could test 1.0375 vs US Dollar (USD); significant support at 1.0330 is unlikely to come into view. In the longer run, EUR could continue to decline; it is currently unclear whether the significant support at 1.0330 is within reach, UOB Group's FX analysts Quek Ser Leang and Peter Chia note.
EUR may continue to decline
24-HOUR VIEW: "Two days ago, EUR popped to a high of 1.0528, and then pulled back. Yesterday, when EUR was at 1.0485, we noted that 'the brief advance did not result in a significant increase in momentum,' and we expected EUR to 'trade in a 1.0465/1.0515 range.' Instead of trading in a range, EUR sold off sharply and closed at a two-week low of 1.0397, lower by 0.82%. The steep decline appears to be excessive, but with no signs of stabilisation just yet, EUR could test the 1.0375 level. The significant support at 1.0330 is unlikely to come into view. To sustain the oversold momentum, EUR must remain below 1.0440 (minor resistance is at 1.0420)."
1-3 WEEKS VIEW: "Yesterday (27 Feb, spot at 1.0485), we cautioned that “unless EUR breaks and holds above 1.0530 within these 1-2 days, the likelihood of it rising further will diminish.” We also highlighted that “a breach of 1.0440 (‘strong support’ level) would suggest that EUR has entered a range trading phase.” EUR subsequently broke below 1.0440 and plunged. The rapid increase in downward momentum suggests that instead of trading in a range, EUR could continue to decline. However, it is currently unclear whether the major support at 1.0330 is within reach. To keep the momentum going, EUR must remain below 1.0470 (‘strong resistance’ level)."
-
10:05
Italy Trade Balance non-EU down to €0.252B in January from previous €7.79B
-
10:04
Spain Current Account Balance up to €1.3B in December from previous €1.26B
-
10:03
Germany Hesse CPI (YoY): 2.3% (February) vs previous 2.5%
-
10:03
Germany Hesse CPI (MoM): 0.3% (February) vs 0.1%
-
10:03
EUR: Tariff threat dominates – ING
The emphatic nature of the tariff threat has proved a wake-up call for EUR/USD and traded volatility prices have jumped, ING's FX analyst Chris Turner notes.
A move below 1.0370 opens up 1.0330 and 1.0280
"We were never in the camp arguing that a global trade war had been fully factored into global FX markets and retain a view that EUR/USD can move to the 1.00/1.02 area in the second quarter as tariffs come in more broadly and the ECB cuts the deposit rate to 1.75%."
"We have been here before though. And any news of Canada and Mexico cutting a deal with Washington could see yesterday's EUR/USD losses turning around. But for the time being, the threat of tariffs and their impact on global growth is euro negative. And we expect investors to be adopting more defensive positions into next Tuesday's event risk."
"We see a short term window for EUR/USD to move lower and think that 1.0400/0420 intra-day resistance can hold and a move below 1.0370 opens up 1.0330 and potentially even 1.0280 ahead of next Tuesday."
-
10:01
Germany North Rhine-Westphalia CPI (MoM): 0.4% (February) vs -0.1%
-
10:00
Germany North Rhine-Westphalia CPI (YoY): 1.9% (February) vs previous 2%
-
10:00
Germany Baden-Wuerttemberg CPI (YoY) increased to 2.5% in February from previous 2.3%
-
10:00
Germany Baden-Wuerttemberg CPI (MoM) rose from previous -0.2% to 0.5% in February
-
10:00
Germany Brandenburg CPI (MoM) increased to 0.6% in February from previous 0%
-
10:00
Germany Saxony CPI (YoY) dipped from previous 2.4% to 2.3% in February
-
10:00
Germany Saxony CPI (MoM) climbed from previous -0.4% to 0.3% in February
-
10:00
Germany Brandenburg CPI (YoY): 2.3% (February)
-
10:00
Germany Bavaria CPI (YoY) dipped from previous 2.5% to 2.4% in February
-
10:00
Germany Bavaria CPI (MoM) rose from previous -0.3% to 0.4% in February
-
09:55
Germany Unemployment Rate s.a. meets expectations (6.2%) in January
-
09:55
Germany Unemployment Change came in at 5K below forecasts (15K) in January
-
09:43
EUR/USD faces pressure on fresh US Dollar strength
- EUR/USD trades with caution around 1.0400 as the US Dollar strengthened after US President Trump confirmed tariffs on his North American partners and China on Thursday.
- Tariffs on Canada and Mexico, and an additional 10% levy on China to go into effect on March 4, reciprocal tariffs on April 2.
- Investors await preliminary German inflation data for February and the US PCE inflation for January.
EUR/USD trades cautiously after sliding to near the key support of 1.0400 in the European trading session on Friday. The major currency pair faces selling pressure as fresh tariff threats from United States (US) President Donald Trump have increased the appeal of safe-haven assets, such as the US Dollar (USD). The US Dollar Index (DXY), which tracks the Greenback’s value against six major currencies, extends its Thursday’s strong upward move to near 107.40.
On Thursday, President Trump communicated from his account on Truth Social that 25% tariffs on Canada and Mexico are “coming into effect on March 4“ as “drugs are still pouring” into the economy from the borders of his North American allies. Trump also threatened to impose an “additional 10% levy on China” on the same date as a large percentage of drugs entering the US is in the form of fentanyl, which is made in and supplied by China. Additionally, Donald Trump said he is poised to introduce reciprocal tariffs on April 2.
Market experts believe that Trump’s tariff agenda will be pro-growth and inflationary for the US economy. Such a scenario would compel Federal Reserve (Fed) officials to maintain a restrictive monetary policy stance.
On Thursday, Philadelphia Fed Bank President Patrick Harker supported maintaining interest rates in the current range of 4.25%-4.50%. Harker said that he believes the current level is optimal for bringing inflation back to the 2% target without harming the labor market and economic growth.
To know the current status of inflation, investors await the US Personal Consumption Expenditures Price Index (PCE) data for January, which will be published at 13:30 GMT. Economists expect the core PCE inflation, which is the Fed’s preferred inflation gauge, to have decelerated to 2.6% from 2.8% in December.
Daily digest market movers: EUR/USD is on backfoot ahead of German inflation
- EUR/USD stays under pressure ahead of the preliminary inflation data of Germany and its six states for February, which will be published during the European session. Investors await the inflation data as it will influence market expectations for the European Central Bank’s (ECB) monetary policy outlook.
- According to market expectations, inflationary pressures slowed in February. This scenario would strengthen speculation that the ECB will cut interest rates again in the next policy meeting on Thursday.
- According to a February 19-27 Reuters poll, the ECB is certain to cut its Deposit Facility rate by 25 basis points (bps) to 2.5%. This would be the fifth interest rate cut by the central bank in a row. Dovish votes on the poll were based on fears that President Donald Trump’s tariff agenda will damage the Eurozone economic growth.
- On Wednesday, President Trump threatened to impose tariffs on the Eurozone. Trump said the tariffs will be announced “very soon,” and it will be 25% on “cars and other things”. The German economy is expected to be the major victim of a trade war between the Eurozone and the US, being the fourth largest trading partner of the country.
- The Reuters poll also showed that respondents were confident that the ECB would cut interest rates twice more by the middle of the year.
- Meanwhile, German Retail Sales for January have come in higher than expected. The retail sales data, a key measure of consumer spending, rose by 0.2% in the month while it was expected to remain flat. In December, the consumer spending measure contracted by 1.6%. On a yearly basis, Retail Sales rose at a faster pace of 2.9% compared to the 1.8% growth seen in December.
Technical Analysis: EUR/USD breaks below 20-day EMA
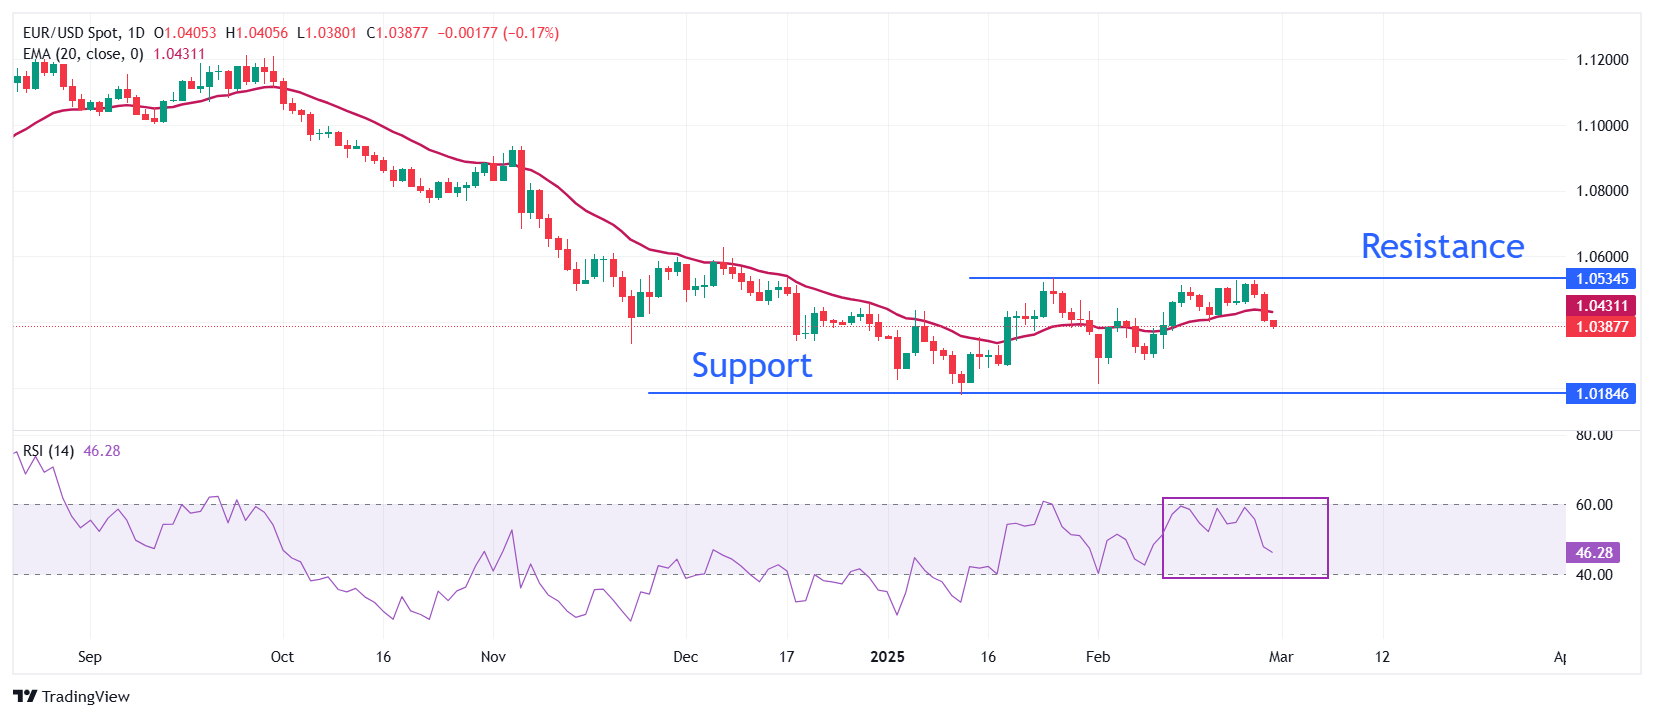
EUR/USD faces strong selling pressure after breaking on Thursday the tight consolidation range of 1.0450-1.0530, in which it has been trading since February 21. The major currency pair extends its downside below the 20-day Exponential Moving Average (EMA), which stands around 1.0430, suggesting that the near-term trend has turned bearish.
The 14-day Relative Strength Index (RSI) declines toward 40.00. A bearish momentum would activate if the RSI falls below that level.
Looking down, the February 10 low of 1.0285 will act as the major support zone for the pair. Conversely, the February 24 high of 1.0530 will be the key barrier for the Euro bulls.
Euro FAQs
The Euro is the currency for the 19 European Union countries that belong to the Eurozone. It is the second most heavily traded currency in the world behind the US Dollar. In 2022, it accounted for 31% of all foreign exchange transactions, with an average daily turnover of over $2.2 trillion a day. EUR/USD is the most heavily traded currency pair in the world, accounting for an estimated 30% off all transactions, followed by EUR/JPY (4%), EUR/GBP (3%) and EUR/AUD (2%).
The European Central Bank (ECB) in Frankfurt, Germany, is the reserve bank for the Eurozone. The ECB sets interest rates and manages monetary policy. The ECB’s primary mandate is to maintain price stability, which means either controlling inflation or stimulating growth. Its primary tool is the raising or lowering of interest rates. Relatively high interest rates – or the expectation of higher rates – will usually benefit the Euro and vice versa. The ECB Governing Council makes monetary policy decisions at meetings held eight times a year. Decisions are made by heads of the Eurozone national banks and six permanent members, including the President of the ECB, Christine Lagarde.
Eurozone inflation data, measured by the Harmonized Index of Consumer Prices (HICP), is an important econometric for the Euro. If inflation rises more than expected, especially if above the ECB’s 2% target, it obliges the ECB to raise interest rates to bring it back under control. Relatively high interest rates compared to its counterparts will usually benefit the Euro, as it makes the region more attractive as a place for global investors to park their money.
Data releases gauge the health of the economy and can impact on the Euro. Indicators such as GDP, Manufacturing and Services PMIs, employment, and consumer sentiment surveys can all influence the direction of the single currency. A strong economy is good for the Euro. Not only does it attract more foreign investment but it may encourage the ECB to put up interest rates, which will directly strengthen the Euro. Otherwise, if economic data is weak, the Euro is likely to fall. Economic data for the four largest economies in the euro area (Germany, France, Italy and Spain) are especially significant, as they account for 75% of the Eurozone’s economy.
Another significant data release for the Euro is the Trade Balance. This indicator measures the difference between what a country earns from its exports and what it spends on imports over a given period. If a country produces highly sought after exports then its currency will gain in value purely from the extra demand created from foreign buyers seeking to purchase these goods. Therefore, a positive net Trade Balance strengthens a currency and vice versa for a negative balance.
-
09:22
Crude Oil price today: WTI price bearish, according to FXStreet data
West Texas Intermediate (WTI) Oil price falls on Friday, according to FXStreet data. WTI trades at $69.49 per barrel, down from Thursday’s close at $69.99.
Brent Oil Exchange Rate (Brent crude) is also shedding ground, trading at $72.86 after its previous daily close at $73.28.
WTI Oil FAQs
WTI Oil is a type of Crude Oil sold on international markets. The WTI stands for West Texas Intermediate, one of three major types including Brent and Dubai Crude. WTI is also referred to as “light” and “sweet” because of its relatively low gravity and sulfur content respectively. It is considered a high quality Oil that is easily refined. It is sourced in the United States and distributed via the Cushing hub, which is considered “The Pipeline Crossroads of the World”. It is a benchmark for the Oil market and WTI price is frequently quoted in the media.
Like all assets, supply and demand are the key drivers of WTI Oil price. As such, global growth can be a driver of increased demand and vice versa for weak global growth. Political instability, wars, and sanctions can disrupt supply and impact prices. The decisions of OPEC, a group of major Oil-producing countries, is another key driver of price. The value of the US Dollar influences the price of WTI Crude Oil, since Oil is predominantly traded in US Dollars, thus a weaker US Dollar can make Oil more affordable and vice versa.
The weekly Oil inventory reports published by the American Petroleum Institute (API) and the Energy Information Agency (EIA) impact the price of WTI Oil. Changes in inventories reflect fluctuating supply and demand. If the data shows a drop in inventories it can indicate increased demand, pushing up Oil price. Higher inventories can reflect increased supply, pushing down prices. API’s report is published every Tuesday and EIA’s the day after. Their results are usually similar, falling within 1% of each other 75% of the time. The EIA data is considered more reliable, since it is a government agency.
OPEC (Organization of the Petroleum Exporting Countries) is a group of 12 Oil-producing nations who collectively decide production quotas for member countries at twice-yearly meetings. Their decisions often impact WTI Oil prices. When OPEC decides to lower quotas, it can tighten supply, pushing up Oil prices. When OPEC increases production, it has the opposite effect. OPEC+ refers to an expanded group that includes ten extra non-OPEC members, the most notable of which is Russia.
(An automation tool was used in creating this post.)
-
09:15
Austria Producer Price Index (YoY) up to -0.4% in January from previous -1.1%
-
09:02
Austria Producer Price Index (YoY) fell from previous -1.1% to -7.2% in January
-
09:01
Austria Producer Price Index (MoM) dipped from previous 0.3% to -0.3% in January
-
09:01
Austria Producer Price Index (YoY) up to -0.4% in January from previous -1.1%
-
08:45
France Consumer Price Index (EU norm) (MoM) below expectations (0.3%) in February: Actual (0%)
-
08:45
France Consumer Price Index (EU norm) (YoY) came in at 0.9%, below expectations (1.2%) in February
-
08:45
France Consumer Spending (MoM) registered at -0.5% above expectations (-0.7%) in January
-
08:45
France Gross Domestic Product (QoQ) in line with expectations (-0.1%) in 4Q
-
08:45
France Nonfarm Payrolls (QoQ) came in at -0.3% below forecasts (-0.2%) in 4Q
-
08:42
NZD/USD grapples to break below 0.5600 ahead of US PCE inflation data
- NZD/USD struggles due to rising concerns over global trade tensions and domestic monetary policy.
- The ANZ-Roy Morgan Consumer Confidence index rose to 96.6 in February, slightly higher than January’s 96.0.
- Traders adopt caution ahead of the Personal Consumption Expenditures Price Index, the Fed’s preferred inflation measure.
NZD/USD continues its losing streak that began on February 21, hovering around 0.5600 during early European trading on Friday. The New Zealand Dollar (NZD) faces downward pressure despite a private survey indicating a slight rise in consumer confidence for February, as concerns over global trade tensions and domestic monetary policy persist.
The ANZ – Roy Morgan Consumer Confidence inched up to 96.6 in February from 96.0 in the previous month. However, economic outlook perceptions for the next 12 months declined to -16%, while expectations for house price inflation saw a modest increase.
The NZD/USD pair weakens as the safe-haven US Dollar (USD) strengthens amid heightened fears of a global trade war. US President Donald Trump reaffirmed that his proposed 25% tariffs on Mexican and Canadian goods will take effect on March 4, alongside an additional 10% tariff on Chinese imports due to ongoing drug trafficking concerns.
Further exacerbating trade tensions, Trump imposed new tariffs on Chinese goods, adding to the 10% levies introduced on February 4 in response to the fentanyl opioid crisis, bringing the total tariff to 20%. Any further tariff threats from the US could pressure the China-linked NZD, given China’s role as New Zealand’s primary trading partner.
Investors now turn their attention to the Personal Consumption Expenditures (PCE) Price Index, the Federal Reserve’s preferred inflation measure, set for release later in the day.
US-China Trade War FAQs
Generally speaking, a trade war is an economic conflict between two or more countries due to extreme protectionism on one end. It implies the creation of trade barriers, such as tariffs, which result in counter-barriers, escalating import costs, and hence the cost of living.
An economic conflict between the United States (US) and China began early in 2018, when President Donald Trump set trade barriers on China, claiming unfair commercial practices and intellectual property theft from the Asian giant. China took retaliatory action, imposing tariffs on multiple US goods, such as automobiles and soybeans. Tensions escalated until the two countries signed the US-China Phase One trade deal in January 2020. The agreement required structural reforms and other changes to China’s economic and trade regime and pretended to restore stability and trust between the two nations. However, the Coronavirus pandemic took the focus out of the conflict. Yet, it is worth mentioning that President Joe Biden, who took office after Trump, kept tariffs in place and even added some additional levies.
The return of Donald Trump to the White House as the 47th US President has sparked a fresh wave of tensions between the two countries. During the 2024 election campaign, Trump pledged to impose 60% tariffs on China once he returned to office, which he did on January 20, 2025. With Trump back, the US-China trade war is meant to resume where it was left, with tit-for-tat policies affecting the global economic landscape amid disruptions in global supply chains, resulting in a reduction in spending, particularly investment, and directly feeding into the Consumer Price Index inflation.
-
08:33
Forex Today: US Dollar consolidates weekly gains ahead of key inflation data
Here is what you need to know on Friday, February 28:
The US Dollar (USD) Index, which tracks the USD's performance against a basket of six major currencies, clings to small daily gains after touching a two-week-high near 107.50 early Friday. Investors await preliminary February Consumer Price Index data from Germany January the Personal Consumption Expenditures (PCE) Price Index data, the Federal Reserve's (Fed) preferred gauge of inflation, from the US. Additionally, Statistics Canada will publish Gross Domestic Product (GDP) growth for the fourth quarter.
US Dollar PRICE This week
The table below shows the percentage change of US Dollar (USD) against listed major currencies this week. US Dollar was the strongest against the New Zealand Dollar.
USD EUR GBP JPY CAD AUD NZD CHF USD 0.73% 0.39% 0.60% 1.60% 2.34% 2.55% 0.39% EUR -0.73% -0.42% -0.31% 0.68% 1.59% 1.62% -0.50% GBP -0.39% 0.42% 0.17% 1.11% 2.02% 2.05% -0.08% JPY -0.60% 0.31% -0.17% 1.00% 1.82% 2.03% -0.11% CAD -1.60% -0.68% -1.11% -1.00% 0.68% 0.93% -1.17% AUD -2.34% -1.59% -2.02% -1.82% -0.68% 0.03% -2.06% NZD -2.55% -1.62% -2.05% -2.03% -0.93% -0.03% -2.09% CHF -0.39% 0.50% 0.08% 0.11% 1.17% 2.06% 2.09% The heat map shows percentage changes of major currencies against each other. The base currency is picked from the left column, while the quote currency is picked from the top row. For example, if you pick the US Dollar from the left column and move along the horizontal line to the Japanese Yen, the percentage change displayed in the box will represent USD (base)/JPY (quote).
The USD gathered strength against its rivals in the second half of the day on Thursday after US President Donald Trump said that the planned 25% tariff package on Mexican and Canadian imports will come into effect on March 4 as planned, rather than April 2nd that he mentioned a day earlier. On that date, China will also be charged an extra 10% tariff. Safe-haven flows dominated the action in financial markets following these comments and Wall Street's main indexes suffered large losses, helping the USD find demand.
In the early trading hours of the Asian session, the data from Japan showed that the Tokyo Consumer Price Index rose by 2.9% on a yearly basis in February, down from the 3.4% increase recorded in January. Meanwhile, Bank of Japan Deputy Governor Shinichi Uchida noted that the economy was experiencing a moderate recovery, with some weaknesses persisting. After rising nearly 0.5% on Thursday, USD/JPY trades marginally higher on the day near 150.00 in the European morning on Friday.
EUR/USD came under heavy bearish pressure and lost about 0.8% on Thursday. The pair struggles to find a foothold early Friday and trades below 1.0400. The data from Germany showed that Retail Sales rose 0.2% in January, following the 1.6% decrease recorded in December, but failed to help the Euro gather strength.
GBP/USD turned south late Thursday and lost more than 0.5% on the day. The pair continues to stretch lower early Friday and trades below 1.2600.
Gold extended its correction on Thursday and lost about 1.3%. XAU/USD stays under bearish pressure early Friday and trades at its weakest level in three weeks near $2,860.
AUD/USD fell more than 1% on Thursday and closed the fifth consecutive day in negative territory. The pair continues to stretch lower on Friday and trades at its lowest level since early February at around 0.6200.
Tariffs FAQs
Tariffs are customs duties levied on certain merchandise imports or a category of products. Tariffs are designed to help local producers and manufacturers be more competitive in the market by providing a price advantage over similar goods that can be imported. Tariffs are widely used as tools of protectionism, along with trade barriers and import quotas.
Although tariffs and taxes both generate government revenue to fund public goods and services, they have several distinctions. Tariffs are prepaid at the port of entry, while taxes are paid at the time of purchase. Taxes are imposed on individual taxpayers and businesses, while tariffs are paid by importers.
There are two schools of thought among economists regarding the usage of tariffs. While some argue that tariffs are necessary to protect domestic industries and address trade imbalances, others see them as a harmful tool that could potentially drive prices higher over the long term and lead to a damaging trade war by encouraging tit-for-tat tariffs.
During the run-up to the presidential election in November 2024, Donald Trump made it clear that he intends to use tariffs to support the US economy and American producers. In 2024, Mexico, China and Canada accounted for 42% of total US imports. In this period, Mexico stood out as the top exporter with $466.6 billion, according to the US Census Bureau. Hence, Trump wants to focus on these three nations when imposing tariffs. He also plans to use the revenue generated through tariffs to lower personal income taxes.
-
08:30
Switzerland Real Retail Sales (YoY) came in at 1.3%, below expectations (1.6%) in January
-
08:15
USD/CHF gathers strength to near 0.9000 as traders brace for US PCE data
- USD/CHF gains ground to around 0.8995 in Friday’s early European session.
- Trump said tariffs on Mexico and Canada will go into effect on March 4.
- The risk-off mood and safe-haven flows could boost the Swiss Franc and cap the pair’s upside.
The USD/CHF pair trades in positive territory near 0.8995 during the early European session on Friday. The Greenback jumps after US President Donald Trump's latest tariff comments. The US Personal Consumption Expenditures (PCE) Price Index for January will be the highlight on Friday.
The US Dollar jumps after Trump said that 25% tariffs on Mexican and Canadian goods will go into effect on March 4 as scheduled because drugs are still pouring into the United States from those countries. Trump added that goods from China will be subject to an extra 10% duty.
The path of interest rate cuts by the Federal Reserve (Fed) has become less clear, with markets pricing in 58 basis points (bps) of easing by year-end. Cleveland Fed President Beth Hammack said she expects US central bank interest rate policy is on hold for the time being. Philadelphia Federal Reserve Bank President Patrick Harker expressed support for continuing to hold the interest rate in the current range.
On the Swiss front, the softer Consumer Price Index (CPI) data for January has triggered expectations of further rate cuts by the Swiss National Bank (SNB) in March. Inflation eased to 0.4%, its lowest level in nearly four years. Meanwhile, the uncertainty and escalating geopolitical tensions in the Middle East could boost the safe-haven flows, benefiting the Swiss Franc (CHF).Swiss Franc FAQs
The Swiss Franc (CHF) is Switzerland’s official currency. It is among the top ten most traded currencies globally, reaching volumes that well exceed the size of the Swiss economy. Its value is determined by the broad market sentiment, the country’s economic health or action taken by the Swiss National Bank (SNB), among other factors. Between 2011 and 2015, the Swiss Franc was pegged to the Euro (EUR). The peg was abruptly removed, resulting in a more than 20% increase in the Franc’s value, causing a turmoil in markets. Even though the peg isn’t in force anymore, CHF fortunes tend to be highly correlated with the Euro ones due to the high dependency of the Swiss economy on the neighboring Eurozone.
The Swiss Franc (CHF) is considered a safe-haven asset, or a currency that investors tend to buy in times of market stress. This is due to the perceived status of Switzerland in the world: a stable economy, a strong export sector, big central bank reserves or a longstanding political stance towards neutrality in global conflicts make the country’s currency a good choice for investors fleeing from risks. Turbulent times are likely to strengthen CHF value against other currencies that are seen as more risky to invest in.
The Swiss National Bank (SNB) meets four times a year – once every quarter, less than other major central banks – to decide on monetary policy. The bank aims for an annual inflation rate of less than 2%. When inflation is above target or forecasted to be above target in the foreseeable future, the bank will attempt to tame price growth by raising its policy rate. Higher interest rates are generally positive for the Swiss Franc (CHF) as they lead to higher yields, making the country a more attractive place for investors. On the contrary, lower interest rates tend to weaken CHF.
Macroeconomic data releases in Switzerland are key to assessing the state of the economy and can impact the Swiss Franc’s (CHF) valuation. The Swiss economy is broadly stable, but any sudden change in economic growth, inflation, current account or the central bank’s currency reserves have the potential to trigger moves in CHF. Generally, high economic growth, low unemployment and high confidence are good for CHF. Conversely, if economic data points to weakening momentum, CHF is likely to depreciate.
As a small and open economy, Switzerland is heavily dependent on the health of the neighboring Eurozone economies. The broader European Union is Switzerland’s main economic partner and a key political ally, so macroeconomic and monetary policy stability in the Eurozone is essential for Switzerland and, thus, for the Swiss Franc (CHF). With such dependency, some models suggest that the correlation between the fortunes of the Euro (EUR) and the CHF is more than 90%, or close to perfect.
-
08:14
Silver Price Forecast: XAG/USD falls to near $31.00 support, channel’s lower threshold
- Silver price could test the primary support at the psychological level of $31.00.
- The daily chart analysis indicates an increasing bearish bias, with the descending channel pattern continuing to expand.
- The pair could approach the initial resistance at the nine-day EMA of $31.83.
Silver price (XAG/USD) remains steady after registering losses in the previous session, trading near $31.20 per troy ounce during the early European session on Friday. Technical analysis on the daily chart indicates a strengthening bearish outlook, with the grey metal moving downwards within a descending channel pattern.
Silver price also remains below the nine-day and 14-day Exponential Moving Averages (EMAs), signaling weakened short-term momentum. Additionally, the 14-day Relative Strength Index (RSI) falls below the 50 mark, confirming the bearish bias is active.
To the downside, the XAG/USD pair may find initial support at the psychological level of $31.00, followed by the lower boundary of the descending channel at the 30.70 level. A break below this level could reinforce the bearish bias, potentially pushing Silver's price toward the five-month low of $28.74, last seen on December 19.
Silver price could encounter initial resistance at the nine-day EMA of $31.83, followed by the 14-day EMA at $31.89. The further barrier appears around the descending channel’s upper boundary at the $32.10 level. A break above this crucial resistance zone could restore the bullish outlook, potentially pushing the pair toward the four-month high of $33.40.
XAG/USD: Daily Chart
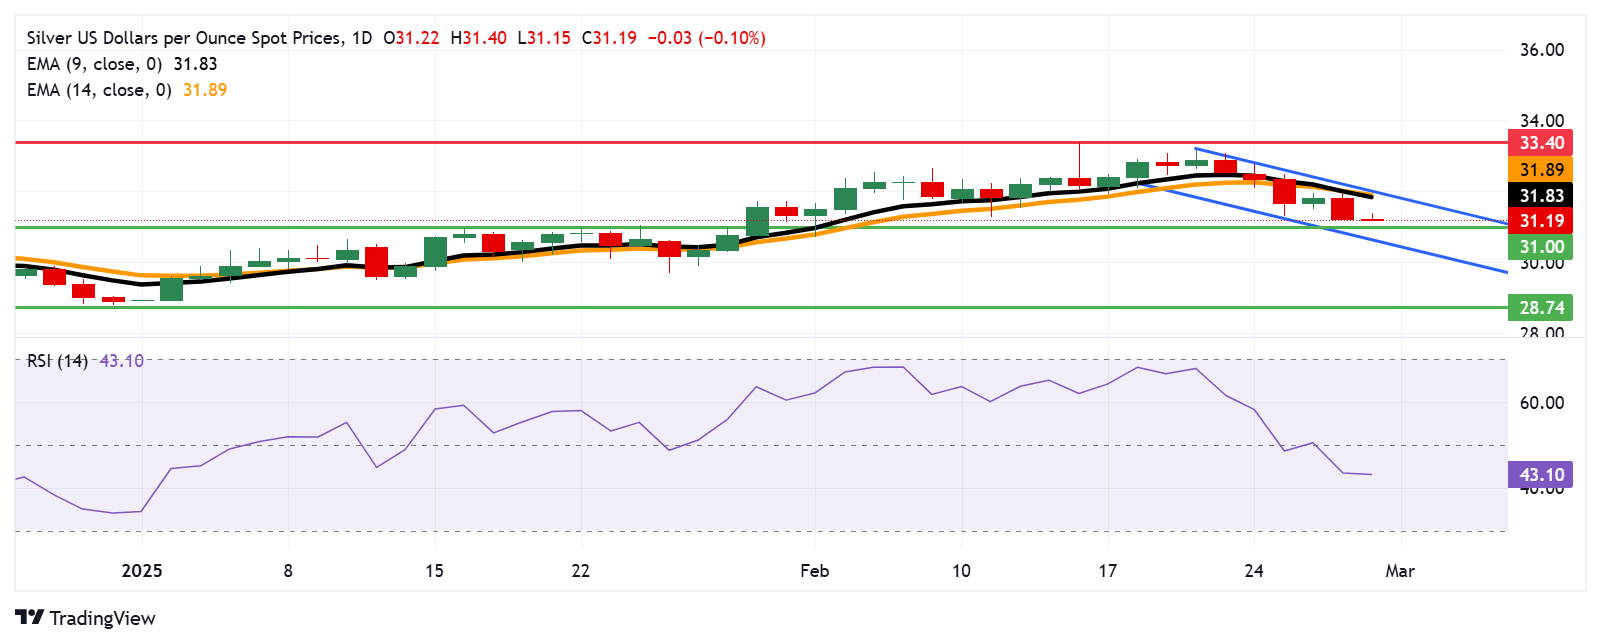
Silver FAQs
Silver is a precious metal highly traded among investors. It has been historically used as a store of value and a medium of exchange. Although less popular than Gold, traders may turn to Silver to diversify their investment portfolio, for its intrinsic value or as a potential hedge during high-inflation periods. Investors can buy physical Silver, in coins or in bars, or trade it through vehicles such as Exchange Traded Funds, which track its price on international markets.
Silver prices can move due to a wide range of factors. Geopolitical instability or fears of a deep recession can make Silver price escalate due to its safe-haven status, although to a lesser extent than Gold's. As a yieldless asset, Silver tends to rise with lower interest rates. Its moves also depend on how the US Dollar (USD) behaves as the asset is priced in dollars (XAG/USD). A strong Dollar tends to keep the price of Silver at bay, whereas a weaker Dollar is likely to propel prices up. Other factors such as investment demand, mining supply – Silver is much more abundant than Gold – and recycling rates can also affect prices.
Silver is widely used in industry, particularly in sectors such as electronics or solar energy, as it has one of the highest electric conductivity of all metals – more than Copper and Gold. A surge in demand can increase prices, while a decline tends to lower them. Dynamics in the US, Chinese and Indian economies can also contribute to price swings: for the US and particularly China, their big industrial sectors use Silver in various processes; in India, consumers’ demand for the precious metal for jewellery also plays a key role in setting prices.
Silver prices tend to follow Gold's moves. When Gold prices rise, Silver typically follows suit, as their status as safe-haven assets is similar. The Gold/Silver ratio, which shows the number of ounces of Silver needed to equal the value of one ounce of Gold, may help to determine the relative valuation between both metals. Some investors may consider a high ratio as an indicator that Silver is undervalued, or Gold is overvalued. On the contrary, a low ratio might suggest that Gold is undervalued relative to Silver.
-
08:03
BoE’s Ramsden: Gradual and careful approach needed to rate cuts
Bank of England (BoE) Deputy Governor Dave Ramsden spoke about monetary policy in a world of geopolitical fragmentation at Stellenbosch University in South Africa on Friday.
Key quotes
Gradual and careful approach needed to rate cuts.
That doesn’t always mean the descent has to be slow.
There may be circumstances when a slower-than-expected descent is justified but there will also be times when conditions require that the pace has to quicken.
MPC need to judge evidence afresh each meeting.
Risks to hitting 2% inflation are no longer just to downside, they are two sided.
Core disinflationary process remains intact.
Compared with my position throughout last year, I am now less certain than I was about the outlook for the UK labor market.
Impact of US tariffs could be inflationary or disinflationary for the UK.
Entirely possible that the current supply capacity is even weaker than we assessed it to be and may be more persistently weak through the forecast.
I voted for 25 bps cut in December 2024 due to concern that interaction of weaker demand with a loosening labour market could be multiplicative, opening up an excessive degree of slack.
Market reaction
At the time of writing, GBP/USD is losing 0.20% on the day to trade near 1.2580.
BoE FAQs
The Bank of England (BoE) decides monetary policy for the United Kingdom. Its primary goal is to achieve ‘price stability’, or a steady inflation rate of 2%. Its tool for achieving this is via the adjustment of base lending rates. The BoE sets the rate at which it lends to commercial banks and banks lend to each other, determining the level of interest rates in the economy overall. This also impacts the value of the Pound Sterling (GBP).
When inflation is above the Bank of England’s target it responds by raising interest rates, making it more expensive for people and businesses to access credit. This is positive for the Pound Sterling because higher interest rates make the UK a more attractive place for global investors to park their money. When inflation falls below target, it is a sign economic growth is slowing, and the BoE will consider lowering interest rates to cheapen credit in the hope businesses will borrow to invest in growth-generating projects – a negative for the Pound Sterling.
In extreme situations, the Bank of England can enact a policy called Quantitative Easing (QE). QE is the process by which the BoE substantially increases the flow of credit in a stuck financial system. QE is a last resort policy when lowering interest rates will not achieve the necessary result. The process of QE involves the BoE printing money to buy assets – usually government or AAA-rated corporate bonds – from banks and other financial institutions. QE usually results in a weaker Pound Sterling.
Quantitative tightening (QT) is the reverse of QE, enacted when the economy is strengthening and inflation starts rising. Whilst in QE the Bank of England (BoE) purchases government and corporate bonds from financial institutions to encourage them to lend; in QT, the BoE stops buying more bonds, and stops reinvesting the principal maturing on the bonds it already holds. It is usually positive for the Pound Sterling.
-
08:01
German Retail Sales jump 2.9% YoY in January vs. 1.8% previous
- Retail Sales in Germany rebounded firmly on an annual basis in January.
- EUR/USD remains depressed in a range below 1.0400.
Retail Sales in Germany rebounded 0.2% month-on-month (MoM) in January, following the 1.6% decrease recorded in December, the official data released by Destatis showed Friday.
The reading outpaced the market expectation for a 0% print.
On an annual basis, Retail Sales rose by 2.9% in January, compared to a 1.8% growth reported in December.
Market reaction
These data fails to impress Euro buyers. At the press time, EUR/USD is trading 0.09% lower on the day at 1.0387.
Euro PRICE Today
The table below shows the percentage change of Euro (EUR) against listed major currencies today. Euro was the weakest against the Canadian Dollar.
USD EUR GBP JPY CAD AUD NZD CHF USD 0.16% 0.24% 0.24% -0.01% 0.38% 0.60% 0.07% EUR -0.16% 0.09% 0.11% -0.16% 0.22% 0.44% -0.09% GBP -0.24% -0.09% 0.00% -0.25% 0.13% 0.35% -0.18% JPY -0.24% -0.11% 0.00% -0.22% 0.15% 0.36% -0.16% CAD 0.00% 0.16% 0.25% 0.22% 0.37% 0.60% 0.07% AUD -0.38% -0.22% -0.13% -0.15% -0.37% 0.21% -0.31% NZD -0.60% -0.44% -0.35% -0.36% -0.60% -0.21% -0.53% CHF -0.07% 0.09% 0.18% 0.16% -0.07% 0.31% 0.53% The heat map shows percentage changes of major currencies against each other. The base currency is picked from the left column, while the quote currency is picked from the top row. For example, if you pick the Euro from the left column and move along the horizontal line to the US Dollar, the percentage change displayed in the box will represent EUR (base)/USD (quote).
-
08:01
Sweden Gross Domestic Product (QoQ) in line with expectations (0.2%) in 4Q
-
08:00
Sweden Gross Domestic Product (YoY) meets expectations (1.1%) in 4Q
-
08:00
Germany Retail Sales (MoM) came in at 0.2%, above expectations (0%) in January
-
08:00
Germany Import Price Index (YoY) above expectations (2.7%) in January: Actual (3.1%)
-
08:00
United Kingdom Nationwide Housing Prices s.a (MoM) registered at 0.4% above expectations (0.2%) in February
-
08:00
Germany Retail Sales (YoY): 2.9% (January) vs 1.8%
-
08:00
Germany Import Price Index (MoM) came in at 1.1%, above expectations (0.7%) in January
-
08:00
United Kingdom Nationwide Housing Prices n.s.a (YoY) above expectations (3.5%) in February: Actual (3.9%)
-
08:00
US core PCE inflation set to ease as markets expect Federal Reserve to keep rates unchanged
- The core Personal Consumption Expenditures Price Index is expected to rise 0.3% MoM and 2.6% YoY in January.
- Markets largely expect the Federal Reserve to hold the policy setting unchanged in March and May.
- Annual PCE inflation is forecast to edge lower to 2.5% from 2.6% in December.
The United States (US) Bureau of Economic Analysis (BEA) is set to release the Personal Consumption Expenditures (PCE) Price Index data for January on Friday at 13:30 GMT. This index is the Federal Reserve’s (Fed) preferred measure of inflation.
Although PCE inflation data is usually seen as a big market mover, it might be difficult to assess its impact on the US Dollar’s (USD) valuation this time. Markets see virtually no chance of a Fed interest rate cut in March, and investors have been more interested in headlines surrounding US President Donald Trump’s policy changes and their potential impact on the economic outlook.
Anticipating the PCE: Insights into the Fed's key inflation metric
The core PCE Price Index, which excludes volatile food and energy prices, is projected to rise 0.3% on a monthly basis in January, following the 0.2% increase recorded in December. Over the last twelve months, the core PCE inflation is forecast to soften to 2.6% from 2.8%. Meanwhile, the headline annual PCE inflation is seen retreating to 2.5% from 2.6% in the same period.
Following a 25 bps cut in December, lowering the Fed’s policy rate to the 4.25%-4.50% range, the central bank kept interest rates unchanged in the January decision. In the meeting Minutes released on February 19, the central bank removed earlier language suggesting inflation had "made progress" toward its 2% target, instead stating that the pace of price increases "remains elevated" to justify such a pause.
Previewing the PCE inflation report, TD Securities said: “We look for core PCE prices to register a notably weaker advance in January compared to the CPI equivalent's 0.45% m/m increase. Headline PCE inflation should also come in softer at 0.30%. On a y/y basis, core PCE inflation is likely to drop by a notable three tenths to 2.5%—its lowest level since early 2021. Personal spending also likely fell for the first time since March.”
Economic Indicator
Core Personal Consumption Expenditures - Price Index (YoY)
The Core Personal Consumption Expenditures (PCE), released by the US Bureau of Economic Analysis on a monthly basis, measures the changes in the prices of goods and services purchased by consumers in the United States (US). The PCE Price Index is also the Federal Reserve’s (Fed) preferred gauge of inflation. The YoY reading compares the prices of goods in the reference month to the same month a year earlier. The core reading excludes the so-called more volatile food and energy components to give a more accurate measurement of price pressures." Generally, a high reading is bullish for the US Dollar (USD), while a low reading is bearish.
Read more.Next release: Fri Feb 28, 2025 13:30
Frequency: Monthly
Consensus: 2.6%
Previous: 2.8%
Source: US Bureau of Economic Analysis
After publishing the GDP report, the US Bureau of Economic Analysis releases the Personal Consumption Expenditures (PCE) Price Index data alongside the monthly changes in Personal Spending and Personal Income. FOMC policymakers use the annual Core PCE Price Index, which excludes volatile food and energy prices, as their primary gauge of inflation. A stronger-than-expected reading could help the USD outperform its rivals as it would hint at a possible hawkish shift in the Fed’s forward guidance and vice versa.
How will the Personal Consumption Expenditures Price Index affect EUR/USD?
Market participants will likely react to an unexpected reading in the monthly core PCE Price Index, which is not distorted by base effects. A print of 0.4% or higher in this data could support the US Dollar (USD) with the immediate reaction. On the other hand, a reading below 0.2% could have the opposite effect on the USD’s performance against its major rivals.
Nevertheless, the market reaction is likely to remain short-lived. According to the CME FedWatch Tool, investors see about a 98% probability of the Fed holding the policy settings unchanged in March and price in a 20% chance of a 25 bps rate cut in May. It will likely take several soft PCE inflation readings in succession before market participants see a stronger probability of a rate reduction in May.
Eren Sengezer, European Session Lead Analyst at FXStreet, shares a brief technical outlook for EUR/USD:
“The Relative Strength Index (RSI) indicator on the daily chart edges lower but manages to hold above 50, suggesting that EUR/USD loses upward momentum while keeping a slightly bullish bias.”
“On the downside, 1.0390-1.0380 (50-day Simple Moving Average (SMA), Fibonacci 23.6% retracement level of the November-January downtrend) aligns as the first support. In case EUR/USD makes a daily close below this level, technical sellers could take action and open the door for an extended decline toward 1.0300 (static level). Looking north, the first resistance could be spotted at 1.0520 (100-day SMA). Once EUR/USD starts using this level as support, 1.0570 (Fibonacci 50% retracement) and 1.0650 (Fibonacci 61.8% retracement) could be set as next bullish targets.”
Inflation FAQs
Inflation measures the rise in the price of a representative basket of goods and services. Headline inflation is usually expressed as a percentage change on a month-on-month (MoM) and year-on-year (YoY) basis. Core inflation excludes more volatile elements such as food and fuel which can fluctuate because of geopolitical and seasonal factors. Core inflation is the figure economists focus on and is the level targeted by central banks, which are mandated to keep inflation at a manageable level, usually around 2%.
The Consumer Price Index (CPI) measures the change in prices of a basket of goods and services over a period of time. It is usually expressed as a percentage change on a month-on-month (MoM) and year-on-year (YoY) basis. Core CPI is the figure targeted by central banks as it excludes volatile food and fuel inputs. When Core CPI rises above 2% it usually results in higher interest rates and vice versa when it falls below 2%. Since higher interest rates are positive for a currency, higher inflation usually results in a stronger currency. The opposite is true when inflation falls.
Although it may seem counter-intuitive, high inflation in a country pushes up the value of its currency and vice versa for lower inflation. This is because the central bank will normally raise interest rates to combat the higher inflation, which attract more global capital inflows from investors looking for a lucrative place to park their money.
Formerly, Gold was the asset investors turned to in times of high inflation because it preserved its value, and whilst investors will often still buy Gold for its safe-haven properties in times of extreme market turmoil, this is not the case most of the time. This is because when inflation is high, central banks will put up interest rates to combat it. Higher interest rates are negative for Gold because they increase the opportunity-cost of holding Gold vis-a-vis an interest-bearing asset or placing the money in a cash deposit account. On the flipside, lower inflation tends to be positive for Gold as it brings interest rates down, making the bright metal a more viable investment alternative.
-
07:45
FX option expiries for Feb 28 NY cut
FX option expiries for Feb 28 NY cut at 10:00 Eastern Time via DTCC can be found below.
EUR/USD: EUR amounts
- 1.0300 922m
- 1.0395 1.3b
- 1.0400 3.2b
- 1.0500 1.4b
- 1.0525 1.3b
- 1.0550 2.3b
- 1.0600 1.5b
GBP/USD: GBP amounts
- 1.2650 413m
USD/JPY: USD amounts
- 148.00 1b
- 149.50 900m
- 150.00 1.6b
- 151.30 1.4b
USD/CHF: USD amounts
- 0.8875 1b
- 0.8920 1.2b
AUD/USD: AUD amounts
- 0.6400 545m
- 0.6420 644m
USD/CAD: USD amounts
- 1.4290 1.3b
- 1.4300 1.2b
- 1.4375 839m
- 1.4400 1.9b
- 1.4500 1.3b
NZD/USD: NZD amounts
- 0.5615 647m
EUR/GBP: EUR amounts
- 0.8245 540m
-
07:26
EUR/GBP remains firm near 0.8250 as concerns over potential US tariffs on the UK escalate
- EUR/GBP gains traction as worries over potential US tariffs on the UK intensify.
- President Trump signaled the potential imposition of trade tariffs on the UK after meeting with PM Keir Starmer late Thursday.
- The Euro comes under selling pressure as risk aversion rises amid renewed US-EU trade tensions.
EUR/GBP attracts buyers after two consecutive sessions of losses, trading around 0.8260 during Asian hours on Friday. The currency pair’s upside could be linked to a weakened Pound Sterling (GBP) following US President Donald Trump’s meeting with UK Prime Minister Keir Starmer late Thursday. Trump swiftly announced the possibility of trade tariffs on the UK unless the terms of a trade deal with the US—currently ambiguous—are agreed upon within an unspecified timeframe.
On Wednesday, UK Chancellor of the Exchequer Rachel Reeves expressed confidence that trade and investment between the US and UK would remain stable despite the new US administration. She noted, “The last time President Trump was in the White House, trade and investment flows between our two countries increased, and I've got every confidence that that can happen again.”
The British Pound may have faced additional pressure after Bank of England (BoE) Monetary Policy Committee Member Swati Dhingra signaled support for more aggressive monetary easing, favoring four rate cuts. Dhingra explained that while the media often associates "gradual" with 25 basis points (bps) per quarter, maintaining this pace throughout 2025 would still leave monetary policy excessively restrictive by year-end.
However, the EUR/GBP cross saw a pullback as the risk-sensitive Euro faced selling pressure amid heightened risk aversion following renewed US-EU trade tensions. US President Donald Trump suggested imposing “reciprocal” tariffs on the European Union (EU) as early as April.
During a press conference on Wednesday, Trump announced plans to implement a 25% tariff on “cars and other things” from the Eurozone “very soon.” In response, a European Commission (EC) spokesperson asserted, “The EU will react firmly and immediately against unjustified barriers to free and fair trade.”
Tariffs FAQs
Tariffs are customs duties levied on certain merchandise imports or a category of products. Tariffs are designed to help local producers and manufacturers be more competitive in the market by providing a price advantage over similar goods that can be imported. Tariffs are widely used as tools of protectionism, along with trade barriers and import quotas.
Although tariffs and taxes both generate government revenue to fund public goods and services, they have several distinctions. Tariffs are prepaid at the port of entry, while taxes are paid at the time of purchase. Taxes are imposed on individual taxpayers and businesses, while tariffs are paid by importers.
There are two schools of thought among economists regarding the usage of tariffs. While some argue that tariffs are necessary to protect domestic industries and address trade imbalances, others see them as a harmful tool that could potentially drive prices higher over the long term and lead to a damaging trade war by encouraging tit-for-tat tariffs.
During the run-up to the presidential election in November 2024, Donald Trump made it clear that he intends to use tariffs to support the US economy and American producers. In 2024, Mexico, China and Canada accounted for 42% of total US imports. In this period, Mexico stood out as the top exporter with $466.6 billion, according to the US Census Bureau. Hence, Trump wants to focus on these three nations when imposing tariffs. He also plans to use the revenue generated through tariffs to lower personal income taxes.
-
07:11
EUR/USD weakens below 1.0400 as traders brace for US PCE release
- EUR/USD trades in negative territory near 1.0390 in Friday’s Asian session, losing 0.16% on the day.
- The threat of escalating tariffs drags the Euro lower against the US Dollar.
- Fed officials signaled interest rates likely on hold for a while.
The EUR/USD pair remains under selling pressure near 1.0390 during the Asian trading hours on Friday. The Euro (EUR) weakens against the US Dollar (USD) amid the risk-off mood. The US Personal Consumption Expenditures (PCE) Price Index will take center stage later on Friday.
US President Donald Trump said late Thursday that 25% duties on imports from Canada and Mexico will come into effect on March 4, not April 2, as he had suggested the day prior. Trump further stated that goods from China will be subject to an extra 10% duty. He also this week promised 25% tariffs on shipments from the European Union. Tariff uncertainty from Trump is likely to weigh on the shared currency in the near term.
Cleveland Fed President Beth Hammack said on Thursday she expects US central bank interest rate policy to be on hold for the time being amid a hunt for evidence that inflation pressures are easing back to the 2% goal. Meanwhile, Atlanta Fed President Raphael Bostic said late Wednesday that the Fed should hold interest rates where they are, at a level that continues to put downward pressure on inflation. The cautious stance of the Fed might lift the Greenback and act as a headwind for EUR/USD.
The US PCE inflation data for January will be in the spotlight later on Friday. This report could influence market speculation for the Federal Reserve's (Fed) monetary policy outlook. Any signs of softer inflation in the US economy could undermine the USD and help limit the pair’s losses. Financial markets are now pricing in nearly 68% odds that the Fed will cut its interest rate in the June policy meeting after holding them in the March and May meetings, according to the CME FedWatch tool.Euro FAQs
The Euro is the currency for the 19 European Union countries that belong to the Eurozone. It is the second most heavily traded currency in the world behind the US Dollar. In 2022, it accounted for 31% of all foreign exchange transactions, with an average daily turnover of over $2.2 trillion a day. EUR/USD is the most heavily traded currency pair in the world, accounting for an estimated 30% off all transactions, followed by EUR/JPY (4%), EUR/GBP (3%) and EUR/AUD (2%).
The European Central Bank (ECB) in Frankfurt, Germany, is the reserve bank for the Eurozone. The ECB sets interest rates and manages monetary policy. The ECB’s primary mandate is to maintain price stability, which means either controlling inflation or stimulating growth. Its primary tool is the raising or lowering of interest rates. Relatively high interest rates – or the expectation of higher rates – will usually benefit the Euro and vice versa. The ECB Governing Council makes monetary policy decisions at meetings held eight times a year. Decisions are made by heads of the Eurozone national banks and six permanent members, including the President of the ECB, Christine Lagarde.
Eurozone inflation data, measured by the Harmonized Index of Consumer Prices (HICP), is an important econometric for the Euro. If inflation rises more than expected, especially if above the ECB’s 2% target, it obliges the ECB to raise interest rates to bring it back under control. Relatively high interest rates compared to its counterparts will usually benefit the Euro, as it makes the region more attractive as a place for global investors to park their money.
Data releases gauge the health of the economy and can impact on the Euro. Indicators such as GDP, Manufacturing and Services PMIs, employment, and consumer sentiment surveys can all influence the direction of the single currency. A strong economy is good for the Euro. Not only does it attract more foreign investment but it may encourage the ECB to put up interest rates, which will directly strengthen the Euro. Otherwise, if economic data is weak, the Euro is likely to fall. Economic data for the four largest economies in the euro area (Germany, France, Italy and Spain) are especially significant, as they account for 75% of the Eurozone’s economy.
Another significant data release for the Euro is the Trade Balance. This indicator measures the difference between what a country earns from its exports and what it spends on imports over a given period. If a country produces highly sought after exports then its currency will gain in value purely from the extra demand created from foreign buyers seeking to purchase these goods. Therefore, a positive net Trade Balance strengthens a currency and vice versa for a negative balance.
-
07:01
China's Politburo: Will implement more proactive macro policy
China’s Politburo, the country’s top leadership, said in a statement on Friday that it “will implement more proactive macro policy,.”
Additional takeaways
Will expand domestic demand.
Will stabilize housing market and stock market.
Will prevent and resolve risks and external shocks in key areas.
Will promote the sustained recovery of the economy.
Market reaction
The Chinese proxy, the Australian Dollar (AUD) remains unimpressed by these headlines, keeping AUD/USD down 0.37% on the day at around 0.6215.
Australian Dollar FAQs
One of the most significant factors for the Australian Dollar (AUD) is the level of interest rates set by the Reserve Bank of Australia (RBA). Because Australia is a resource-rich country another key driver is the price of its biggest export, Iron Ore. The health of the Chinese economy, its largest trading partner, is a factor, as well as inflation in Australia, its growth rate and Trade Balance. Market sentiment – whether investors are taking on more risky assets (risk-on) or seeking safe-havens (risk-off) – is also a factor, with risk-on positive for AUD.
The Reserve Bank of Australia (RBA) influences the Australian Dollar (AUD) by setting the level of interest rates that Australian banks can lend to each other. This influences the level of interest rates in the economy as a whole. The main goal of the RBA is to maintain a stable inflation rate of 2-3% by adjusting interest rates up or down. Relatively high interest rates compared to other major central banks support the AUD, and the opposite for relatively low. The RBA can also use quantitative easing and tightening to influence credit conditions, with the former AUD-negative and the latter AUD-positive.
China is Australia’s largest trading partner so the health of the Chinese economy is a major influence on the value of the Australian Dollar (AUD). When the Chinese economy is doing well it purchases more raw materials, goods and services from Australia, lifting demand for the AUD, and pushing up its value. The opposite is the case when the Chinese economy is not growing as fast as expected. Positive or negative surprises in Chinese growth data, therefore, often have a direct impact on the Australian Dollar and its pairs.
Iron Ore is Australia’s largest export, accounting for $118 billion a year according to data from 2021, with China as its primary destination. The price of Iron Ore, therefore, can be a driver of the Australian Dollar. Generally, if the price of Iron Ore rises, AUD also goes up, as aggregate demand for the currency increases. The opposite is the case if the price of Iron Ore falls. Higher Iron Ore prices also tend to result in a greater likelihood of a positive Trade Balance for Australia, which is also positive of the AUD.
The Trade Balance, which is the difference between what a country earns from its exports versus what it pays for its imports, is another factor that can influence the value of the Australian Dollar. If Australia produces highly sought after exports, then its currency will gain in value purely from the surplus demand created from foreign buyers seeking to purchase its exports versus what it spends to purchase imports. Therefore, a positive net Trade Balance strengthens the AUD, with the opposite effect if the Trade Balance is negative.
-
07:00
South Africa Private Sector Credit increased to 4.59% in January from previous 3.83%
-
06:57
Japan Construction Orders (YoY) increased to 12.2% in January from previous 8.1%
-
06:50
GBP/USD holds below 1.2600 as US PCE inflation data looms
- GBP/USD edges lower to around 1.2580 in Friday’s early European session.
- Trump’s tariff threats weigh on the Pound Sterling.
- Investors brace for the US January PCE inflation data, which is due later on Friday.
The GBP/USD pair extends its downside to near 1.2580 during the early European session on Friday. Tariff uncertainty from US President Donald Trump undermines the Pound Sterling (GBP) against the US Dollar (USD). The US Personal Consumption Expenditures (PCE) Price Index for January will be the highlight later on Friday.
Trump met with UK Prime Minister Keir Starmer late Thursday, and President Trump was quick to announce that there might be trade tariffs imposed on the UK as well unless ambiguous terms of a trade deal with the US are agreed upon within an undetermined deadline. Investors will closely watch the developments surrounding further Trump’s policies. Any signs of escalating trade tensions could lift the Greenback and create a headwind for GBP/USD.
Data released by the US Bureau of Economic Analysis (BEA) on Thursday showed that the Gross Domestic Product (GDP) expanded at an annual rate of 2.3% in the fourth quarter (Q4). This figure matched the initial estimate and came in line with the market consensus.
Looking ahead, investors will take more cues on the US PCE inflation data for January, which is due on Friday. This report could influence market speculation for the Federal Reserve's (Fed) monetary policy outlook. According to the CME FedWatch tool, the markets are now pricing in nearly 68% odds that the Fed will cut its interest rate in the June policy meeting after holding them in the March and May meetings.Pound Sterling FAQs
The Pound Sterling (GBP) is the oldest currency in the world (886 AD) and the official currency of the United Kingdom. It is the fourth most traded unit for foreign exchange (FX) in the world, accounting for 12% of all transactions, averaging $630 billion a day, according to 2022 data. Its key trading pairs are GBP/USD, also known as ‘Cable’, which accounts for 11% of FX, GBP/JPY, or the ‘Dragon’ as it is known by traders (3%), and EUR/GBP (2%). The Pound Sterling is issued by the Bank of England (BoE).
The single most important factor influencing the value of the Pound Sterling is monetary policy decided by the Bank of England. The BoE bases its decisions on whether it has achieved its primary goal of “price stability” – a steady inflation rate of around 2%. Its primary tool for achieving this is the adjustment of interest rates. When inflation is too high, the BoE will try to rein it in by raising interest rates, making it more expensive for people and businesses to access credit. This is generally positive for GBP, as higher interest rates make the UK a more attractive place for global investors to park their money. When inflation falls too low it is a sign economic growth is slowing. In this scenario, the BoE will consider lowering interest rates to cheapen credit so businesses will borrow more to invest in growth-generating projects.
Data releases gauge the health of the economy and can impact the value of the Pound Sterling. Indicators such as GDP, Manufacturing and Services PMIs, and employment can all influence the direction of the GBP. A strong economy is good for Sterling. Not only does it attract more foreign investment but it may encourage the BoE to put up interest rates, which will directly strengthen GBP. Otherwise, if economic data is weak, the Pound Sterling is likely to fall.
Another significant data release for the Pound Sterling is the Trade Balance. This indicator measures the difference between what a country earns from its exports and what it spends on imports over a given period. If a country produces highly sought-after exports, its currency will benefit purely from the extra demand created from foreign buyers seeking to purchase these goods. Therefore, a positive net Trade Balance strengthens a currency and vice versa for a negative balance.
-
06:38
USD/CAD sits near multi-week top, below mid-1.4400s ahead of US PCE Price Index
- USD/CAD attracts buyers for the sixth straight day amid the ongoing USD recovery.
- Concerns about Trump’s tariffs and softer Oil prices further undermine the Loonie.
- Traders await the release of the US PCE data before placing fresh directional bets.
The USD/CAD pair builds on the previous day's breakout momentum above the 50-day Simple Moving Average (SMA) and gains positive traction for the sixth successive day on Friday. The momentum lifts spot prices to a near four-week top, around the 1.4450-1.4455 area during the Asian session, and is sponsored by some follow-through US Dollar (USD) buying.
The second reading of the US Gross Domestic Product (GDP) released on Thursday showed that inflationary pressures continue to rise. Apart from this, worries that US President Donald Trump's policies would reignite inflation suggest that the Federal Reserve (Fed) will stick to its hawkish stance. This assists the USD Index (DXY), which tracks the Greenback against a basket of currencies, in prolonging this week's recovery move from over a two-month low and acts as a tailwind for the USD/CAD pair.
Furthermore, concerns about the economic fallout from Trump's tariff plans weigh on the Canadian Dollar (CAD) and also lend support to the currency pair. In fact, Trump confirmed that his proposed tariffs on Canada and Mexico would come into effect on March 4, as scheduled. This, along with a modest downtick in Crude Oil prices, undermines the commodity-linked Loonie and provides an additional lift to the USD/CAD pair. Traders, however, seem reluctant ahead of the crucial US inflation data.
The US Personal Consumption Expenditure (PCE) Price Index is due for release later during the early North American session and will influence the Fed's interest rate outlook. This, in turn, will play a key role in driving the USD demand in the near term. Apart from this, Oil price dynamics might produce short-term trading opportunities around the USD/CAD pair on the last day of the week. Nevertheless, spot prices remain on track to end on a positive note for the second successive week.
Canadian Dollar FAQs
The key factors driving the Canadian Dollar (CAD) are the level of interest rates set by the Bank of Canada (BoC), the price of Oil, Canada’s largest export, the health of its economy, inflation and the Trade Balance, which is the difference between the value of Canada’s exports versus its imports. Other factors include market sentiment – whether investors are taking on more risky assets (risk-on) or seeking safe-havens (risk-off) – with risk-on being CAD-positive. As its largest trading partner, the health of the US economy is also a key factor influencing the Canadian Dollar.
The Bank of Canada (BoC) has a significant influence on the Canadian Dollar by setting the level of interest rates that banks can lend to one another. This influences the level of interest rates for everyone. The main goal of the BoC is to maintain inflation at 1-3% by adjusting interest rates up or down. Relatively higher interest rates tend to be positive for the CAD. The Bank of Canada can also use quantitative easing and tightening to influence credit conditions, with the former CAD-negative and the latter CAD-positive.
The price of Oil is a key factor impacting the value of the Canadian Dollar. Petroleum is Canada’s biggest export, so Oil price tends to have an immediate impact on the CAD value. Generally, if Oil price rises CAD also goes up, as aggregate demand for the currency increases. The opposite is the case if the price of Oil falls. Higher Oil prices also tend to result in a greater likelihood of a positive Trade Balance, which is also supportive of the CAD.
While inflation had always traditionally been thought of as a negative factor for a currency since it lowers the value of money, the opposite has actually been the case in modern times with the relaxation of cross-border capital controls. Higher inflation tends to lead central banks to put up interest rates which attracts more capital inflows from global investors seeking a lucrative place to keep their money. This increases demand for the local currency, which in Canada’s case is the Canadian Dollar.
Macroeconomic data releases gauge the health of the economy and can have an impact on the Canadian Dollar. Indicators such as GDP, Manufacturing and Services PMIs, employment, and consumer sentiment surveys can all influence the direction of the CAD. A strong economy is good for the Canadian Dollar. Not only does it attract more foreign investment but it may encourage the Bank of Canada to put up interest rates, leading to a stronger currency. If economic data is weak, however, the CAD is likely to fall.
-
06:36
AUD/JPY Price Forecast: Tests 93.00 support, eyes on descending channel’s lower boundary
- AUD/JPY could target the lower boundary of the descending channel after a successful break below the 93.00 level.
- The 14-day RSI is positioned on the 30 mark, signaling an oversold condition and suggesting a potential upward correction.
- The pair could find the primary barrier at the nine-day EMA of 94.46.
AUD/JPY remains tepid for the fourth successive session, trading around 93.00 during the Asian hours on Friday. A review of the daily chart shows the currency cross moving downwards within a descending channel pattern, indicating the strengthening bearish bias.
The 14-day Relative Strength Index (RSI) sits at the 30 level, signaling an oversold condition and a potential upward correction in the near term. Additionally, the AUD/JPY cross remains below the nine-day Exponential Moving Average (EMA), highlighting weak short-term price momentum.
The AUD/JPY cross tests the immediate support at the 93.00 level, followed by the lower boundary of the descending channel at 92.50. A break below the channel could reinforce the bearish bias and put downward pressure on the currency cross to navigate the region around 90.13, the lowest since May 2023, last seen on August 5, 2024.
On the upside, the AUD/JPY cross could target the primary barrier at the nine-day EMA of 94.46. A break above this level could improve the short-term price momentum and support the pair to approach the upper boundary of the descending channel at the psychological level of 96.00, followed by the 50-day EMA at 96.45.
AUD/JPY: Daily Chart
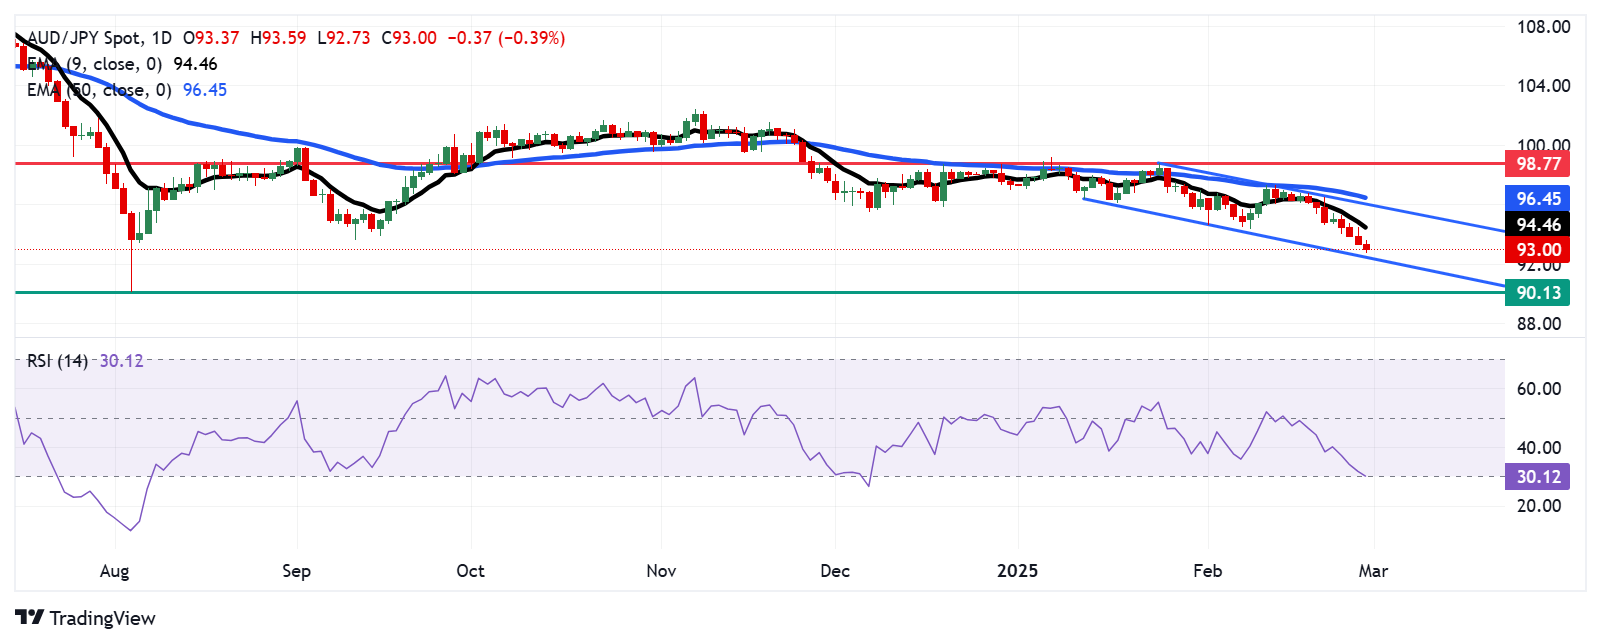
Australian Dollar PRICE Today
The table below shows the percentage change of Australian Dollar (AUD) against listed major currencies today. Australian Dollar was the weakest against the US Dollar.
USD EUR GBP JPY CAD AUD NZD CHF USD 0.18% 0.25% 0.00% -0.02% 0.40% 0.63% 0.02% EUR -0.18% 0.07% -0.19% -0.19% 0.21% 0.44% -0.17% GBP -0.25% -0.07% -0.24% -0.26% 0.15% 0.38% -0.25% JPY 0.00% 0.19% 0.24% 0.00% 0.40% 0.62% -0.01% CAD 0.02% 0.19% 0.26% -0.01% 0.40% 0.64% 0.00% AUD -0.40% -0.21% -0.15% -0.40% -0.40% 0.23% -0.39% NZD -0.63% -0.44% -0.38% -0.62% -0.64% -0.23% -0.63% CHF -0.02% 0.17% 0.25% 0.00% -0.00% 0.39% 0.63% The heat map shows percentage changes of major currencies against each other. The base currency is picked from the left column, while the quote currency is picked from the top row. For example, if you pick the Australian Dollar from the left column and move along the horizontal line to the US Dollar, the percentage change displayed in the box will represent AUD (base)/USD (quote).
-
06:06
Japan’s government cuts FY25/26 Budget plan to JPY115.2 trillion
Japanese Prime Minister Shigeru Ishiba’s government announced that it reduced its FY25/26 Budget plan to JPY115.2 trillion
The government also said they will cut the new bond issuance to JPY28.6 trillion.
Market reaction
The Japanese Yen pares back gains on these headlines, supporting the USD/JPY recovery. At the press time, USD/JPY is down 0.13% on the day to near 149.70.
Japanese Yen PRICE Today
The table below shows the percentage change of Japanese Yen (JPY) against listed major currencies today. Japanese Yen was the strongest against the New Zealand Dollar.
USD EUR GBP JPY CAD AUD NZD CHF USD 0.18% 0.24% 0.00% 0.02% 0.39% 0.59% -0.00% EUR -0.18% 0.05% -0.16% -0.15% 0.20% 0.41% -0.18% GBP -0.24% -0.05% -0.24% -0.21% 0.15% 0.35% -0.24% JPY 0.00% 0.16% 0.24% 0.04% 0.39% 0.59% 0.00% CAD -0.02% 0.15% 0.21% -0.04% 0.35% 0.56% -0.03% AUD -0.39% -0.20% -0.15% -0.39% -0.35% 0.20% -0.39% NZD -0.59% -0.41% -0.35% -0.59% -0.56% -0.20% -0.59% CHF 0.00% 0.18% 0.24% -0.00% 0.03% 0.39% 0.59% The heat map shows percentage changes of major currencies against each other. The base currency is picked from the left column, while the quote currency is picked from the top row. For example, if you pick the Japanese Yen from the left column and move along the horizontal line to the US Dollar, the percentage change displayed in the box will represent JPY (base)/USD (quote).
-
06:00
Japan Annualized Housing Starts declined to 0.774M in January from previous 0.787M
-
06:00
Japan Housing Starts (YoY) below expectations (-2.6%) in January: Actual (-4.6%)
-
05:51
Gold price dives to over two-week low amid further USD recovery, ahead of US PCE data
- Gold price attracts sellers for the second straight day amid a broadly stronger USD.
- The risk-off mood and sliding US bond yields do little to support the precious metal.
- Traders now look forward to the US PCE Price Index for some meaningful impetus.
Gold price (XAU/USD) drifts lower for the second straight day – also marking the third day of a negative move in the previous four – and drops to over a two-week low, around the $2,861-2,860 region during the Asian session on Friday. The US Dollar (USD) prolongs this week's recovery move from its lowest level since December 10 for the third consecutive day amid bets that the Federal Reserve (Fed) would stick to its hawkish stance on the back of still-elevated inflation. This, in turn, is seen as a key factor driving flows away from the non-yielding yellow metal.
Traders, however, might opt to wait for the release of the US Personal Consumption Expenditure (PCE) Price Index data for cues about the Fed's rate-cut path and before placing fresh directional bets around the Gold price. In the meantime, the uncertainty around US President Donald Trump's tariff plans, along with the risk-off impulse, could lend support to the safe-haven precious metal. The global flight to safety triggers a fresh leg down in the US Treasury bond yields, which might further contribute to limiting losses for the XAU/USD and warrants caution for bears.
Daily Digest Market Movers: Gold price is pressured by some follow-through USD buying
- Data released on Thursday revealed that inflation in the US continues to rise and backs the case for the Federal Reserve to hold interest rates steady. This assists the US Dollar in building on its recovery from over a two-month low and drags the non-yielding Gold price to over a two-week low on Friday.
- The US Bureau of Economic Analysis published the second reading of the US Gross Domestic Product, which showed that the economy expanded as estimated previously, by a 2.3% annualized pace during the final quarter of 2024. Moreover, the GDP Price Index rose 2.4% compared to the initial estimate of 2.2%.
- This comes on top of worries that US President Donald Trump's policies would reignite inflation. Furthermore, Fed officials remain wary of future interest rate cuts amid sticky inflation, which continues to underpin the USD and contributes to driving flows away from the non-yielding yellow metal.
- Kansas City Fed President Jeff Schmid said on Thursday that recent surveys indicated a rise in consumer inflation expectations and that the central bank must stay focused on fully containing price pressures.
- Adding to this, Cleveland Fed President Beth Hammack noted that interest rates are likely on hold for the time being as inflation data starts to pose a growing problem for central policymakers.
- Separately, Philadelphia Fed President Patrick Harker noted that progress toward the 2% inflation target has slowed and that the policy rate remains restrictive to continue putting downward pressure on inflation.
- Hence, the market focus will remain glued to the release of the US Personal Consumption Expenditure (PCE) Price Index, due later during the North American session. The crucial inflation data will influence the Fed's interest rate outlook, which will drive the USD and provide some meaningful impetus to the XAU/USD pair.
- Meanwhile, investors remain worried about the potential economic fallout from Trump's tariff plans. In fact, Trump said that his proposed tariffs on Canada and Mexico would come into effect on March 4 as scheduled and has also threatened to announce a 25% tariff on imports from the European Union.
Gold price turns vulnerable; breakdown below the 23.6% Fibo. level support in play
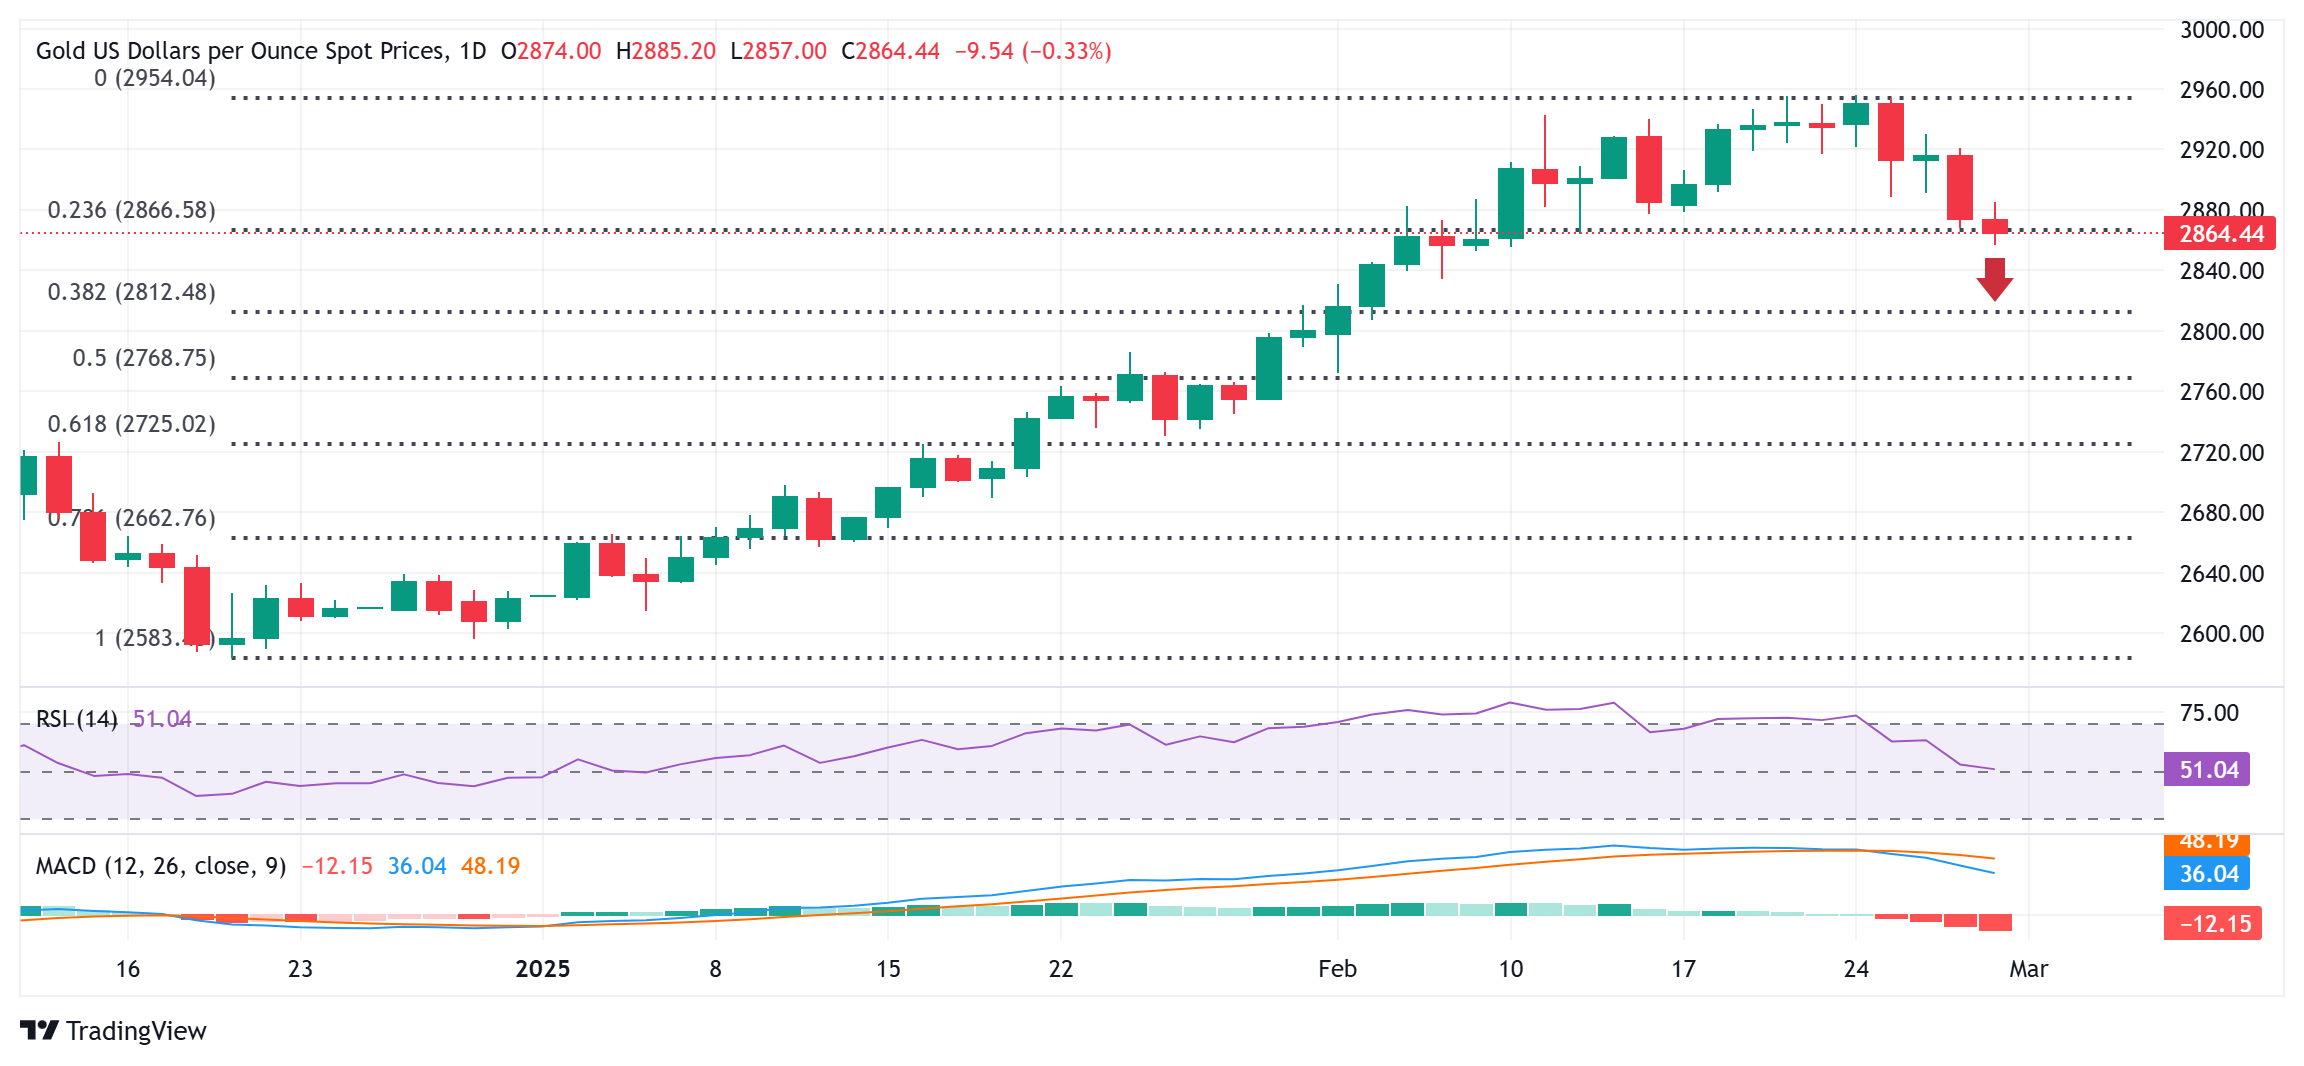
From a technical perspective, the latest leg down has now dragged the Gold price below the 23.6% Fibonacci retracement level of the December-February rally. Moreover, oscillators on the daily chart have just started gaining negative traction, and support prospects for an extension of this week's corrective pullback from the all-time peak. Some follow-through selling below the $2,856-2,855 horizontal zone will reaffirm the negative bias and drag the XAU/USD pair to the next relevant support near the $2,834 region en route to the 38.2% Fibo. level, around the $2,815-2,810 region. This is closely followed by the $2,800 mark, which if broken decisively will suggest that the commodity has topped out and also pave the way for deeper losses.
On the flip side, momentum back above the $2,867 area (23.6% Fibo. level) might now confront stiff resistance near the Asian session peak, around the $2,885 region, ahead of the $2,900 mark. A sustained strength beyond the latter could lift the Gold price further towards the $2,915 horizontal support breakpoint, which should now act as a key pivotal point. Some follow-through buying will shift the bias back in favor of bullish traders and expose the all-time peak, around the $2,956 region, with some intermediate hurdle near the $2,934 zone.
Gold FAQs
Gold has played a key role in human’s history as it has been widely used as a store of value and medium of exchange. Currently, apart from its shine and usage for jewelry, the precious metal is widely seen as a safe-haven asset, meaning that it is considered a good investment during turbulent times. Gold is also widely seen as a hedge against inflation and against depreciating currencies as it doesn’t rely on any specific issuer or government.
Central banks are the biggest Gold holders. In their aim to support their currencies in turbulent times, central banks tend to diversify their reserves and buy Gold to improve the perceived strength of the economy and the currency. High Gold reserves can be a source of trust for a country’s solvency. Central banks added 1,136 tonnes of Gold worth around $70 billion to their reserves in 2022, according to data from the World Gold Council. This is the highest yearly purchase since records began. Central banks from emerging economies such as China, India and Turkey are quickly increasing their Gold reserves.
Gold has an inverse correlation with the US Dollar and US Treasuries, which are both major reserve and safe-haven assets. When the Dollar depreciates, Gold tends to rise, enabling investors and central banks to diversify their assets in turbulent times. Gold is also inversely correlated with risk assets. A rally in the stock market tends to weaken Gold price, while sell-offs in riskier markets tend to favor the precious metal.
The price can move due to a wide range of factors. Geopolitical instability or fears of a deep recession can quickly make Gold price escalate due to its safe-haven status. As a yield-less asset, Gold tends to rise with lower interest rates, while higher cost of money usually weighs down on the yellow metal. Still, most moves depend on how the US Dollar (USD) behaves as the asset is priced in dollars (XAU/USD). A strong Dollar tends to keep the price of Gold controlled, whereas a weaker Dollar is likely to push Gold prices up.
-
05:41
India Gold price today: Gold falls, according to FXStreet data
Gold prices fell in India on Friday, according to data compiled by FXStreet.
The price for Gold stood at 8,032.76 Indian Rupees (INR) per gram, down compared with the INR 8,072.62 it cost on Thursday.
The price for Gold decreased to INR 93,692.55 per tola from INR 94,157.45 per tola a day earlier.
Unit measure Gold Price in INR 1 Gram 8,032.76 10 Grams 80,327.62 Tola 93,692.55 Troy Ounce 249,847.00 Daily digest market movers: PCE Friday more important than ever
-
Overnight, several US officials had to issue additional statements on the current timetable for US tariffs being imposed after the US President contradicted himself multiple times on what kind of tariffs would take place, when and for which countries. The troubled communication from Trump himself cast a fog over the tariff element, triggering a steep selloff in Gold (which was the tariff safe haven until now), Bloomberg reports.
-
The main data elements for this Thursday have been released:
- The second reading of the US Gross Domestic Product (GDP) for the fourth quarter of 2024:
-
The GDP annualized came in as expected at 2.3%.
-
The headline preliminary Personal Consumption Expenditures (PCE) component came in higher at 2.4%, beating the 2.3% with the core number turning red hot at 2.7%, surpassing the 2.5%.
-
-
US Initial Jobless Claims for the week ending on February 21 cme in higher at 224,000 with specific numbers for Washington D.C. on the uprising. Clearly the DOGE effect is playing out here. The US Continuing Claims for the week ending on February 14 fell to 1.862 million, below the expected 1.870 million people and below the previous 1.869 million people.
- The second reading of the US Gross Domestic Product (GDP) for the fourth quarter of 2024:
-
At 16:00 GMT, the US Kansas Fed Manufacturing Activity Index for February will be released. No forecast is available with the previous reading at -5.
-
Five US Federal Reserve (Fed) officials are set to speak:
- At 15:00 GMT, Federal Reserve Vice Chair for Supervision Michael Barr delivers a speech on "Novel Activity Supervision" at the Bank and Fintech Arrangements TechSprint event in Washington, D.C.
-
At 16:45 GMT, Federal Reserve Governor Michelle Bowman gives a speech focusing on Community Banking at the Fort Hays State University Robbins Banking Institute Lecture Series in Hays, Kansas.
-
At 18:00 GMT, Federal Reserve Bank of Richmond President Thomas Barkin will speak about "Inflation then and now", in Fayetteville Cumberland Economic Development, North Carolina.
- Just 15 minutes later, at 18:15 GMT, Federal Reserve Bank of Cleveland President and Chief Executive Officer Beth M. Hammack participates in the “2025 Bank Regulation Research Conference” at the Columbia University/Bank Policy Institute, New York.
-
Rounding up at 20:15 GMT Federal Reserve Bank of Philadelphia President Patrick T. Harker will discuss the economic outlook at the Lyons Economic Forecast, presented by the University of Delaware's Center for Economic Education and Entrepreneurship, in Newark, Delaware.
-
Equities are rolling over in both Europe and the US with the US indices down less than 1% while Europe faces bigger losses near its closing bell.
-
The CME Fedwatch Tool projects a 33.0% chance that the interest rates will remain at the current range in June, with the rest showing a possible rate cut.
-
The US 10-year yield trades around 4.28%, not far from its low for this week aat 4.24%, nd again further down from last week’s high at 4.574%.
FXStreet calculates Gold prices in India by adapting international prices (USD/INR) to the local currency and measurement units. Prices are updated daily based on the market rates taken at the time of publication. Prices are just for reference and local rates could diverge slightly.
Gold FAQs
Gold has played a key role in human’s history as it has been widely used as a store of value and medium of exchange. Currently, apart from its shine and usage for jewelry, the precious metal is widely seen as a safe-haven asset, meaning that it is considered a good investment during turbulent times. Gold is also widely seen as a hedge against inflation and against depreciating currencies as it doesn’t rely on any specific issuer or government.
Central banks are the biggest Gold holders. In their aim to support their currencies in turbulent times, central banks tend to diversify their reserves and buy Gold to improve the perceived strength of the economy and the currency. High Gold reserves can be a source of trust for a country’s solvency. Central banks added 1,136 tonnes of Gold worth around $70 billion to their reserves in 2022, according to data from the World Gold Council. This is the highest yearly purchase since records began. Central banks from emerging economies such as China, India and Turkey are quickly increasing their Gold reserves.
Gold has an inverse correlation with the US Dollar and US Treasuries, which are both major reserve and safe-haven assets. When the Dollar depreciates, Gold tends to rise, enabling investors and central banks to diversify their assets in turbulent times. Gold is also inversely correlated with risk assets. A rally in the stock market tends to weaken Gold price, while sell-offs in riskier markets tend to favor the precious metal.
The price can move due to a wide range of factors. Geopolitical instability or fears of a deep recession can quickly make Gold price escalate due to its safe-haven status. As a yield-less asset, Gold tends to rise with lower interest rates, while higher cost of money usually weighs down on the yellow metal. Still, most moves depend on how the US Dollar (USD) behaves as the asset is priced in dollars (XAU/USD). A strong Dollar tends to keep the price of Gold controlled, whereas a weaker Dollar is likely to push Gold prices up.
(An automation tool was used in creating this post.)
-
-
05:33
EUR/USD breaks below 1.0400 due to renewed US-EU trade tensions
- EUR/USD faces selling pressure amid heightened risk aversion following renewed US-EU trade tensions.
- US President Trump hinted at imposing “reciprocal” tariffs on the European Union (EU) as early as April.
- The US GDP Annualized grew by 2.3% in Q4 2024, matching market expectations.
EUR/USD continues its decline for the third consecutive day, trading near 1.0390 during the Asian session on Friday. The pair weakens as the risk-sensitive Euro faces selling pressure amid heightened risk aversion following renewed US-EU trade tensions. US President Donald Trump hinted at imposing “reciprocal” tariffs on the European Union (EU) as early as April.
During a press conference on Wednesday, Trump announced that a 25% tariff on “cars and other things” from the Eurozone would be implemented “very soon.” In response, a European Commission (EC) spokesperson stated, “The EU will react firmly and immediately against unjustified barriers to free and fair trade.”
The prospect of a US-EU tariff war poses a significant threat to the already fragile Eurozone economy, which continues to struggle with weak demand. This uncertainty could further weigh on the Euro, adding to the downward pressure on the EUR/USD pair.
Meanwhile, the US Dollar Index (DXY), which measures the USD against a basket of six major currencies, strengthened following the release of US Gross Domestic Product (GDP) data on Thursday. At the time of writing, the DXY hovers near 107.50.
The US GDP Annualized expanded by 2.3% in the fourth quarter of 2024, aligning with both the initial estimate and market expectations. Additionally, new orders for durable goods surged by 3.1% in January, surpassing forecasts of 2% and rebounding from a 2.2% decline in December.
Euro FAQs
The Euro is the currency for the 19 European Union countries that belong to the Eurozone. It is the second most heavily traded currency in the world behind the US Dollar. In 2022, it accounted for 31% of all foreign exchange transactions, with an average daily turnover of over $2.2 trillion a day. EUR/USD is the most heavily traded currency pair in the world, accounting for an estimated 30% off all transactions, followed by EUR/JPY (4%), EUR/GBP (3%) and EUR/AUD (2%).
The European Central Bank (ECB) in Frankfurt, Germany, is the reserve bank for the Eurozone. The ECB sets interest rates and manages monetary policy. The ECB’s primary mandate is to maintain price stability, which means either controlling inflation or stimulating growth. Its primary tool is the raising or lowering of interest rates. Relatively high interest rates – or the expectation of higher rates – will usually benefit the Euro and vice versa. The ECB Governing Council makes monetary policy decisions at meetings held eight times a year. Decisions are made by heads of the Eurozone national banks and six permanent members, including the President of the ECB, Christine Lagarde.
Eurozone inflation data, measured by the Harmonized Index of Consumer Prices (HICP), is an important econometric for the Euro. If inflation rises more than expected, especially if above the ECB’s 2% target, it obliges the ECB to raise interest rates to bring it back under control. Relatively high interest rates compared to its counterparts will usually benefit the Euro, as it makes the region more attractive as a place for global investors to park their money.
Data releases gauge the health of the economy and can impact on the Euro. Indicators such as GDP, Manufacturing and Services PMIs, employment, and consumer sentiment surveys can all influence the direction of the single currency. A strong economy is good for the Euro. Not only does it attract more foreign investment but it may encourage the ECB to put up interest rates, which will directly strengthen the Euro. Otherwise, if economic data is weak, the Euro is likely to fall. Economic data for the four largest economies in the euro area (Germany, France, Italy and Spain) are especially significant, as they account for 75% of the Eurozone’s economy.
Another significant data release for the Euro is the Trade Balance. This indicator measures the difference between what a country earns from its exports and what it spends on imports over a given period. If a country produces highly sought after exports then its currency will gain in value purely from the extra demand created from foreign buyers seeking to purchase these goods. Therefore, a positive net Trade Balance strengthens a currency and vice versa for a negative balance.
-
04:45
EUR/JPY falls below 155.50 following BoJ Deputy Governor Uchida's remarks
- EUR/JPY continues its losing streak as BoJ Deputy Governor Shinichi Uchida’s remarks reinforced expectations of further rate hikes.
- BoJ’s Uchida stated that Japan’s underlying inflation is steadily rising toward the 2% target, strengthening the case for policy tightening.
- US President Trump reignited trade tensions with Europe, suggesting that “reciprocal” tariffs could be imposed as early as April.
EUR/JPY remains under pressure for the fourth consecutive day, trading around 155.30 during Asian hours on Friday. The currency cross continues to struggle following hawkish remarks from Bank of Japan (BoJ) Deputy Governor Shinichi Uchida, who stated that Japan’s underlying inflation is gradually rising toward the 2% target. His comments reinforced market expectations that the BoJ will proceed with rate hikes this year, countering the impact of softer-than-expected Tokyo Consumer Price Index (CPI) data.
The latest Tokyo CPI report showed a slowdown in inflation. Headline Tokyo CPI rose 2.9% YoY in February, down from 3.4% in January. Core CPI (excluding fresh food and energy) increased by 2.2% YoY, below January’s 2.5%. Tokyo CPI ex Fresh Food rose 2.2% YoY, missing expectations of 2.3% and declining from 2.5% in the previous month.
In addition to BoJ-driven JPY strength, risk-off market sentiment is further supporting the Japanese Yen’s safe-haven appeal. Investor caution deepened after US President Donald Trump reaffirmed that his proposed 25% tariffs on Mexican and Canadian goods will take effect on March 4, alongside a 10% duty on Chinese imports, citing concerns over drug trafficking into the US.
President Trump also reignited trade tensions with Europe, hinting that “reciprocal” tariffs targeting the European Union (EU) could come as early as April. In a press conference on Wednesday, he announced that 25% tariffs on “cars and other things” from the Eurozone would be imposed “very soon.” A European Commission (EC) spokesperson responded, stating, “The EU will react firmly and immediately against unjustified barriers to free and fair trade.”
A potential US-EU tariff war would pose significant risks to the already fragile Eurozone economy, which is struggling with weak demand. The growing uncertainty could weigh on the Euro (EUR), further pressuring the EUR/JPY cross.
Tariffs FAQs
Tariffs are customs duties levied on certain merchandise imports or a category of products. Tariffs are designed to help local producers and manufacturers be more competitive in the market by providing a price advantage over similar goods that can be imported. Tariffs are widely used as tools of protectionism, along with trade barriers and import quotas.
Although tariffs and taxes both generate government revenue to fund public goods and services, they have several distinctions. Tariffs are prepaid at the port of entry, while taxes are paid at the time of purchase. Taxes are imposed on individual taxpayers and businesses, while tariffs are paid by importers.
There are two schools of thought among economists regarding the usage of tariffs. While some argue that tariffs are necessary to protect domestic industries and address trade imbalances, others see them as a harmful tool that could potentially drive prices higher over the long term and lead to a damaging trade war by encouraging tit-for-tat tariffs.
During the run-up to the presidential election in November 2024, Donald Trump made it clear that he intends to use tariffs to support the US economy and American producers. In 2024, Mexico, China and Canada accounted for 42% of total US imports. In this period, Mexico stood out as the top exporter with $466.6 billion, according to the US Census Bureau. Hence, Trump wants to focus on these three nations when imposing tariffs. He also plans to use the revenue generated through tariffs to lower personal income taxes.
-
04:13
Silver Price Forecast: XAG/USD defends 100-day SMA support near $31.15 area
- Silver attracts some buyers near the 100-day SMA pivotal support on Friday.
- The setup favors support prospects for a breakdown below the said support.
- Any further move up could be seen as a selling opportunity and remain capped.
Silver (XAG/USD) defends the 100-day Simple Moving Average (SMA) support and stages a modest recovery from a four-week low touched during the Asian session on Friday. The white metal currently trades around the $31.35 region, up over 0.30% for the day, though it lacks follow-through buying as traders keenly await the release of the US Personal Consumption Expenditure (PCE) Price Index.
From a technical perspective, oscillators on the daily chart have been gaining negative traction and support prospects for an extension of over a one-week-old downtrend. That said, it will still be prudent to wait for a convincing break below the 100-day SMA support, currently pegged near the $31.15 region, before positioning for further losses. The XAG/USD might then weaken below the $31.00 mark, towards the next relevant support near the $30.25 region.
The downward trajectory could extend further towards the $30.00 psychological mark, which if broken decisively will suggest that the XAG/USD has topped out in the near term and pave the way for a further depreciating move. The subsequent downfall has the potential to drag the white metal towards the $29.55-$29.50 horizontal support en route to the $29.00 round figure and December 2024 swing low, around the $28.80-$28.75 area.
On the flip side, any further move up is likely to confront some resistance near the $31.65 region ahead of the overnight swing high, around the $32.00 neighborhood. A sustained strength beyond the latter could trigger a short-covering rally and lift the XAG/USD to the $32.40-$32.45 hurdle. Bulls might then make a fresh attempt to conquer the $33.00 mark before aiming to test the monthly swing high, around the $33.40 area touched on February 14.
Silver daily chart
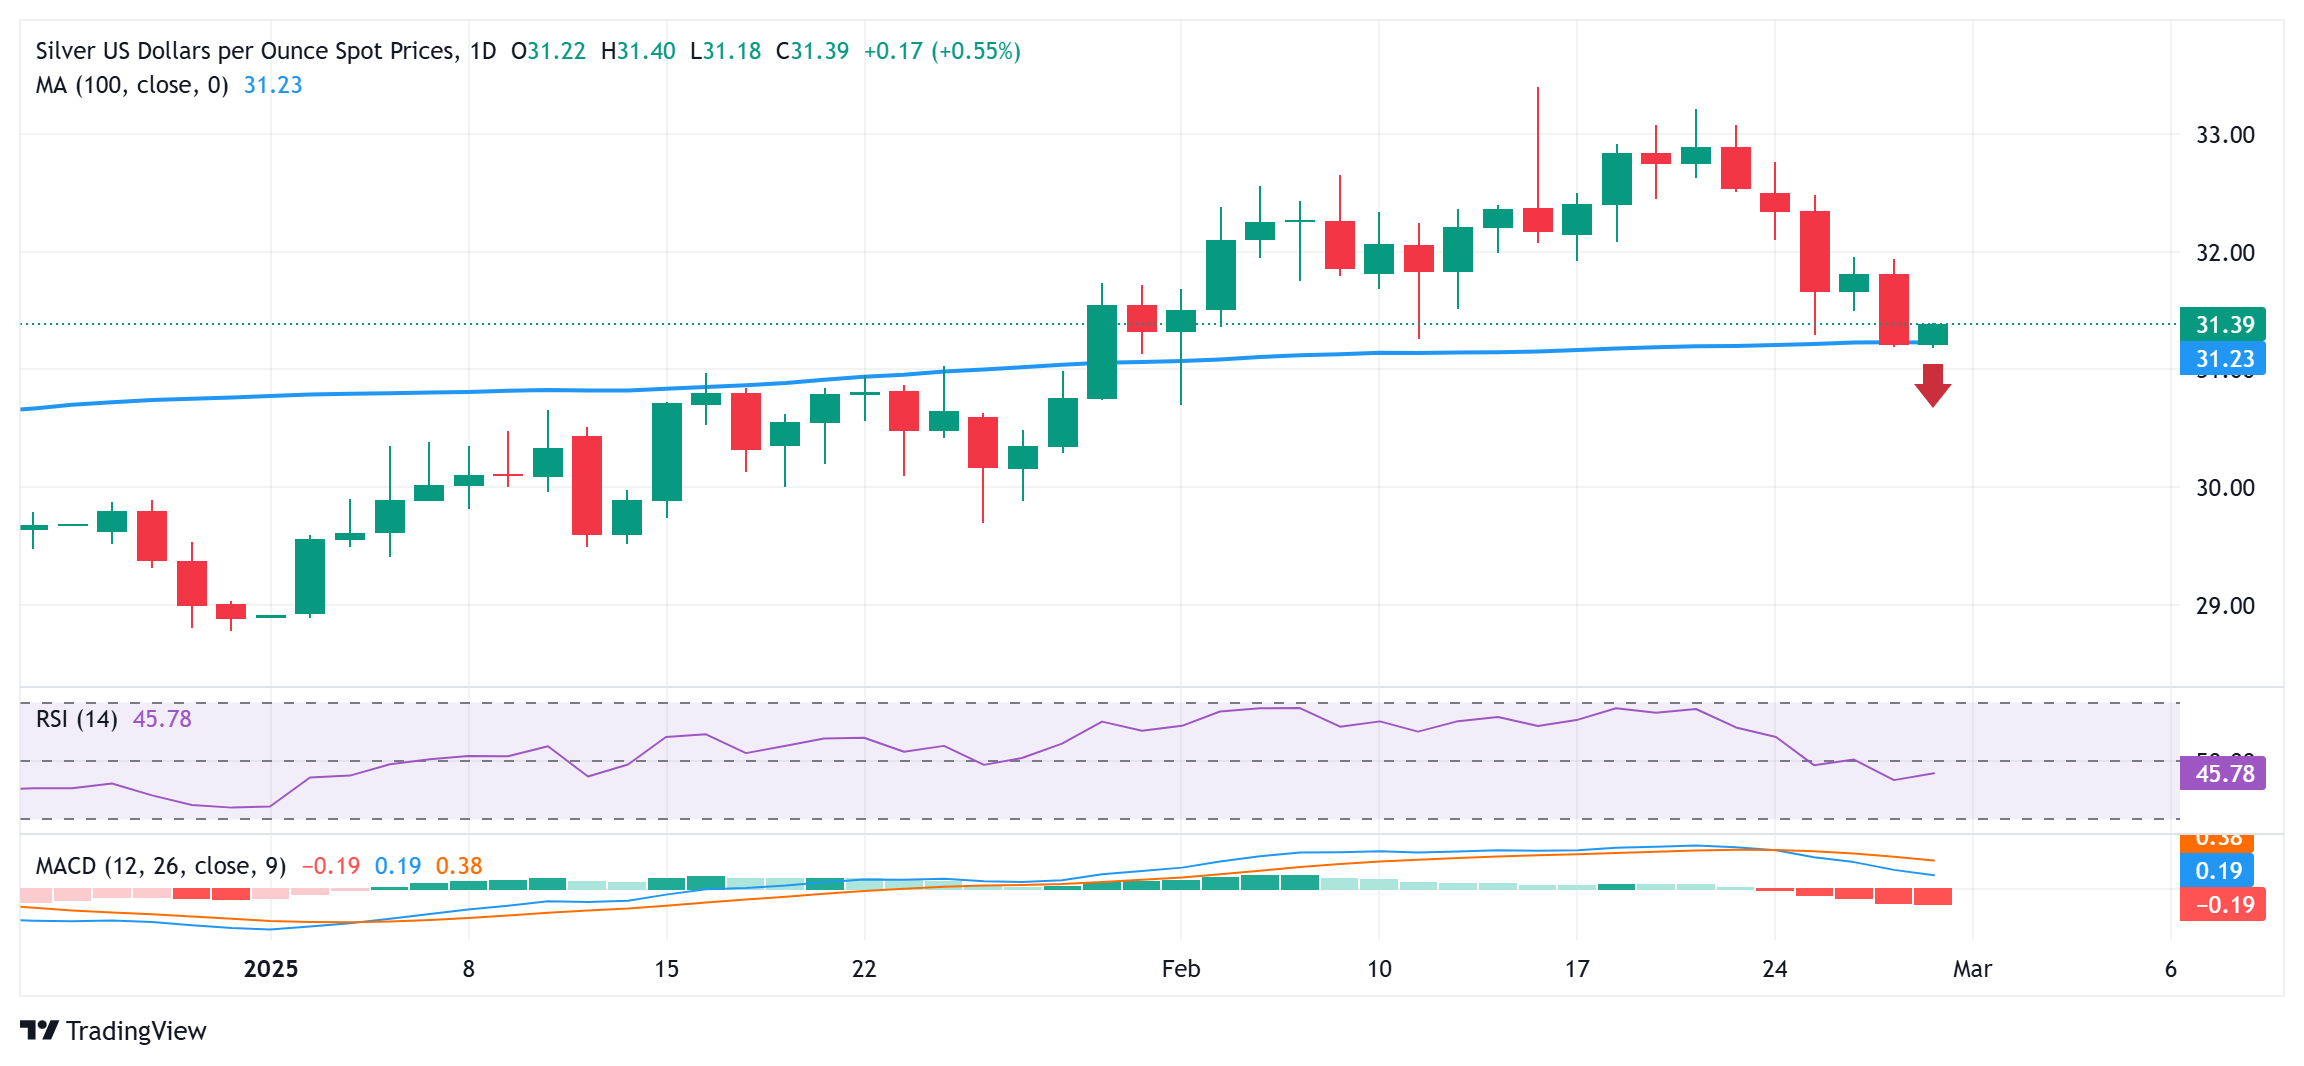
Silver FAQs
Silver is a precious metal highly traded among investors. It has been historically used as a store of value and a medium of exchange. Although less popular than Gold, traders may turn to Silver to diversify their investment portfolio, for its intrinsic value or as a potential hedge during high-inflation periods. Investors can buy physical Silver, in coins or in bars, or trade it through vehicles such as Exchange Traded Funds, which track its price on international markets.
Silver prices can move due to a wide range of factors. Geopolitical instability or fears of a deep recession can make Silver price escalate due to its safe-haven status, although to a lesser extent than Gold's. As a yieldless asset, Silver tends to rise with lower interest rates. Its moves also depend on how the US Dollar (USD) behaves as the asset is priced in dollars (XAG/USD). A strong Dollar tends to keep the price of Silver at bay, whereas a weaker Dollar is likely to propel prices up. Other factors such as investment demand, mining supply – Silver is much more abundant than Gold – and recycling rates can also affect prices.
Silver is widely used in industry, particularly in sectors such as electronics or solar energy, as it has one of the highest electric conductivity of all metals – more than Copper and Gold. A surge in demand can increase prices, while a decline tends to lower them. Dynamics in the US, Chinese and Indian economies can also contribute to price swings: for the US and particularly China, their big industrial sectors use Silver in various processes; in India, consumers’ demand for the precious metal for jewellery also plays a key role in setting prices.
Silver prices tend to follow Gold's moves. When Gold prices rise, Silver typically follows suit, as their status as safe-haven assets is similar. The Gold/Silver ratio, which shows the number of ounces of Silver needed to equal the value of one ounce of Gold, may help to determine the relative valuation between both metals. Some investors may consider a high ratio as an indicator that Silver is undervalued, or Gold is overvalued. On the contrary, a low ratio might suggest that Gold is undervalued relative to Silver.
-
03:55
WTI remains subdued around $70.00 amid concerns over global economic growth, fuel demand
- WTI price is on track for its first monthly decline since November, as concerns over fuel demand outweigh supply risks.
- The US will impose a 10% tariff on Canadian energy imports starting March 4.
- Oil prices surged on Thursday after President Trump revoked a license allowing US Oil giant Chevron to operate in Venezuela.
West Texas Intermediate (WTI) crude Oil price edges lower on Friday, trading around $69.90 per barrel during Asian hours, after posting gains in the previous session. Crude Oil prices are on track for their first monthly decline since November, as concerns over global economic growth and fuel demand—amid Washington’s tariff threats and signs of a US economic slowdown—outweighed supply worries.
On Thursday, US President Donald Trump announced that his proposed 25% tariffs on Mexican and Canadian goods, including a 10% levy on Canadian energy imports, will take effect on March 4, alongside an additional 10% duty on Chinese imports.
Adding to investor concerns, the US Gross Domestic Product Annualized (GDP) Annualized slowed to 2.3% in Q4, down from 3.1% in Q3, in line with initial projections. Meanwhile, weekly jobless claims jumped by 22,000 to 242,000, reaching their highest level in over two months and signaling potential softening in the labor market. Investors now turn their focus to Friday’s PCE price index report, the Federal Reserve’s preferred inflation gauge.
However, Oil prices surged more than 2% on Thursday after Trump revoked a license granted to US Oil giant Chevron to operate in Venezuela. Chevron exports approximately 240,000 barrels per day from Venezuela, and the suspension could disrupt over a quarter of the country’s oil output. The move may prompt negotiations for a new agreement between Chevron and Venezuelan state Oil company PDVSA to redirect crude exports to destinations other than the US, sources told Reuters.
Meanwhile, the OPEC+ (Organization of the Petroleum Exporting Countries and its allied members) is weighing whether to proceed with its planned oil output increase in April or maintain current levels. The group faces uncertainty due to fresh US sanctions on Venezuela, Iran, and Russia. OPEC+ typically finalizes supply decisions a month in advance, giving it until March 5-7 to confirm its April production strategy, though no consensus has been reached yet, according to Reuters sources.
WTI Oil FAQs
WTI Oil is a type of Crude Oil sold on international markets. The WTI stands for West Texas Intermediate, one of three major types including Brent and Dubai Crude. WTI is also referred to as “light” and “sweet” because of its relatively low gravity and sulfur content respectively. It is considered a high quality Oil that is easily refined. It is sourced in the United States and distributed via the Cushing hub, which is considered “The Pipeline Crossroads of the World”. It is a benchmark for the Oil market and WTI price is frequently quoted in the media.
Like all assets, supply and demand are the key drivers of WTI Oil price. As such, global growth can be a driver of increased demand and vice versa for weak global growth. Political instability, wars, and sanctions can disrupt supply and impact prices. The decisions of OPEC, a group of major Oil-producing countries, is another key driver of price. The value of the US Dollar influences the price of WTI Crude Oil, since Oil is predominantly traded in US Dollars, thus a weaker US Dollar can make Oil more affordable and vice versa.
The weekly Oil inventory reports published by the American Petroleum Institute (API) and the Energy Information Agency (EIA) impact the price of WTI Oil. Changes in inventories reflect fluctuating supply and demand. If the data shows a drop in inventories it can indicate increased demand, pushing up Oil price. Higher inventories can reflect increased supply, pushing down prices. API’s report is published every Tuesday and EIA’s the day after. Their results are usually similar, falling within 1% of each other 75% of the time. The EIA data is considered more reliable, since it is a government agency.
OPEC (Organization of the Petroleum Exporting Countries) is a group of 12 Oil-producing nations who collectively decide production quotas for member countries at twice-yearly meetings. Their decisions often impact WTI Oil prices. When OPEC decides to lower quotas, it can tighten supply, pushing up Oil prices. When OPEC increases production, it has the opposite effect. OPEC+ refers to an expanded group that includes ten extra non-OPEC members, the most notable of which is Russia.
-
03:41
Japanese Yen strengthens as hawkish BoJ expectations offset softer Tokyo CPI print
- The Japanese Yen regains positive traction amid rising bets for more BoJ rate hikes this year.
- The JPY bulls seem unaffected by the softer-than-expected Tokyo CPI released this Friday.
- Subdued USD demand also exerts pressure on USD/JPY as the focus shifts to the US PCE data.
The Japanese Yen (JPY) attracted fresh buyers during the Asian session on Friday following Bank of Japan (BoJ) Deputy Governor Shinichi Uchida's hawkish remarks, saying that the underlying inflation rate is gradually rising toward the 2% target. Uchida's comments reaffirm bets that the BoJ will continue raising interest rates this year, which helps offset softer-than-expected Tokyo Consumer Price Index (CPI) print and provides a modest lift to the JPY. Apart from this, the risk-off impulse is seen as another factor that benefits the JPY's relative safe-haven status.
Meanwhile, the anti-risk flow triggers a fresh leg down in the US Treasury bond yields. The resultant narrowing of the US-Japan rate differential contributes to driving flows toward the lower-yielding JPY. This, along with subdued US Dollar (USD) price action, drags the USD/JPY pair back below mid-149.00s. Traders, however, seem reluctant to place aggressive directional bets and opt to move to the sidelines ahead of the release of the US Personal Consumption Expenditure (PCE) Price Index, which will play a key role in influencing the USD price dynamics.
Japanese Yen bulls retain control amid hawkish BoJ expectations, ahead of US PCE Price Index
- Bank of Japan Deputy Governor Shinichi Uchida said this Friday that Japan's inflation rate is gradually rising towards the central bank's 2% target as the economy sustains a moderate recovery path.
- The Statistics Bureau of Japan reported that the headline Consumer Price Index (CPI) in Tokyo – Japan's capital city – decelerated from 3.4% in the previous month to the 2.9% YoY rate in February.
- Meanwhile, core CPI – which excludes volatile fresh food prices – eased more than expected, from an 11-month high of 2.5% touched in January to the 2.2% YoY rate during the reported month.
- Furthermore, a core gauge that excludes both fresh food and energy prices, and is watched as a gauge of underlying inflation by the BoJ, came in at 1.9%, matching the previous month's reading.
- Separately, Japan's Industrial Production fell by 1.1% MoM in January. This follows a 0.2% decrease in the previous month and marks the third consecutive month of decline in industrial output.
- Investors, however, seem convinced that the BoJ will hike interest rates further, which, along with the risk-off mood, boosts the safe-haven Japanese Yen during the Asian session on Friday.
- The US Dollar stands firm near the weekly top in the wake of Thursday's data, showing that inflationary pressures continue to rise and backing the case for the Federal Reserve to hold steady.
- The second reading of the US Gross Domestic Product showed that the economy expanded by a 2.3% annualized pace during the final quarter of 2024, matching the original estimate.
- Additional details of the report published by the US Bureau of Economic Analysis revealed that the GDP Price Index rose 2.4% compared to the initial estimate of 2.2%.
- This comes on top of worries that US President Donald Trump's policies would reignite inflation and put additional pressure on the Federal Reserve to stick to its hawkish stance.
- Kansas City Fed President Jeff Schmid said that recent surveys indicate a rise in consumer inflation expectations and that the central bank must stay focused on fully containing price pressures.
- Cleveland Fed President Beth Hammack noted on Thursday that interest rates are likely on hold for the time being as inflation data starts to pose a growing problem for central policymakers.
- Philadelphia Fed President Patrick Harker noted that progress toward the 2% inflation target has slowed and that the policy rate remains restrictive to continue putting downward pressure on inflation.
- Investors now look forward to the release of the US Personal Consumption Expenditure (PCE) Price Index for cues about the Fed's rate-cut path, which will drive the buck and the USD/JPY pair.
USD/JPY seems vulnerable to weakening below 149.00 and retesting multi-month lows
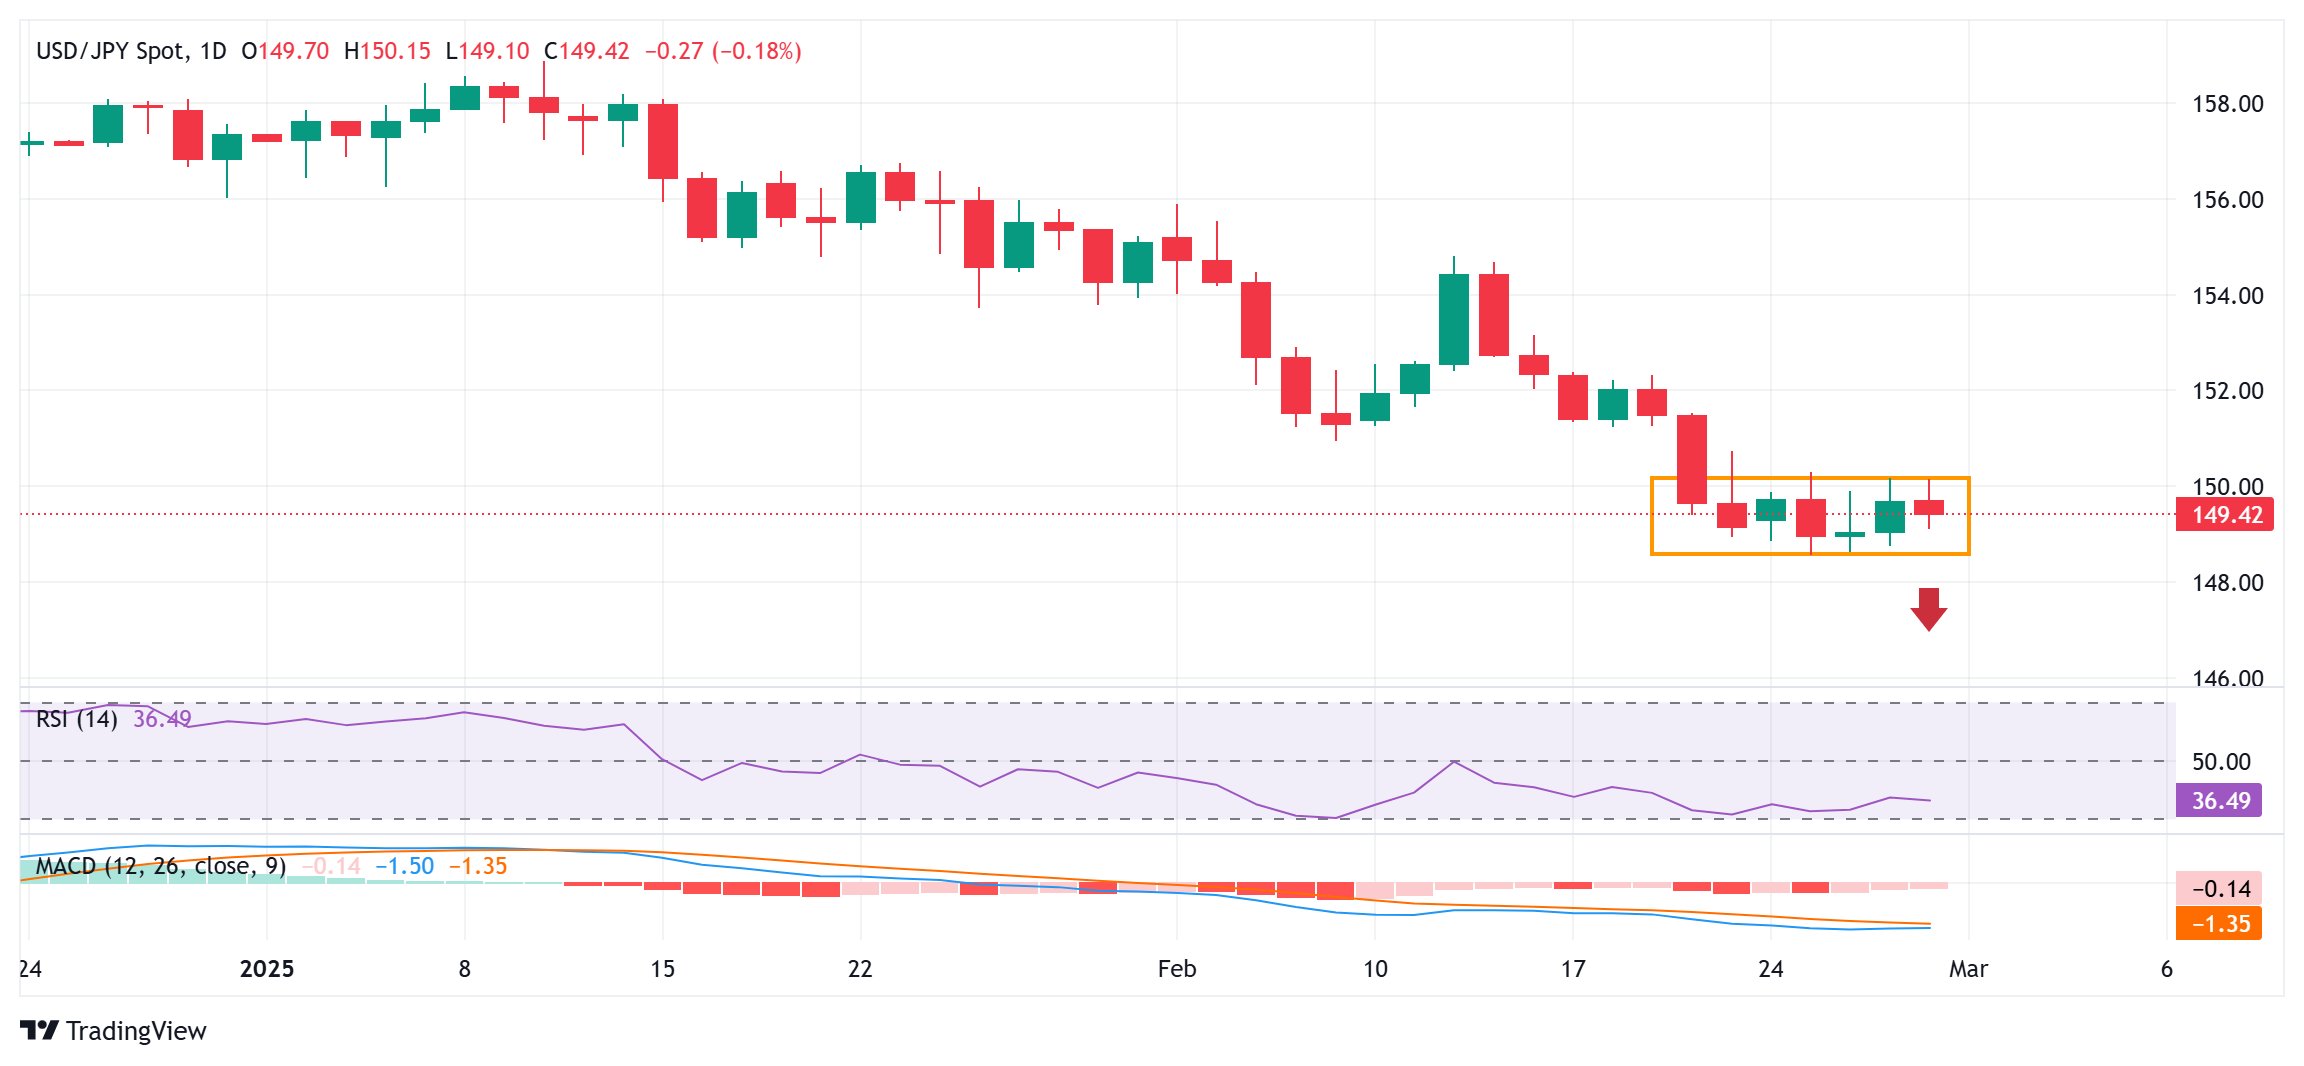
From a technical perspective, spot prices remain confined in a familiar range held since the beginning of this week. Against the backdrop of the recent decline from the vicinity of the 159.00 mark, or the year-to-date high touched in January, the range-bound price action might still be categorized as a bearish consolidation phase. The negative outlook is reinforced by the fact that oscillators on the daily chart are holding deep in negative territory and are still away from being in the oversold zone. This, in turn, suggests that the path of least resistance for the USD/JPY pair is to the downside and supports prospects for deeper losses.
In the meanwhile, the 149.00 round figure now seems to protect the immediate downside ahead of the 148.60-148.55 region, or the multi-month low touched on Tuesday. Some follow-through selling will be seen as a fresh trigger for bearish traders and drag the USD/JPY pair to the 148.00 mark en route to the next relevant support near the 147.35-147.30 area and the 147.00 round figure.
On the flip side, the 148.80 region, followed by the 150.00 psychological mark and the weekly high, around the 150.30 area, might continue to act as an immediate hurdle. A sustained strength beyond the latter, however, could trigger a short-covering rally and lift the USD/JPY pair further towards the 150.90-151.00 horizontal support breakpoint, now turned strong barrier. The momentum could extend further towards the 151.45 region en route to the 152.00 mark, though it is more likely to remain capped near the 152.40 zone. The latter represents the very important 200-day Simple Moving Average (SMA) and should act as a key pivotal point.
Economic Indicator
Tokyo CPI ex Food, Energy (YoY)
The Tokyo Consumer Price Index (CPI), released by the Statistics Bureau of Japan on a monthly basis, measures the price fluctuation of goods and services purchased by households in the Tokyo region. The index is widely considered as a leading indicator of Japan’s overall CPI as it is published weeks before the nationwide reading. The gauge excluding food and energy is widely used to measure underlying inflation trends as these two components are more volatile. The YoY reading compares prices in the reference month to the same month a year earlier. Generally, a high reading is seen as bullish for the Japanese Yen (JPY), while a low reading is seen as bearish.
Read more.Last release: Thu Feb 27, 2025 23:30
Frequency: Monthly
Actual: 2.2%
Consensus: -
Previous: 2.5%
Source: Statistics Bureau of Japan
-
03:30
USD/INR posts modest gains ahead of India’s GDP release
- The Indian Rupee softens in Friday’s Asian session.
- Month-end USD demand and persistent foreign fund outflows weigh on the INR.
- Traders await India’s Q4 GDP data ahead of the US PCE inflation report, which will be released on Friday.
The Indian Rupee (INR) trades with mild losses amid the month-end US Dollar (USD) demand on Friday. The muted trend in domestic markets and persistent foreign fund outflows continue to weigh on investor sentiments, undermining the local currency. Furthermore, the latest tariff announcements from US President Donald Trump have sent shockwaves through global markets, strengthening the Greenback.
Any significant depreciation might be limited amid the likely intervention from the Reserve Bank of India (RBI) in the foreign exchange market via USD sales. Traders will keep an eye on India’s Gross Domestic Product (GDP) for the fourth quarter (Q4), which is due later on Friday. On the US docket, the Personal Consumption Expenditures (PCE) Price Index will be in the spotlight. Also, the Federal Reserve’s (Fed) Thomas Barkin is scheduled to speak later on the same day.Indian Rupee remains weak amid foreign outflows and regional cues
- "We expect the rupee to trade with a negative bias on account of weakness in the domestic markets and sustained outflows by FIIs. Any further pullback in the US dollar may also pressurise the rupee. However, any intervention by the RBI and weakness in crude oil prices may support the rupee at lower levels," said Anuj Choudhary, Research Analyst at Mirae Asset Sharekhan.
- India's GDP is estimated to have grown 6.2% in the three months to December, according to a median estimate of economists surveyed by Bloomberg.
- Trump on Thursday said his proposed 25% tariffs on Mexican and Canadian goods will take effect on March 4, along with an additional 10% duty on Chinese imports because deadly drugs are still pouring into the US from those countries.
- The US Gross Domestic Product (GDP) expanded at an annual rate of 2.3% in the fourth quarter, according to the US Bureau of Economic Analysis (BEA) on Thursday. This figure matched the initial estimate and came in line with the market expectation.
- Philadelphia Fed President Patrick Harker on Thursday expressed support for continuing to hold the interest rate in the current range, which he believes will help get inflation back down to the Fed's 2% target but isn't hurting the job market or the economy more generally.
USD/INR paints a positive picture in the longer term
The Indian Rupee weakens on the day. The strong bullish outlook of the USD/INR pair remains intact as the price remains above the key 100-day Exponential Moving Average (EMA) on the daily timeframe. The upward momentum is supported by the 14-day Relative Strength Index (RSI), which stands above the midline near 63.35, suggesting that the support level is likely to hold rather than break.
The immediate resistance level for the pair emerges at 87.40, the high of February 27. Bullish candlesticks above this level could signal fresh buying demand, potentially pushing the price back to an all-time high near 88.00, en route to 88.50.
On the other hand, the initial support level for USD/INR is seen at 86.48, the low of February 21. If red candlesticks appear, the next stop might be 86.14, the low of January 27, followed by 85.65, the low of January 7.Indian Rupee FAQs
The Indian Rupee (INR) is one of the most sensitive currencies to external factors. The price of Crude Oil (the country is highly dependent on imported Oil), the value of the US Dollar – most trade is conducted in USD – and the level of foreign investment, are all influential. Direct intervention by the Reserve Bank of India (RBI) in FX markets to keep the exchange rate stable, as well as the level of interest rates set by the RBI, are further major influencing factors on the Rupee.
The Reserve Bank of India (RBI) actively intervenes in forex markets to maintain a stable exchange rate, to help facilitate trade. In addition, the RBI tries to maintain the inflation rate at its 4% target by adjusting interest rates. Higher interest rates usually strengthen the Rupee. This is due to the role of the ‘carry trade’ in which investors borrow in countries with lower interest rates so as to place their money in countries’ offering relatively higher interest rates and profit from the difference.
Macroeconomic factors that influence the value of the Rupee include inflation, interest rates, the economic growth rate (GDP), the balance of trade, and inflows from foreign investment. A higher growth rate can lead to more overseas investment, pushing up demand for the Rupee. A less negative balance of trade will eventually lead to a stronger Rupee. Higher interest rates, especially real rates (interest rates less inflation) are also positive for the Rupee. A risk-on environment can lead to greater inflows of Foreign Direct and Indirect Investment (FDI and FII), which also benefit the Rupee.
Higher inflation, particularly, if it is comparatively higher than India’s peers, is generally negative for the currency as it reflects devaluation through oversupply. Inflation also increases the cost of exports, leading to more Rupees being sold to purchase foreign imports, which is Rupee-negative. At the same time, higher inflation usually leads to the Reserve Bank of India (RBI) raising interest rates and this can be positive for the Rupee, due to increased demand from international investors. The opposite effect is true of lower inflation.
-
02:51
Australian Dollar continues losing streak due to Trump tariff threats
- The Australian Dollar weakened as Trump reaffirmed his plan to impose an additional 10% tariff on Chinese imports.
- President Trump introduced new tariffs on Chinese goods on February 4, bringing the total levy to 20%.
- The US GDP Annualized grew by 2.3% in Q4 2024, matching market expectations.
The Australian Dollar (AUD) remains subdued for the sixth consecutive day on Friday. The AUD/USD pair extends its losing streak following US President Donald Trump reiterated on Thursday his proposed 25% tariffs on Mexican and Canadian goods will take effect on March 4, along with an additional 10% duty on Chinese imports because deadly drugs are still pouring into the US from those countries.
President Trump added new tariffs on Chinese goods will be added to the 10% tariffs he imposed on February 4 in response to the fentanyl opioid epidemic, resulting in a cumulative 20% tariff. Any signs of renewed US tariff threats could drag the China-proxy AUD lower as China is a major trading partner to Australia.
The AUD faced challenges following the disappointing Australian Private Capital Expenditure data released on Thursday, which unexpectedly contracted by 0.2% quarter-on-quarter in Q4 2024, missing market forecasts of 0.8% growth. This follows an upwardly revised 1.6% expansion in the previous quarter.
Reserve Bank of Australia Deputy Governor Andrew Hauser said on Thursday that he expects more positive news on inflation but emphasized the importance of seeing this progress materialize first. He noted that the tightness in Australia’s labor market remains a challenge for controlling inflation.
Australian Dollar depreciates due to risk-off mood
- The US Dollar Index (DXY), which measures the USD against six major currencies, gained ground following Thursday's release of Gross Domestic Product Annualized (Q4). The DXY rises above 107.00 at the time of writing.
- US GDP Annualized expanded by 2.3% in the fourth quarter of 2024. This figure matched the initial estimate and came in line with the market expectation.
- Federal Reserve Bank of Atlanta President Raphael Bostic said late Wednesday that the Fed should hold interest rates where they are, at a level that continues to put downward pressure on inflation, per Bloomberg.
- US Commerce Secretary Howard Lutnick said late Wednesday that April 3 serves as the baseline for reciprocal tariff data. Lutnick also stated that he would not allow Chinese vehicles in the US, citing China as his major concern.
- US Treasury Secretary Scott Bessent expressed his commitment to working with Congress to make President Trump's tax cuts permanent.
- The White House said late Wednesday that US President Donald Trump issued an executive order aimed at implementing the Department of Government Efficiency's (DOGE) cost-cutting drive, per Reuters. The executive order requires agencies to justify spending, limit travel, and identify surplus federal properties that can be sold.
- President Trump signed a memorandum on Friday instructing the Committee on Foreign Investment in the United States (CFIUS) to limit Chinese investments in strategic sectors. Reuters cited a White House official saying that the national security memorandum seeks to encourage foreign investment while safeguarding US national security interests from potential threats posed by foreign adversaries like China.
- The People’s Bank of China (PBOC) injected CNY300 billion on Tuesday via the one-year Medium-term Lending Facility (MLF), maintaining the rate at 2%. Additionally, the PBOC injected CNY318.5 billion through seven-day reverse repos at 1.50%, consistent with the prior rate.
- According to a Wall Street Journal report on the Australian Dollar’s outlook from the Commonwealth Bank of Australia (CBA), heightened trade war risks driven by Trump have become a major concern. China’s response to these trade threats will be a key factor shaping the future performance of the AUD.
- On Thursday, Lu Lei, Deputy Governor of the People's Bank of China (PBOC), proposed that the Bank should take an active role in supporting fundraising efforts, including issuing special treasury bonds, to help major state-owned banks strengthen their Common Equity Tier 1 (CET1) capital. Note that any change in the Chinese economy could impact the AUD as China and Australia are close trading partners.
- The Reserve Bank of Australia (RBA) lowered its Official Cash Rate (OCR) by 25 basis points to 4.10% last week—the first rate cut in four years. Reserve Bank of Australia (RBA) Governor Michele Bullock acknowledged the impact of high interest rates but cautioned that it was too soon to declare victory over inflation. She also emphasized the labor market's strength and clarified that future rate cuts are not guaranteed, despite market expectations.
Australian Dollar tests 0.6200 support as a bearish bias strengthens
AUD/USD trades around 0.6220 on Friday. Analysis of the daily chart indicates that the pair stays below the nine- and 14-day Exponential Moving Averages (EMAs), signaling weakening short-term price momentum. Moreover, the 14-day Relative Strength Index (RSI) remains below 50, reinforcing the prevailing bearish outlook.
The AUD/USD pair tests immediate support at the psychological level of 0.6200. A break below this threshold could push the pair toward the 0.6087 region, its lowest level since April 2020, recorded on February 3.
On the upside, the AUD/USD pair may face immediate resistance at the nine-day EMA of 0.6297, followed by the 14-day EMA at 0.6302. A decisive break above these levels could strengthen short-term price momentum, paving the way for the pair to challenge the two-month high of 0.6408, reached on February 21.
AUD/USD: Daily Chart
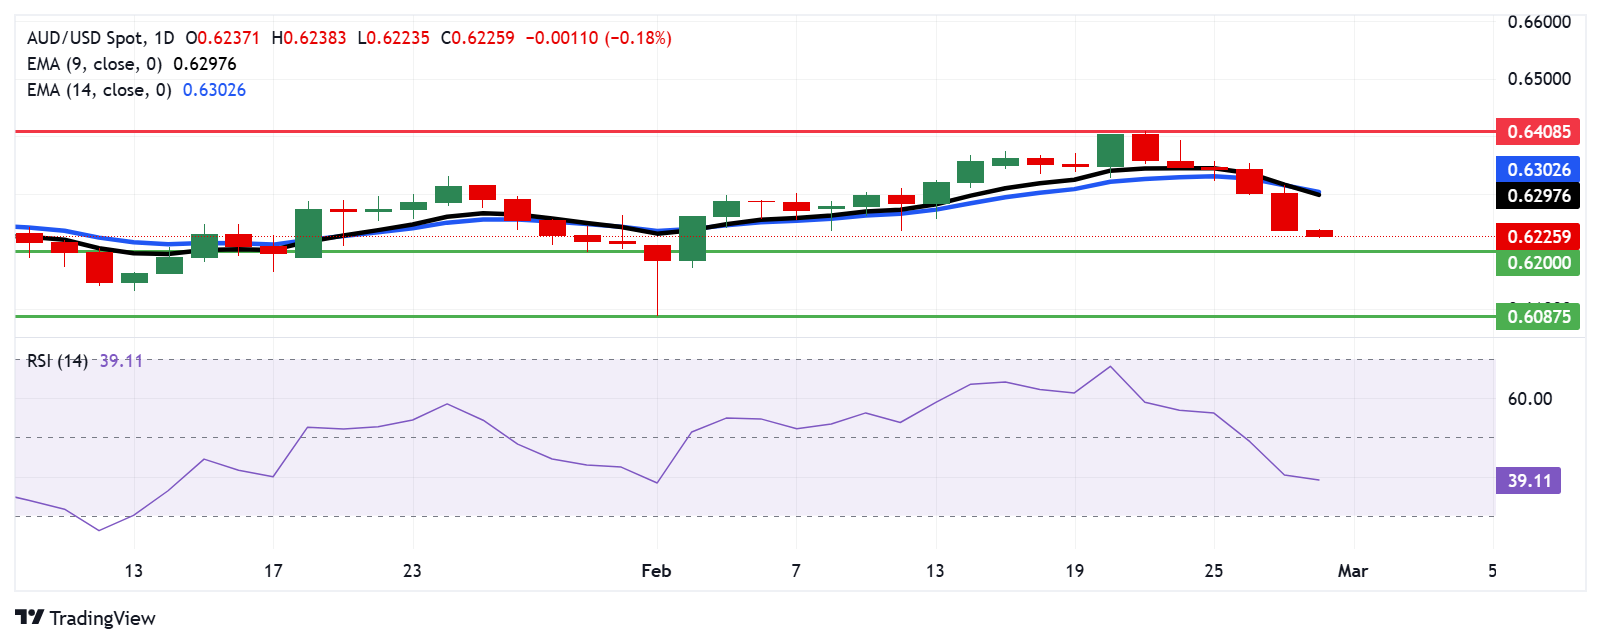
Australian Dollar PRICE Today
The table below shows the percentage change of Australian Dollar (AUD) against listed major currencies today. Australian Dollar was the weakest against the Japanese Yen.
USD EUR GBP JPY CAD AUD NZD CHF USD 0.12% 0.09% -0.18% -0.03% 0.13% 0.27% -0.04% EUR -0.12% -0.03% -0.31% -0.15% 0.00% 0.15% -0.17% GBP -0.09% 0.03% -0.28% -0.12% 0.03% 0.18% -0.14% JPY 0.18% 0.31% 0.28% 0.17% 0.30% 0.44% 0.14% CAD 0.03% 0.15% 0.12% -0.17% 0.14% 0.30% -0.02% AUD -0.13% -0.00% -0.03% -0.30% -0.14% 0.15% -0.15% NZD -0.27% -0.15% -0.18% -0.44% -0.30% -0.15% -0.31% CHF 0.04% 0.17% 0.14% -0.14% 0.02% 0.15% 0.31% The heat map shows percentage changes of major currencies against each other. The base currency is picked from the left column, while the quote currency is picked from the top row. For example, if you pick the Australian Dollar from the left column and move along the horizontal line to the US Dollar, the percentage change displayed in the box will represent AUD (base)/USD (quote).
Australian Dollar FAQs
One of the most significant factors for the Australian Dollar (AUD) is the level of interest rates set by the Reserve Bank of Australia (RBA). Because Australia is a resource-rich country another key driver is the price of its biggest export, Iron Ore. The health of the Chinese economy, its largest trading partner, is a factor, as well as inflation in Australia, its growth rate and Trade Balance. Market sentiment – whether investors are taking on more risky assets (risk-on) or seeking safe-havens (risk-off) – is also a factor, with risk-on positive for AUD.
The Reserve Bank of Australia (RBA) influences the Australian Dollar (AUD) by setting the level of interest rates that Australian banks can lend to each other. This influences the level of interest rates in the economy as a whole. The main goal of the RBA is to maintain a stable inflation rate of 2-3% by adjusting interest rates up or down. Relatively high interest rates compared to other major central banks support the AUD, and the opposite for relatively low. The RBA can also use quantitative easing and tightening to influence credit conditions, with the former AUD-negative and the latter AUD-positive.
China is Australia’s largest trading partner so the health of the Chinese economy is a major influence on the value of the Australian Dollar (AUD). When the Chinese economy is doing well it purchases more raw materials, goods and services from Australia, lifting demand for the AUD, and pushing up its value. The opposite is the case when the Chinese economy is not growing as fast as expected. Positive or negative surprises in Chinese growth data, therefore, often have a direct impact on the Australian Dollar and its pairs.
Iron Ore is Australia’s largest export, accounting for $118 billion a year according to data from 2021, with China as its primary destination. The price of Iron Ore, therefore, can be a driver of the Australian Dollar. Generally, if the price of Iron Ore rises, AUD also goes up, as aggregate demand for the currency increases. The opposite is the case if the price of Iron Ore falls. Higher Iron Ore prices also tend to result in a greater likelihood of a positive Trade Balance for Australia, which is also positive of the AUD.
The Trade Balance, which is the difference between what a country earns from its exports versus what it pays for its imports, is another factor that can influence the value of the Australian Dollar. If Australia produces highly sought after exports, then its currency will gain in value purely from the surplus demand created from foreign buyers seeking to purchase its exports versus what it spends to purchase imports. Therefore, a positive net Trade Balance strengthens the AUD, with the opposite effect if the Trade Balance is negative.
-
02:15
PBOC sets USD/CNY reference rate at 7.1738 vs. 7.1740 previous
The People’s Bank of China (PBOC) set the USD/CNY central rate for the trading session ahead on Friday at 7.1738 as compared to the previous day's fix of 7.1740 and 7.2873 Reuters estimates.
PBOC FAQs
The primary monetary policy objectives of the People's Bank of China (PBoC) are to safeguard price stability, including exchange rate stability, and promote economic growth. China’s central bank also aims to implement financial reforms, such as opening and developing the financial market.
The PBoC is owned by the state of the People's Republic of China (PRC), so it is not considered an autonomous institution. The Chinese Communist Party (CCP) Committee Secretary, nominated by the Chairman of the State Council, has a key influence on the PBoC’s management and direction, not the governor. However, Mr. Pan Gongsheng currently holds both of these posts.
Unlike the Western economies, the PBoC uses a broader set of monetary policy instruments to achieve its objectives. The primary tools include a seven-day Reverse Repo Rate (RRR), Medium-term Lending Facility (MLF), foreign exchange interventions and Reserve Requirement Ratio (RRR). However, The Loan Prime Rate (LPR) is China’s benchmark interest rate. Changes to the LPR directly influence the rates that need to be paid in the market for loans and mortgages and the interest paid on savings. By changing the LPR, China’s central bank can also influence the exchange rates of the Chinese Renminbi.
Yes, China has 19 private banks – a small fraction of the financial system. The largest private banks are digital lenders WeBank and MYbank, which are backed by tech giants Tencent and Ant Group, per The Straits Times. In 2014, China allowed domestic lenders fully capitalized by private funds to operate in the state-dominated financial sector.
-
01:56
NZD/USD attracts some sellers below 0.5650 on tariff concerns
- NZD/USD faces some selling pressure to around 0.5620 in Friday’s early Asian session, down 0.20% on the day.
- Trump vowed March 4 tariffs for Mexico, Canada and an extra 10% for China over fentanyl.
- The US economy grew at a 2.3% annualized pace in Q4, matching estimates.
The NZD/USD pair extends its decline to near 0.5625 during the early Asian session on Friday. The concerns about US President Donald Trump’s tariffs exert some selling pressure on the New Zealand Dollar (NZD). Later on Friday, the US Personal Consumption Expenditures (PCE) Price Index data for January will be in the spotlight.
Trump on Thursday said his proposed 25% tariffs on Mexican and Canadian goods will take effect on March 4, along with an additional 10% duty on Chinese imports because deadly drugs are still pouring into the US from those countries.
Trump added the new tariffs on Chinese goods will be added to the 10% tariffs he imposed on February 4 in response to the fentanyl opioid epidemic, resulting in a cumulative 20% tariff. Any signs of renewed US tariff threats could drag the China-proxy Kiwi lower as China is a major trading partner to New Zealand.
The US Bureau of Economic Analysis (BEA) revealed on Thursday that the US Gross Domestic Product (GDP) expanded at an annual rate of 2.3% in the fourth quarter. This figure matched the initial estimate and came in line with the market expectation. The Greenback edged higher in an immediate reaction to the GDP data.New Zealand Dollar FAQs
The New Zealand Dollar (NZD), also known as the Kiwi, is a well-known traded currency among investors. Its value is broadly determined by the health of the New Zealand economy and the country’s central bank policy. Still, there are some unique particularities that also can make NZD move. The performance of the Chinese economy tends to move the Kiwi because China is New Zealand’s biggest trading partner. Bad news for the Chinese economy likely means less New Zealand exports to the country, hitting the economy and thus its currency. Another factor moving NZD is dairy prices as the dairy industry is New Zealand’s main export. High dairy prices boost export income, contributing positively to the economy and thus to the NZD.
The Reserve Bank of New Zealand (RBNZ) aims to achieve and maintain an inflation rate between 1% and 3% over the medium term, with a focus to keep it near the 2% mid-point. To this end, the bank sets an appropriate level of interest rates. When inflation is too high, the RBNZ will increase interest rates to cool the economy, but the move will also make bond yields higher, increasing investors’ appeal to invest in the country and thus boosting NZD. On the contrary, lower interest rates tend to weaken NZD. The so-called rate differential, or how rates in New Zealand are or are expected to be compared to the ones set by the US Federal Reserve, can also play a key role in moving the NZD/USD pair.
Macroeconomic data releases in New Zealand are key to assess the state of the economy and can impact the New Zealand Dollar’s (NZD) valuation. A strong economy, based on high economic growth, low unemployment and high confidence is good for NZD. High economic growth attracts foreign investment and may encourage the Reserve Bank of New Zealand to increase interest rates, if this economic strength comes together with elevated inflation. Conversely, if economic data is weak, NZD is likely to depreciate.
The New Zealand Dollar (NZD) tends to strengthen during risk-on periods, or when investors perceive that broader market risks are low and are optimistic about growth. This tends to lead to a more favorable outlook for commodities and so-called ‘commodity currencies’ such as the Kiwi. Conversely, NZD tends to weaken at times of market turbulence or economic uncertainty as investors tend to sell higher-risk assets and flee to the more-stable safe havens.
-
01:56
NZD/USD attracts some sellers below 0.5650 on tariff concerns
- NZD/USD faces some selling pressure to around 0.5620 in Friday’s early Asian session, down 0.20% on the day.
- Trump vowed March 4 tariffs for Mexico, Canada and an extra 10% for China over fentanyl.
- The US economy grew at a 2.3% annualized pace in Q4, matching estimates.
The NZD/USD pair extends its decline to near 0.5625 during the early Asian session on Friday. The concerns about US President Donald Trump’s tariffs exert some selling pressure on the New Zealand Dollar (NZD). Later on Friday, the US Personal Consumption Expenditures (PCE) Price Index data for January will be in the spotlight.
Trump on Thursday said his proposed 25% tariffs on Mexican and Canadian goods will take effect on March 4, along with an additional 10% duty on Chinese imports because deadly drugs are still pouring into the US from those countries.
Trump added the new tariffs on Chinese goods will be added to the 10% tariffs he imposed on February 4 in response to the fentanyl opioid epidemic, resulting in a cumulative 20% tariff. Any signs of renewed US tariff threats could drag the China-proxy Kiwi lower as China is a major trading partner to New Zealand.
The US Bureau of Economic Analysis (BEA) revealed on Thursday that the US Gross Domestic Product (GDP) expanded at an annual rate of 2.3% in the fourth quarter. This figure matched the initial estimate and came in line with the market expectation.New Zealand Dollar FAQs
The New Zealand Dollar (NZD), also known as the Kiwi, is a well-known traded currency among investors. Its value is broadly determined by the health of the New Zealand economy and the country’s central bank policy. Still, there are some unique particularities that also can make NZD move. The performance of the Chinese economy tends to move the Kiwi because China is New Zealand’s biggest trading partner. Bad news for the Chinese economy likely means less New Zealand exports to the country, hitting the economy and thus its currency. Another factor moving NZD is dairy prices as the dairy industry is New Zealand’s main export. High dairy prices boost export income, contributing positively to the economy and thus to the NZD.
The Reserve Bank of New Zealand (RBNZ) aims to achieve and maintain an inflation rate between 1% and 3% over the medium term, with a focus to keep it near the 2% mid-point. To this end, the bank sets an appropriate level of interest rates. When inflation is too high, the RBNZ will increase interest rates to cool the economy, but the move will also make bond yields higher, increasing investors’ appeal to invest in the country and thus boosting NZD. On the contrary, lower interest rates tend to weaken NZD. The so-called rate differential, or how rates in New Zealand are or are expected to be compared to the ones set by the US Federal Reserve, can also play a key role in moving the NZD/USD pair.
Macroeconomic data releases in New Zealand are key to assess the state of the economy and can impact the New Zealand Dollar’s (NZD) valuation. A strong economy, based on high economic growth, low unemployment and high confidence is good for NZD. High economic growth attracts foreign investment and may encourage the Reserve Bank of New Zealand to increase interest rates, if this economic strength comes together with elevated inflation. Conversely, if economic data is weak, NZD is likely to depreciate.
The New Zealand Dollar (NZD) tends to strengthen during risk-on periods, or when investors perceive that broader market risks are low and are optimistic about growth. This tends to lead to a more favorable outlook for commodities and so-called ‘commodity currencies’ such as the Kiwi. Conversely, NZD tends to weaken at times of market turbulence or economic uncertainty as investors tend to sell higher-risk assets and flee to the more-stable safe havens.
-
01:31
Australia Private Sector Credit (YoY) remains at 6.5% in January
-
01:31
Australia Private Sector Credit (YoY) remains at 6.5% in January
-
01:31
Australia Private Sector Credit (MoM) below expectations (0.6%) in January: Actual (0.5%)
-
01:31
Australia Private Sector Credit (MoM) below expectations (0.6%) in January: Actual (0.5%)
-
01:22
BoJ's Uchida: Japan's economy is on a moderate recovery path
Bank of Japan Deputy Governor Shinichi Uchida said on Friday that Japan's economy is experiencing a moderate recovery, though some weaknesses persist.
Key quotes
Japan's economy is experiencing a moderate recovery, though some weaknesses persist.
The underlying inflation rate is gradually rising toward the 2% target.
The Bank of Japan's JGB holdings continue to provide a strong monetary easing effect.Market reaction
At the time of writing, the USD/JPY pair is trading 0.07% higher on the day to trade at 149.78.
Bank of Japan FAQs
The Bank of Japan (BoJ) is the Japanese central bank, which sets monetary policy in the country. Its mandate is to issue banknotes and carry out currency and monetary control to ensure price stability, which means an inflation target of around 2%.
The Bank of Japan embarked in an ultra-loose monetary policy in 2013 in order to stimulate the economy and fuel inflation amid a low-inflationary environment. The bank’s policy is based on Quantitative and Qualitative Easing (QQE), or printing notes to buy assets such as government or corporate bonds to provide liquidity. In 2016, the bank doubled down on its strategy and further loosened policy by first introducing negative interest rates and then directly controlling the yield of its 10-year government bonds. In March 2024, the BoJ lifted interest rates, effectively retreating from the ultra-loose monetary policy stance.
The Bank’s massive stimulus caused the Yen to depreciate against its main currency peers. This process exacerbated in 2022 and 2023 due to an increasing policy divergence between the Bank of Japan and other main central banks, which opted to increase interest rates sharply to fight decades-high levels of inflation. The BoJ’s policy led to a widening differential with other currencies, dragging down the value of the Yen. This trend partly reversed in 2024, when the BoJ decided to abandon its ultra-loose policy stance.
A weaker Yen and the spike in global energy prices led to an increase in Japanese inflation, which exceeded the BoJ’s 2% target. The prospect of rising salaries in the country – a key element fuelling inflation – also contributed to the move.
-
01:15
Currencies. Daily history for Thursday, February 27, 2025
Pare Closed Change, % AUDUSD 0.62344 -1.08 EURJPY 155.753 -0.32 EURUSD 1.03966 -0.82 GBPJPY 188.743 -0.13 GBPUSD 1.25991 -0.6 NZDUSD 0.563 -1.14 USDCAD 1.44405 0.74 USDCHF 0.89964 0.73 USDJPY 149.8 0.5 -
01:12
US Treasury Secretary Bessent: Open to the idea that other countries tariffs could come down or go away
US Treasury Secretary Scott Bessent said late Thursday that he opened to the idea that other countries' tariffs could come down or go away.
Key quotes
Open to the idea that other countries' tariffs could come down or go away.
Ukraine critical minerals deal is done, there is no more negotiation on that.
Ukraine deal covers critical minerals, oil and gas, and infrastructure assets.
Ukraine deal shows the American people that we have not squandered their money.Market reaction
At the time of writing, the US Dollar Index (DXY) is trading 0.03% higher on the day to trade at 107.32.
US Dollar FAQs
The US Dollar (USD) is the official currency of the United States of America, and the ‘de facto’ currency of a significant number of other countries where it is found in circulation alongside local notes. It is the most heavily traded currency in the world, accounting for over 88% of all global foreign exchange turnover, or an average of $6.6 trillion in transactions per day, according to data from 2022. Following the second world war, the USD took over from the British Pound as the world’s reserve currency. For most of its history, the US Dollar was backed by Gold, until the Bretton Woods Agreement in 1971 when the Gold Standard went away.
The most important single factor impacting on the value of the US Dollar is monetary policy, which is shaped by the Federal Reserve (Fed). The Fed has two mandates: to achieve price stability (control inflation) and foster full employment. Its primary tool to achieve these two goals is by adjusting interest rates. When prices are rising too quickly and inflation is above the Fed’s 2% target, the Fed will raise rates, which helps the USD value. When inflation falls below 2% or the Unemployment Rate is too high, the Fed may lower interest rates, which weighs on the Greenback.
In extreme situations, the Federal Reserve can also print more Dollars and enact quantitative easing (QE). QE is the process by which the Fed substantially increases the flow of credit in a stuck financial system. It is a non-standard policy measure used when credit has dried up because banks will not lend to each other (out of the fear of counterparty default). It is a last resort when simply lowering interest rates is unlikely to achieve the necessary result. It was the Fed’s weapon of choice to combat the credit crunch that occurred during the Great Financial Crisis in 2008. It involves the Fed printing more Dollars and using them to buy US government bonds predominantly from financial institutions. QE usually leads to a weaker US Dollar.
Quantitative tightening (QT) is the reverse process whereby the Federal Reserve stops buying bonds from financial institutions and does not reinvest the principal from the bonds it holds maturing in new purchases. It is usually positive for the US Dollar.
-
01:00
Japan's Tokyo CPI inflation eases to 2.9% YoY in February vs. 3.4% prior
The headline Tokyo Consumer Price Index (CPI) for February climbed 2.9% YoY as compared to 3.4% in the previous month, the Statistics Bureau of Japan showed on Friday. Meanwhile, the Tokyo CPI ex Fresh Food, Energy came in at 2.2% in February vs. 2.5% in January.
Additionally, Tokyo CPI ex Fresh Food rose 2.2% YoY in February against 2.3% expected and down from 2.5% in the prior month.Market reaction to the Tokyo Consumer Price Index
As of writing, the USD/JPY pair was up 0.25% on the day at 150.05.
Japanese Yen FAQs
The Japanese Yen (JPY) is one of the world’s most traded currencies. Its value is broadly determined by the performance of the Japanese economy, but more specifically by the Bank of Japan’s policy, the differential between Japanese and US bond yields, or risk sentiment among traders, among other factors.
One of the Bank of Japan’s mandates is currency control, so its moves are key for the Yen. The BoJ has directly intervened in currency markets sometimes, generally to lower the value of the Yen, although it refrains from doing it often due to political concerns of its main trading partners. The BoJ ultra-loose monetary policy between 2013 and 2024 caused the Yen to depreciate against its main currency peers due to an increasing policy divergence between the Bank of Japan and other main central banks. More recently, the gradually unwinding of this ultra-loose policy has given some support to the Yen.
Over the last decade, the BoJ’s stance of sticking to ultra-loose monetary policy has led to a widening policy divergence with other central banks, particularly with the US Federal Reserve. This supported a widening of the differential between the 10-year US and Japanese bonds, which favored the US Dollar against the Japanese Yen. The BoJ decision in 2024 to gradually abandon the ultra-loose policy, coupled with interest-rate cuts in other major central banks, is narrowing this differential.
The Japanese Yen is often seen as a safe-haven investment. This means that in times of market stress, investors are more likely to put their money in the Japanese currency due to its supposed reliability and stability. Turbulent times are likely to strengthen the Yen’s value against other currencies seen as more risky to invest in.
-
00:57
Japan Large Retailer Sales up to 4% in January from previous 3%
-
00:53
Japan Retail Trade s.a (MoM) increased to 0.5% in January from previous -0.7%
-
00:51
Japan Industrial Production (YoY) came in at 2.6%, above forecasts (-1.2%) in January
-
00:50
Japan Foreign Investment in Japan Stocks declined to ¥-1038B in February 21 from previous ¥-352.8B
-
00:50
Japan Retail Trade (YoY) below forecasts (4%) in January: Actual (3.9%)
-
00:50
EUR/USD backslides as fresh tariff threats weigh on Euro
- EUR/USD fell 0.85% on Thursday after Trump reiterated tariff threats.
- Risk sentiment got knocked lower after Trump pivoted on his own tariff timeline.
- US data also soured, pointing toward a general slowdown and rising inflation pressures.
EUR/USD took a leg lower on Thursday, falling nearly nine-tenths of one percent and slipping back below 1.0400 for the first time in almost two weeks. A weak technical stance has been developing in the Fiber pair, and a fresh threat of US tariffs on European goods is weighing further on bids.
European tariff threats back on the forefront
Mere hours after affirming that threatened tariffs would begin in April, US President Donald Trump surprised markets by pivoting once again on when he thinks he’ll be imposing import taxes on a wide swath of the US’ closest trade partners. According to President Trump, tariffs aimed squarely at Canada and Mexico are still set to proceed next week, beginning on March 4.
On top of steep tariffs aimed at close US allies, President Trump took the opportunity to inform his social media followers that Europe has treated the US “very badly” on trade, possibly alluding to his administration’s insistence that European VAT taxes are a sort of tariff on US goods. Further “reciprocal” tariffs are still planned to take effect in early April, with a batch of tariffs aimed specifically at the EU.
US data hints at more inflation on the cards
US GDP growth for Q4 surpassed forecasts, and Durable Goods spending increased faster than expected in January. GDP rose to 2.4% QoQ, above the 2.2% expectation, while the annualized figure remained stable at 2.3%.
Durable Goods Orders surged to 3.1% MoM in January, exceeding expectations of 2.0% and recovering from a revised -1.8%. However, much of this increase results from businesses stocking up ahead of possible tariffs, and rising inflation may be artificially inflating the figures, posing future challenges. The increase in Durable Goods Orders primarily came from the transportation sector due to a surge in Boeing bookings and automotive vehicles. Excluding these factors, orders were flat at 0.0% in January, missing the 0.3% forecast and falling short of the revised 0.1%.
US PCEPI inflation data is expected Friday. Thursday’s preview suggests an unfavorable outlook for investors hoping the recent rise in headline inflation is temporary. QoQ Core PCE rose to 2.7%, up from the expected 2.5%.
EUR/USD price forecast
EUR/USD's Thursday downturn puts Fiber back on the bearish side of the 50-day Exponential Moving Average (EMA) at 1.0444, pushing intraday bids back below 1.0400. Momentum has pivoted sharply bearish, and price action is poised for an extended backslide to the last swing low near the 1.0300 handle.
EUR/USD daily chart
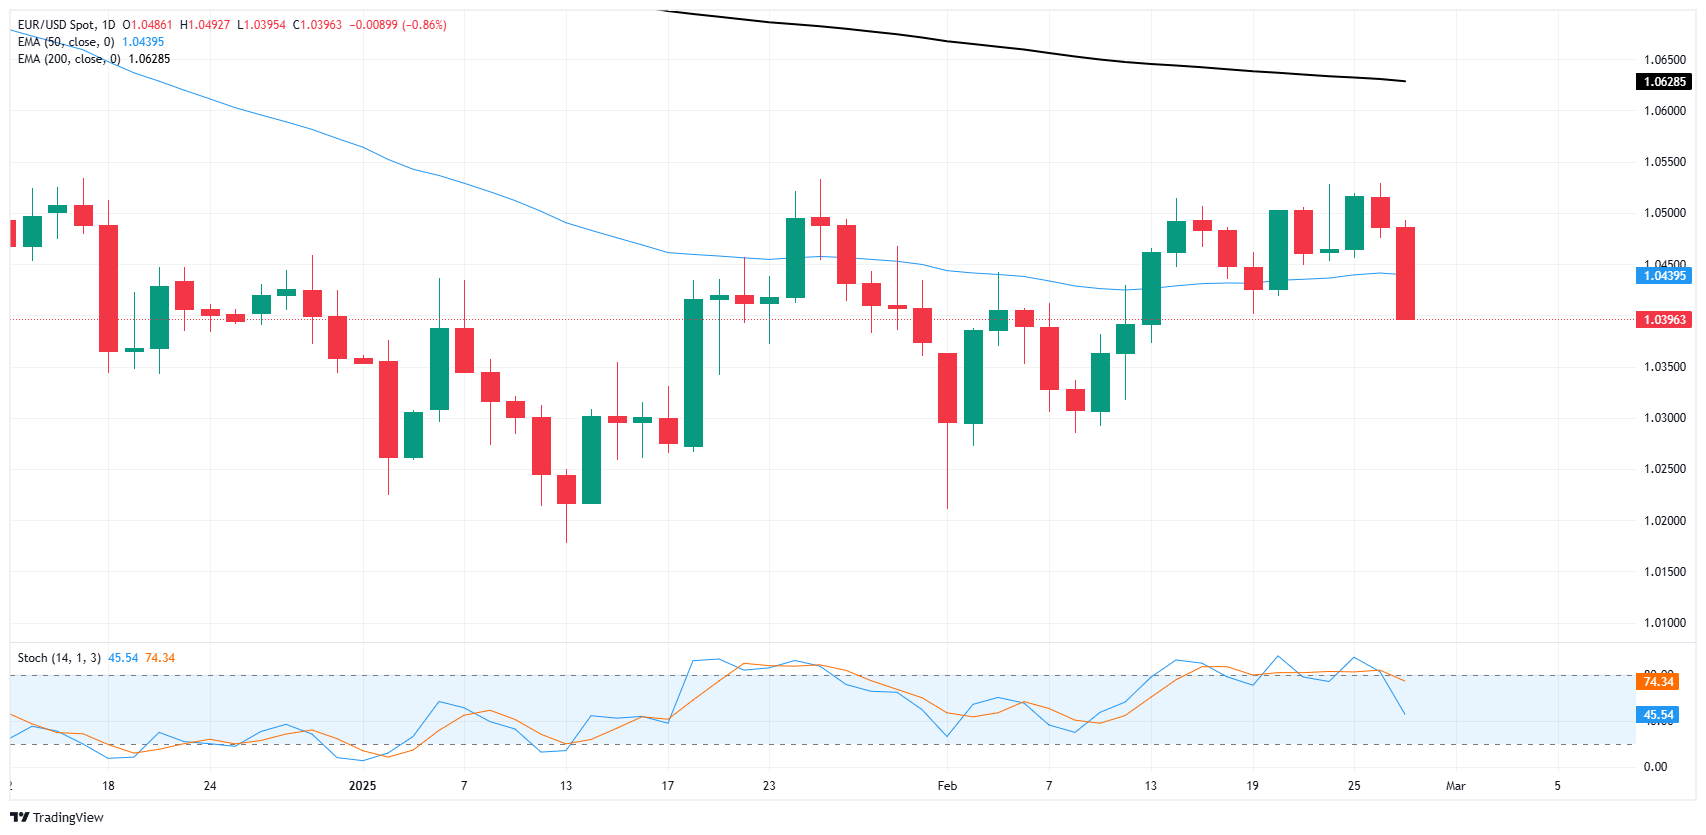
Euro FAQs
The Euro is the currency for the 19 European Union countries that belong to the Eurozone. It is the second most heavily traded currency in the world behind the US Dollar. In 2022, it accounted for 31% of all foreign exchange transactions, with an average daily turnover of over $2.2 trillion a day. EUR/USD is the most heavily traded currency pair in the world, accounting for an estimated 30% off all transactions, followed by EUR/JPY (4%), EUR/GBP (3%) and EUR/AUD (2%).
The European Central Bank (ECB) in Frankfurt, Germany, is the reserve bank for the Eurozone. The ECB sets interest rates and manages monetary policy. The ECB’s primary mandate is to maintain price stability, which means either controlling inflation or stimulating growth. Its primary tool is the raising or lowering of interest rates. Relatively high interest rates – or the expectation of higher rates – will usually benefit the Euro and vice versa. The ECB Governing Council makes monetary policy decisions at meetings held eight times a year. Decisions are made by heads of the Eurozone national banks and six permanent members, including the President of the ECB, Christine Lagarde.
Eurozone inflation data, measured by the Harmonized Index of Consumer Prices (HICP), is an important econometric for the Euro. If inflation rises more than expected, especially if above the ECB’s 2% target, it obliges the ECB to raise interest rates to bring it back under control. Relatively high interest rates compared to its counterparts will usually benefit the Euro, as it makes the region more attractive as a place for global investors to park their money.
Data releases gauge the health of the economy and can impact on the Euro. Indicators such as GDP, Manufacturing and Services PMIs, employment, and consumer sentiment surveys can all influence the direction of the single currency. A strong economy is good for the Euro. Not only does it attract more foreign investment but it may encourage the ECB to put up interest rates, which will directly strengthen the Euro. Otherwise, if economic data is weak, the Euro is likely to fall. Economic data for the four largest economies in the euro area (Germany, France, Italy and Spain) are especially significant, as they account for 75% of the Eurozone’s economy.
Another significant data release for the Euro is the Trade Balance. This indicator measures the difference between what a country earns from its exports and what it spends on imports over a given period. If a country produces highly sought after exports then its currency will gain in value purely from the extra demand created from foreign buyers seeking to purchase these goods. Therefore, a positive net Trade Balance strengthens a currency and vice versa for a negative balance.
-
00:50
Japan Industrial Production (MoM) came in at -1.1%, below expectations (-1%) in January
-
00:50
Japan Foreign Investment in Japan Stocks climbed from previous ¥-352.8B to ¥-1B in February 21
-
00:30
Japan Tokyo CPI ex Food, Energy (YoY) fell from previous 2.5% to 2.2% in February
-
00:30
Japan Tokyo Consumer Price Index (YoY) down to 2.9% in February from previous 3.4%
-
00:30
Japan Tokyo CPI ex Fresh Food (YoY) came in at 2.2% below forecasts (2.3%) in February
-
00:28
GBP/USD tumbles as tariffs on UK come into play
- GBP/USD shed 0.56% on Thursday, falling to 1.2600.
- US President Donald Trump has tabled tariffs on the UK following a meet with PM Starmer.
- US data is tilted to the downside as economic slowdown fears grow.
GBP/USD turned south and tumbled on Thursday, falling nearly six-tenths of a percent and sending bids skidding back into the 1.2600 handle. Risk sentiment is souring after a batch of US data points toward a general lack of strength within the US economy, as well as flagging an extended uptick in core US inflation pressures.
Pound traders can no longer bank on UK avoiding tariff talk
US President Donald Trump met with UK Prime Minister Keir Starmer late Thursday, and President Trump was quick to announce that there might be trade tariffs imposed on the UK as well unless ambiguous terms of a trade deal with the US are reached within an unspecified timeframe. Following on the heels of Donald Trump’s latest pivot on tariffs due on Canada and Mexico, the timing is poor as investors grapple with further geopolitical turmoil on the road ahead.
US Gross Domestic Product (GDP) growth in the fourth quarter exceeded expectations at the beginning of the curve, while Durable Goods spending increased more than anticipated in January. The US GDP rose to 2.4% quarter-over-quarter, surpassing the forecasted 2.2%, although the annualized rate remained stable at 2.3%.
US Durable Goods Orders surged by 3.1% month-over-month in January, exceeding the expected 2.0% and significantly improving from the revised previous figure of -1.8%. While this is a positive sign for economists, there are concerns: a substantial portion of this increase is likely due to businesses stockpiling their inventories in anticipation of potential tariffs, and the recent rise in inflation could be inflating these figures artificially, leading to possible challenges later.
US data headed for another inflation uptick
It’s important to highlight that much of the increase in Durable Goods Orders is attributed to the transportation sector, buoyed by a significant rise in bookings for Boeing (BA) planes and automotive vehicles. Excluding these influences, US Durable Goods Orders remained flat at 0.0% in January, which fell short of the 0.3% forecast and below the revised prior figure of 0.1%.
The US Personal Consumption Expenditure Price Index (PCEPI) inflation report is set to be released on Friday, but the Thursday preview offers bleak prospects for investors hoping that the recent rise in inflation will be short-lived. The quarter-over-quarter Core PCE, serving as a preview for Friday’s primary inflation report, accelerated to 2.7%, up from the anticipated steady figure of 2.5%.
GBP/USD price forecast
GBP/USD’s latest downturn puts price action on the low end of a near-term consolidation pattern baked in just south of the 200-day Exponential Moving Average (EMA) near 1.2680, and short pressure is mounting as technical oscillators roll over in overbought territory. Despite the pair holding firm on the high end of a bullish recovery from the last major swing low into the 1.2100 handle in January, odds are favoring the downside assuming bids are able to crack the 50-day EMA near 1.2535 and head lower.
GBP/USD daily chart
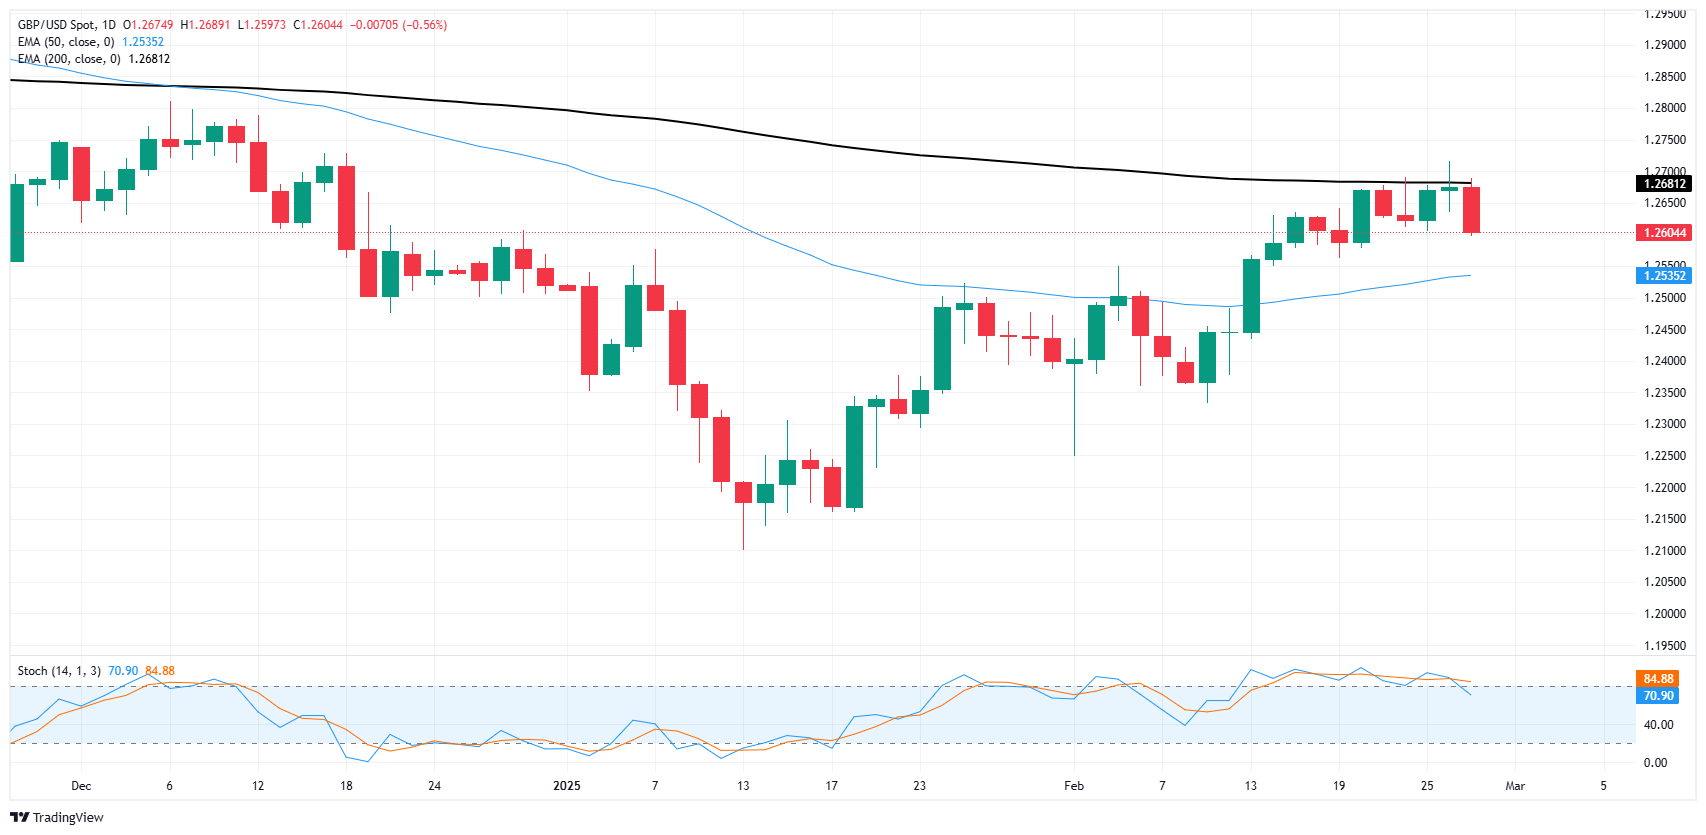
Pound Sterling FAQs
The Pound Sterling (GBP) is the oldest currency in the world (886 AD) and the official currency of the United Kingdom. It is the fourth most traded unit for foreign exchange (FX) in the world, accounting for 12% of all transactions, averaging $630 billion a day, according to 2022 data. Its key trading pairs are GBP/USD, also known as ‘Cable’, which accounts for 11% of FX, GBP/JPY, or the ‘Dragon’ as it is known by traders (3%), and EUR/GBP (2%). The Pound Sterling is issued by the Bank of England (BoE).
The single most important factor influencing the value of the Pound Sterling is monetary policy decided by the Bank of England. The BoE bases its decisions on whether it has achieved its primary goal of “price stability” – a steady inflation rate of around 2%. Its primary tool for achieving this is the adjustment of interest rates. When inflation is too high, the BoE will try to rein it in by raising interest rates, making it more expensive for people and businesses to access credit. This is generally positive for GBP, as higher interest rates make the UK a more attractive place for global investors to park their money. When inflation falls too low it is a sign economic growth is slowing. In this scenario, the BoE will consider lowering interest rates to cheapen credit so businesses will borrow more to invest in growth-generating projects.
Data releases gauge the health of the economy and can impact the value of the Pound Sterling. Indicators such as GDP, Manufacturing and Services PMIs, and employment can all influence the direction of the GBP. A strong economy is good for Sterling. Not only does it attract more foreign investment but it may encourage the BoE to put up interest rates, which will directly strengthen GBP. Otherwise, if economic data is weak, the Pound Sterling is likely to fall.
Another significant data release for the Pound Sterling is the Trade Balance. This indicator measures the difference between what a country earns from its exports and what it spends on imports over a given period. If a country produces highly sought-after exports, its currency will benefit purely from the extra demand created from foreign buyers seeking to purchase these goods. Therefore, a positive net Trade Balance strengthens a currency and vice versa for a negative balance.
-
00:23
USD/CAD extends the rally to near 1.4450, eyes on US PCE release
- USD/CAD extends its upside near 1.4440 in Thursday’s early Asian session.
- Canadian Dollar hits three-week low as tariff reprieve hopes fade
- US GDP expanded by 2.3% in Q4 as initially estimate.
The USD/CAD pair extends the rally to around 1.4440 on a stronger US Dollar (USD) during the late American session on Thursday. The Canadian Dollar (CAD) weakens to a three-week low as US President Donald Trump said that tariffs on Canadian goods will go into effect on March 4, clearing up some confusion on the timing and dashing hopes of a reprieve.
Trump said that his proposed 25% tariffs on Mexican and Canadian goods will go into effect next week as scheduled because drugs are still pouring into the US from those countries. On Wednesday, Trump's comments on the matter seemed to suggest that he may push the deadline back for about one month until April 2.
Meanwhile, Crude oil prices fall to a two-month low, raising supply concerns as prospects for a peace deal between Russia and Ukraine are improving. This, in turn, undermines the commodity-linked Loonie as Canada is the largest oil exporter to the United States (US), and lower crude oil prices tend to have a negative impact on the CAD value.
Data released by the US Bureau of Economic Analysis (BEA) on Thursday revealed that the US Gross Domestic Product (GDP) expanded at an annual rate of 2.3% in the fourth quarter (Q4). This figure came in line with market expectations.
The release of PCE data will take center stage along with Personal Income/Spending and the Chicago PMI. In case of weaker-than-expected, this could boost the Greenback against the Loonie.Canadian Dollar FAQs
The key factors driving the Canadian Dollar (CAD) are the level of interest rates set by the Bank of Canada (BoC), the price of Oil, Canada’s largest export, the health of its economy, inflation and the Trade Balance, which is the difference between the value of Canada’s exports versus its imports. Other factors include market sentiment – whether investors are taking on more risky assets (risk-on) or seeking safe-havens (risk-off) – with risk-on being CAD-positive. As its largest trading partner, the health of the US economy is also a key factor influencing the Canadian Dollar.
The Bank of Canada (BoC) has a significant influence on the Canadian Dollar by setting the level of interest rates that banks can lend to one another. This influences the level of interest rates for everyone. The main goal of the BoC is to maintain inflation at 1-3% by adjusting interest rates up or down. Relatively higher interest rates tend to be positive for the CAD. The Bank of Canada can also use quantitative easing and tightening to influence credit conditions, with the former CAD-negative and the latter CAD-positive.
The price of Oil is a key factor impacting the value of the Canadian Dollar. Petroleum is Canada’s biggest export, so Oil price tends to have an immediate impact on the CAD value. Generally, if Oil price rises CAD also goes up, as aggregate demand for the currency increases. The opposite is the case if the price of Oil falls. Higher Oil prices also tend to result in a greater likelihood of a positive Trade Balance, which is also supportive of the CAD.
While inflation had always traditionally been thought of as a negative factor for a currency since it lowers the value of money, the opposite has actually been the case in modern times with the relaxation of cross-border capital controls. Higher inflation tends to lead central banks to put up interest rates which attracts more capital inflows from global investors seeking a lucrative place to keep their money. This increases demand for the local currency, which in Canada’s case is the Canadian Dollar.
Macroeconomic data releases gauge the health of the economy and can have an impact on the Canadian Dollar. Indicators such as GDP, Manufacturing and Services PMIs, employment, and consumer sentiment surveys can all influence the direction of the CAD. A strong economy is good for the Canadian Dollar. Not only does it attract more foreign investment but it may encourage the Bank of Canada to put up interest rates, leading to a stronger currency. If economic data is weak, however, the CAD is likely to fall.
-