Noticias del mercado
-
23:46
Schedule for today, Wednesday, Jan 03’2018 (GMT0)
00:01 Japan Bank holiday
08:15 Switzerland Retail Sales (MoM) November -1.5%
08:15 Switzerland Retail Sales Y/Y November -3.0%
08:30 Switzerland Manufacturing PMI December 65.1 64.6
08:55 Germany Unemployment Rate s.a. December 5.6% 5.5%
08:55 Germany Unemployment Change December -18 -14
09:30 United Kingdom PMI Construction December 53.1 53.2
15:00 U.S. Construction Spending, m/m November 1.4% 0.8%
15:00 U.S. ISM Manufacturing December 58.2 58.2
19:00 U.S. FOMC meeting minutes
20:00 U.S. Total Vehicle Sales, mln December 17.48 17.4
22:30 Australia AIG Services Index December 51.7
-
22:09
Major US stock indexes finished trading in positive territory
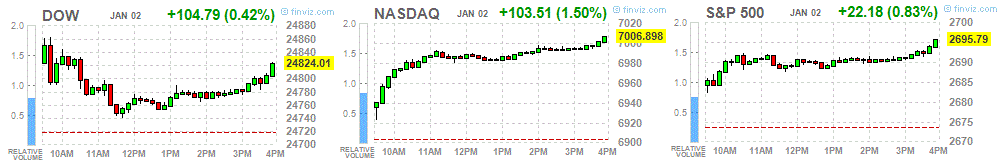
Major US stock indexes rose on the first trading day of 2018, helped by a rise in the price of shares in the commodity sector and the services sector.
In addition, data for December showed a marked improvement in the production conditions in the US. The latest growth was confirmed by a faster increase in output and new orders, supported by demand from customers. In accordance with the stronger production growth, employment has grown at the fastest pace since September 2014. Incomplete production has grown at the fastest rate since October 2015. Delays in the supply chain and an increase in the global demand for resources pushed up costs, while the inflation of procurement prices remains high overall. The inflation of the selling prices, however, is relaxed. Business confidence remained strong, due to more favorable demand conditions. The seasonally adjusted final index of purchasing managers in the US industry from IHS Markit (PMI) rose to 55.1 in December, compared with 53.9 in November. The last value of the index was the highest since March 2015, indicating a better health sector.
Most components of the DOW index recorded a rise (20 out of 30). The leader of growth was the shares of The Walt Disney Company (DIS, + 3.87%). Outsider were the shares of The Travelers Companies, Inc. (TRV, -2.76%).
Almost all sectors of the S & P index finished trading in positive territory. The commodities sector grew most (+ 2.2%). The decrease was shown only by the utilities sector (-0.6%).
At closing:
DJIA + 0.42% 24,823.53 +104.31
Nasdaq + 1.50% 7.006.90 +103.51
S & P + 0.83% 2,695.80 +22.19
-
21:00
DJIA +0.25% 24,780.46 +61.24 Nasdaq +1.31% 6,994.08 +90.69 S&P +0.65% 2,690.93 +17.32
-
18:00
European stocks closed: FTSE 100 -39.67 7648.10 -0.52% DAX -46.25 12871.39 -0.36% CAC 40 -23.96 5288.60 -0.45%
-
15:45
U.S.: Manufacturing PMI, December 55.1 (forecast 55)
-
15:31
U.S. Stocks open: Dow +0.53% Nasdaq +0.52%, S&P +0.47%
-
15:25
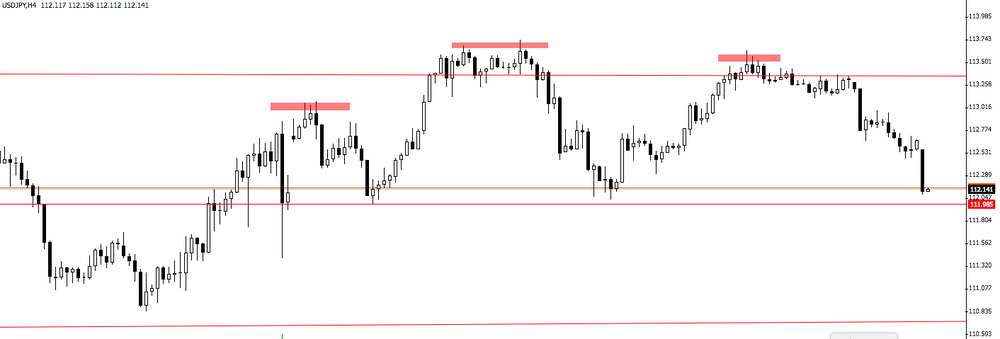
USD/JPY 4 hour time frame chart
USD/JPY has been following a bearish movement on the last few days.
However, as we can see on 4-hour time frame chart, the price is forming a chart pattern (head and shoulder) which can bring a more downside movements in this pair.
-
15:16
Before the bell: S&P futures +0.35%, NASDAQ futures +0.42%
U.S. stock-index futures signaled higher open on Tuesday, the first trading day of 2018.
Global Stocks:
Nikkei -
Hang Seng 30,515.31 +596.16 +1.99%
Shanghai 3,349.05 +41.88 +1.27%
S&P/ASX 6,061.30 -3.80 -0.06%
FTSE 7,646.12 -41.65 -0.54%
CAC 5,279.13 -33.43 -0.63%
DAX 12,822.62 -95.02 -0.74%
Crude $60.32 (-0.17%)
Gold $1,315.40 (+0.47%)
-
14:46
Wall Street. Stocks before the bell
(company / ticker / price / change ($/%) / volume)
3M Co
MMM
236.05
0.68(0.29%)
275
ALCOA INC.
AA
54.74
0.87(1.62%)
1746
ALTRIA GROUP INC.
MO
71.47
0.06(0.08%)
7202
Amazon.com Inc., NASDAQ
AMZN
1,173.50
4.03(0.34%)
13098
Apple Inc.
AAPL
170.09
0.86(0.51%)
144085
AT&T Inc
T
38.96
0.08(0.21%)
18273
Barrick Gold Corporation, NYSE
ABX
14.69
0.22(1.52%)
19993
Boeing Co
BA
295.8
0.89(0.30%)
4619
Caterpillar Inc
CAT
158.3
0.72(0.46%)
7093
Chevron Corp
CVX
125.75
0.56(0.45%)
2985
Cisco Systems Inc
CSCO
38.35
0.05(0.13%)
1443
Citigroup Inc., NYSE
C
74.9
0.49(0.66%)
12278
Exxon Mobil Corp
XOM
84.04
0.40(0.48%)
4302
Facebook, Inc.
FB
177.1
0.64(0.36%)
56829
Freeport-McMoRan Copper & Gold Inc., NYSE
FCX
19.01
0.05(0.26%)
39026
General Electric Co
GE
17.52
0.07(0.40%)
216565
General Motors Company, NYSE
GM
41.17
0.18(0.44%)
6114
Goldman Sachs
GS
255.1
0.34(0.13%)
1651
Home Depot Inc
HD
190.25
0.72(0.38%)
892
Intel Corp
INTC
46.3
0.14(0.30%)
1880
International Business Machines Co...
IBM
154
0.58(0.38%)
1239
Johnson & Johnson
JNJ
139.4
-0.32(-0.23%)
2242
JPMorgan Chase and Co
JPM
107.5
0.56(0.52%)
25146
McDonald's Corp
MCD
173.28
1.16(0.67%)
1337
Merck & Co Inc
MRK
56.65
0.38(0.68%)
286
Microsoft Corp
MSFT
85.9
0.36(0.42%)
21946
Nike
NKE
62.64
0.09(0.14%)
2283
Pfizer Inc
PFE
36.26
0.04(0.11%)
10636
Procter & Gamble Co
PG
92.24
0.36(0.39%)
813
Starbucks Corporation, NASDAQ
SBUX
57.26
-0.17(-0.30%)
302
Tesla Motors, Inc., NASDAQ
TSLA
311.55
0.20(0.06%)
23216
The Coca-Cola Co
KO
45.9
0.02(0.04%)
595
Travelers Companies Inc
TRV
136.2
0.56(0.41%)
275
Twitter, Inc., NYSE
TWTR
24.1
0.09(0.37%)
27818
UnitedHealth Group Inc
UNH
221.56
1.10(0.50%)
279
Verizon Communications Inc
VZ
53.01
0.08(0.15%)
2739
Wal-Mart Stores Inc
WMT
98.91
0.16(0.16%)
5498
Walt Disney Co
DIS
108.5
0.99(0.92%)
7251
-
14:43
Target price changes before the market open
McDonald's (MCD) target raised to $200 from $175 at BTIG Research
-
14:42
Downgrades before the market open
Johnson & Johnson (JNJ) downgraded to Neutral from Overweight at JP Morgan
-
14:42
Upgrades before the market open
Walt Disney (DIS) upgraded to Outperform from Neutral at Macquarie
Int'l Paper (IP) upgraded to Buy at BofA/Merrill
-
10:30
United Kingdom: Purchasing Manager Index Manufacturing , December 56.3 (forecast 58)
-
10:28
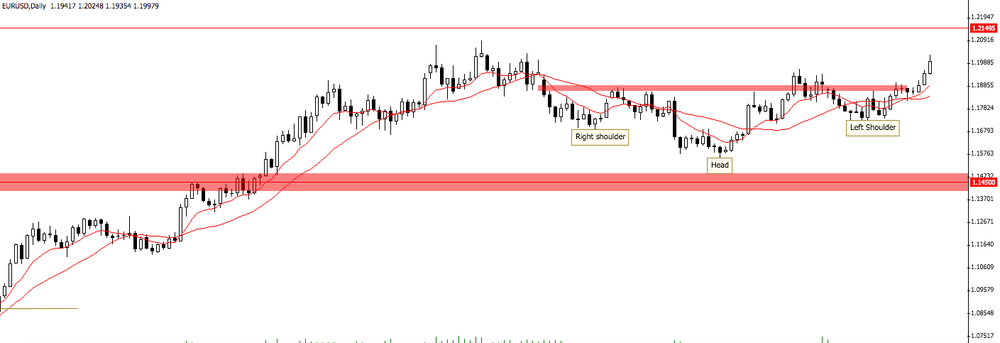
EUR/USD Daily time frame chart
On daily time frame chart, we can see that there is a chart pattern (Head and shoulders) which the price has already broken the neckline.
However, it may be interesting to trade when the price starts to correct its movement.
Therefore, our suggestion is to wait for the retest of that neckline in order to enter long in this pair.
-
10:00
Eurozone: Manufacturing PMI, December 60.6 (forecast 60.6)
-
09:55
Germany: Manufacturing PMI, December 63.3 (forecast 63.3)
-
09:50
France: Manufacturing PMI, December 58.8 (forecast 59.3)
-
07:39
Global Stocks
Asian stock markets are mostly higher on Tuesday, the first trading day of 2018, as investors digested upbeat China manufacturing PMI data for the month of December. Sentiment was also boosted after North Korean leader Kim Jong Un said he is open to talks with South Korea. China Caixin manufacturing PMI showed a December reading of 51.5, beating expectations and also touching a four-month high. The Australian market recovered from a weak start and is edging higher. Gains by mining stocks helped offset weakness in oil stocks.
-
06:47
Options levels on tuesday, January 2, 2017
EUR/USD
Resistance levels (open interest**, contracts)
$1.2130 (4380)
$1.2105 (3711)
$1.2076 (4165)
Price at time of writing this review: $1.1998
Support levels (open interest**, contracts):
$1.1944 (2317)
$1.1897 (4792)
$1.1849 (4677)
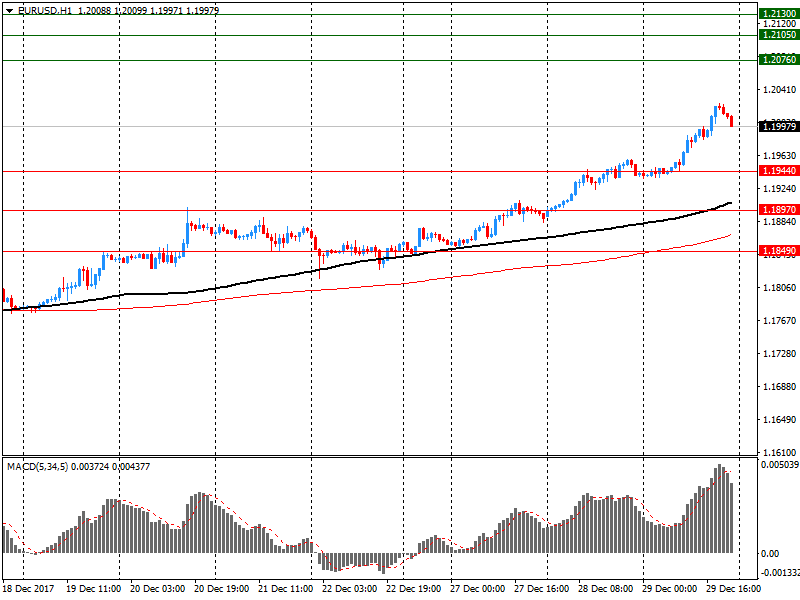
Comments:
- Overall open interest on the CALL options and PUT options with the expiration date January, 5 is 98603 contracts (according to data from December, 29) with the maximum number of contracts with strike price $1,2200 (6158);
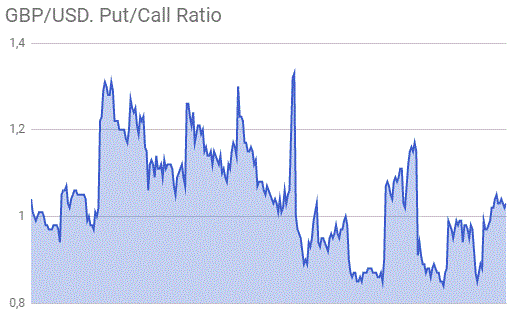
GBP/USD
Resistance levels (open interest**, contracts)
$1.3597 (2965)
$1.3578 (4730)
$1.3562 (2514)
Price at time of writing this review: $1.3499
Support levels (open interest**, contracts):
$1.3440 (1987)
$1.3395 (2416)
$1.3348 (2087)
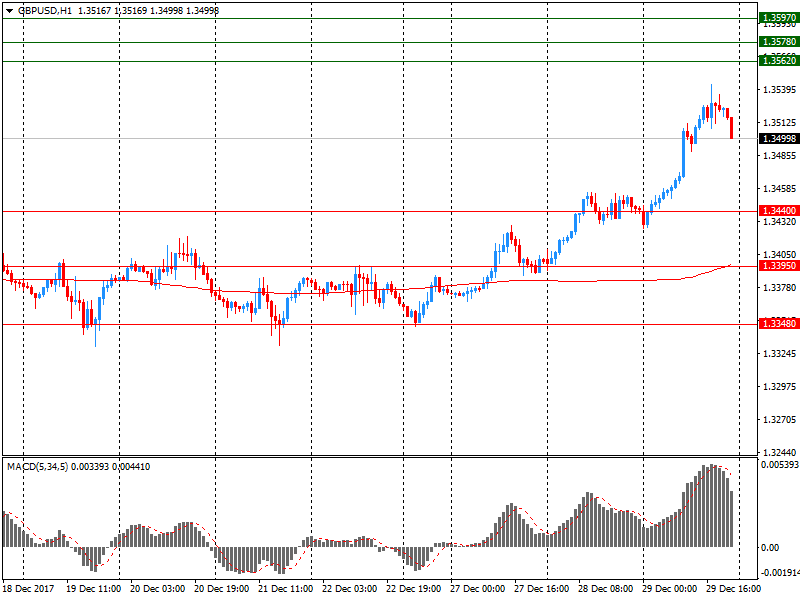
Comments:
- Overall open interest on the CALL options with the expiration date January, 5 is 33479 contracts, with the maximum number of contracts with strike price $1,3500 (4730);
- Overall open interest on the PUT options with the expiration date January, 5 is 34511 contracts, with the maximum number of contracts with strike price $1,3250 (2803);
- The ratio of PUT/CALL was 1.03 versus 1.02 from the previous trading day according to data from December, 29
* - The Chicago Mercantile Exchange bulletin (CME) is used for the calculation.
** - Open interest takes into account the total number of option contracts that are open at the moment.
-
02:45
China: Markit/Caixin Manufacturing PMI, December 51.5 (forecast 50.6)
-
00:26
Commodities. Daily history for Dec 29’2017:
(raw materials / closing price /% change)
OIL 60.25 -0.28%
GOLD 1305.00 -0.33%
-
00:26
Stocks. Daily history for Dec 29’2017:
(index / closing price / change items /% change)
Nikkei -19.04 22764.94 -0.08%
TOPIX -1.47 1817.56 -0.08%
Hang Seng +55.44 29919.15 +0.19%
CSI 300 +11.96 4030.86 +0.30%
Euro Stoxx 50 -20.35 3503.96 -0.58%
FTSE 100 +64.89 7687.77 +0.85%
DAX -62.30 12917.64 -0.48%
CAC 40 -26.86 5312.56 -0.50%
DJIA -118.29 24719.22 -0.48%
S&P 500 -13.93 2673.61 -0.52%
NASDAQ -46.77 6903.39 -0.67%
S&P/TSX -12.82 16209.13 -0.08%
-
00:25
Currencies. Daily history for Dec 29’2017:
(pare/closed(GMT +3)/change, %)
EUR/USD $1,1998 +0,47%
GBP/USD $1,3500 +0,44%
USD/CHF Chf0,97418 -0,44%
USD/JPY Y112,66 -0,17%
EUR/JPY Y135,19 +0,30%
GBP/JPY Y152,107 +0,26%
AUD/USD $0,7802 +0,44%
NZD/USD $0,7086 -0,02%
USD/CAD C$1,25668 0,00%
-