Noticias del mercado
-
22:07
Major US stock indexes rose moderately
Major US stock indexes finished trading in positive territory on the background of positive dynamics of the oil market and the expectations of the publication of important macroeconomic data on the US
Oil prices rose significantly, reaching a month high, helped by speculation that major oil-producing countries can take measures to stabilize prices. Recall, the Minister of Energy of Saudi Arabia Khalid al-Falih recently signaled his country's readiness to implement measures to stabilize the market. Saudi Arabia, the largest OPEC oil producer, is seen as the undeclared leader of the cartel.
As shown by the results of research, published by the Federal Reserve Bank of New York manufacturing index in the region has dropped significantly in August, confounding forecasts of experts. According to the data, the manufacturing index fell this month to -4.21 from 0.55 in July. Economists had expected the index to rise to 2.0.
At the same time, builders confidence in the market for newly built single-family homes in August increased by two points to 60 from a revised 58 with decreasing values in July, according to the housing market index (HMI) of the National Association of Home Builders / Wells Fargo. Two of the three components shown HMI increase in August. The component that measures current sales conditions rose two points to 65, while the index of sales expectations for plotting in the next six months increased by one point to 67. The component that measures customer traffic fell by one point to 44.
Most components of the DOW index finished trading in positive territory (22 of 30). Most remaining shares grew E. I. du Pont de Nemours and Company (DD, + 1.71%). Outsider were shares of UnitedHealth Group Incorporated (UNH, -0.92%).
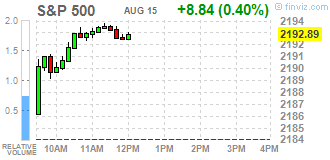
Almost all sectors of the S & P showed an increase. The leader turned conglomerates sector (+ 1.9%). Decreased only utilities sector (-1.1%).
At the close:
Dow + 0.32% 18,635.98 +59.51
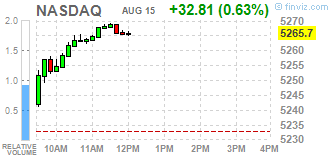
Nasdaq + 0.56% 5,262.02 +29.12
S & P + 0.28% 2,190.13 +6.08
-
22:00
U.S.: Total Net TIC Flows, June -202.8
-
22:00
U.S.: Net Long-term TIC Flows , June -3.6
-
21:00
Dow +0.43% 18,656.66 +80.19 Nasdaq +0.64% 5,266.43 +33.53 S&P +0.40% 2,192.79 +8.74
-
18:07
Wall Street. Major U.S. stock-indexes rose
Major U.S. stock-indexes rose on Monday, building on the record-setting rally of the past few weeks, as oil prices jumped. Oil hit a one-month high of about $48 on rising speculation that major producers may try to work out ways to support prices in an oversupplied market. Strong economic data, upbeat corporate earnings and low interest rates have stoked appetite for U.S. equities, driving all three major indexes to record highs.
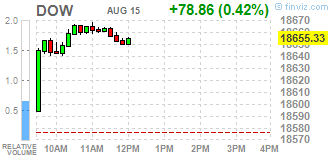
Most of all Dow stocks in positive area (23 of 30). Top gainer - Intel Corporation (INTC, +1.55%). Top loser - Wal-Mart Stores Inc. (WMT, -0.72%).
Most of S&P sectors in positive area. Top gainer - Conglomerates (+1.6%). Top loser - Utilities (-0.1%).
At the moment:
Dow 18608.00 +85.00 +0.46%
S&P 500 2189.50 +9.25 +0.42%
Nasdaq 100 4831.00 +26.75 +0.56%
Oil 45.40 +0.91 +2.05%
Gold 1347.60 +4.40 +0.33%
U.S. 10yr 1.53 +0.02
-
18:00
European stocks closed: FTSE 100 +25.17 6941.19 +0.36% DAX +25.78 10739.21 +0.24% CAC 40 -2.33 4497.86 -0.05%
-
16:02
U.S.: NAHB Housing Market Index, August 60 (forecast 60)
-
15:32
U.S. Stocks open: Dow +0.32%, Nasdaq +0.21%, S&P +0.21%
-
15:27
Before the bell: S&P futures +0.24%, NASDAQ futures +0.22%
U.S. stock-index futures advanced.
Global Stocks:
Nikkei 16,869.56 -50.36 -0.30%
Hang Seng 22,932.51 +165.60 +0.73%
Shanghai 3,125.40 +74.73 +2.45%
FTSE 6,950.97 +34.95 +0.51%
CAC 4,505.01 +4.82 +0.11%
DAX 10,756.16 +42.73 +0.40%
Crude $44.77 (+0.63%)
Gold $1345.50 (+0.17%)
-
14:55
Wall Street. Stocks before the bell
(company / ticker / price / change ($/%) / volume)
ALCOA INC.
AA
10.26
0.09(0.885%)
34753
ALTRIA GROUP INC.
MO
66.89
0.15(0.2248%)
368
Amazon.com Inc., NASDAQ
AMZN
772.83
0.27(0.035%)
18343
Apple Inc.
AAPL
108.47
0.29(0.2681%)
60324
AT&T Inc
T
43.28
-0.00(-0.00%)
3564
Barrick Gold Corporation, NYSE
ABX
21.75
0.00(0.00%)
25467
Boeing Co
BA
133.5
0.40(0.3005%)
2100
Chevron Corp
CVX
102.47
0.31(0.3034%)
504
Cisco Systems Inc
CSCO
31.05
0.18(0.5831%)
17579
Citigroup Inc., NYSE
C
45.79
0.21(0.4607%)
1983
Exxon Mobil Corp
XOM
88.08
0.23(0.2618%)
4303
Facebook, Inc.
FB
125.1
0.22(0.1762%)
55992
Ford Motor Co.
F
12.37
0.04(0.3244%)
6360
Freeport-McMoRan Copper & Gold Inc., NYSE
FCX
11.93
0.11(0.9306%)
66345
General Electric Co
GE
31.26
0.02(0.064%)
320
General Motors Company, NYSE
GM
31.72
0.15(0.4751%)
100
Google Inc.
GOOG
785
1.78(0.2273%)
741
Home Depot Inc
HD
137.88
1.31(0.9592%)
12487
Intel Corp
INTC
34.7
0.13(0.3761%)
601
McDonald's Corp
MCD
119.25
-0.27(-0.2259%)
4865
Microsoft Corp
MSFT
58.06
0.12(0.2071%)
3362
Nike
NKE
56.67
0.22(0.3897%)
2037
Pfizer Inc
PFE
35.03
0.05(0.1429%)
3626
Procter & Gamble Co
PG
87.48
0.44(0.5055%)
924
Starbucks Corporation, NASDAQ
SBUX
55.55
0.08(0.1442%)
1129
Tesla Motors, Inc., NASDAQ
TSLA
226.9
1.29(0.5718%)
9204
The Coca-Cola Co
KO
44.11
0.08(0.1817%)
2178
Twitter, Inc., NYSE
TWTR
19.92
0.38(1.9447%)
232406
Verizon Communications Inc
VZ
53.88
0.23(0.4287%)
819
Wal-Mart Stores Inc
WMT
74.07
0.18(0.2436%)
1730
Walt Disney Co
DIS
97.15
0.31(0.3201%)
9772
Yahoo! Inc., NASDAQ
YHOO
43.4
0.46(1.0713%)
316056
Yandex N.V., NASDAQ
YNDX
23.5
0.29(1.2495%)
2850
-
14:47
Upgrades and downgrades before the market open
Upgrades:
Procter & Gamble (PG) upgraded to Buy from Neutral at B. Riley & Co
Downgrades:
McDonald's (MCD) downgraded to Hold from Buy at Argus
Other:
-
14:30
U.S.: NY Fed Empire State manufacturing index , August -4.21 (forecast 2)
-
13:50
Orders
EUR/USD
Offers : 1.1175-80 1.1200 1.1230 1.1250 1.1280 1.1300
Bids : 1.1150 1.1130 1.1115 1.1100 1.1070 1.1050-55 1.1020-25 1.1000-05
GBP/USD
Offers : 1.2980 1.3000 1.3020-25 1.3065 1.3080 1.3095-05 1.3130 1.3150
Bids : 1.2930 1.2900 1.2880 1.2850 1.2830 1.2800 1.2780 1.2750
EUR/GBP
Offers : 0.8655-60 0.8685 0.8700 0.8730 0.8750
Bids : 0.8620 0.8600 0.8585 0.8570 0.8550 0.8535 0.8520 0.8500
EUR/JPY
Offers : 113.25 113.50 113.80 114.00 114.50 114.80 115.00
Bids : 112.80-85 112.50 112.00-10 111.85 111.50
USD/JPY
Offers : 101.30 101.50 101.80 102.00 102.20-25 102.50 102.80-85 103.00
Bids : 101.00 100.70-75 100.50 100.25-30 100.00 99.80 99.50
AUD/USD
Offers : 0.7680 0 .7700 0.7720 0.7750-55 0.7785 0.7800
Bids : 0.7635-40 0.7620 0.7600 0.7585 0.7565 0.7570 0.7550
-
10:20
Option expiries for today's 10:00 ET NY cut
USD/JPY 101.00 (EUR 603m)
GBP/USD 1.2750 (GBP 785m)
AUD/USD 0.7460 (AUD 1.87bln) 0.7600 (829m)
AUD/JPY 79.60 (AUD 2.48bln)
NZD/USD 0.6930 (NZD 1.17bln)
AUD/NZD 1.0900 (AUD 1.58bln)
-
09:16
Switzerland: Producer & Import Prices, y/y, July -0.8%
-
09:16
Switzerland: Producer & Import Prices, m/m, July -0.1%
-
07:19
Global Stocks
European stocks ended a choppy session in the red on Friday after weaker-than-expected U.S. retail sales cast doubt on the health of the world's largest economy.
The Stoxx Europe 600 SXXP, -0.16% dropped 0.2% to close at 346.09, partly erasing a 0.8% gain from Thursday, which was fueled by higher oil prices. For the week, it ended 1.4% higher.
U.S. stocks ended mostly lower Friday, but still eked out small weekly gains, as weakness in shares of mining and chemical companies, along with a rise in active oil rigs, blunted an advance in the energy sector and rising oil prices. Still the Nasdaq closed at an all-time high, one session after all three benchmarks posted record closes on the same day for the first time since 1999. The S&P 500 index SPX, -0.08% ended down 1.8 points, or 0.1%, at 2,183.99, weighed by sharp declines in Alcoa Inc. AA, -2.40% and Nucor Corp. NUE, -3.17% and Dow Chemical Co. DOW, -2.44% followed by a 0.4% loss in the telecom sector. Three of the index's 10 sectors ended in positive territory, with energy leading the gains, up 0.6%. The Dow Jones Industrial Average DJIA, -0.20% lost 37.53 points, or 0.2%, to 18,575.9, pulled down by a 1.9% drop in DuPont DD, -1.93% and a 0.9% drop in IBM Corp. IBM, -0.97% but buoyed by a 1.3% gain in Exxon Mobil Corp. XOM, +1.30% Meanwhile, the Nasdaq Composite Index COMP, +0.09% ended up 4.5 points, or 0.1%, at 5,232.89, an all-time closing high.
Asian shares inched back from one-year peaks on Monday as a rally in Chinese stocks helped offset news of Japan's economic growth slowing to a halt last quarter.
China's blue-chip CSI300 Index .CSI300 rose 1.3 percent to a seven-month high and Shanghai .SSEC added 0.9 percent amid talk more stimulus would be forthcoming from Beijing.
Aug 15 Japan's Nikkei share index slipped on Monday as the yen stayed strong and data showed economic growth stalled in the second quarter, souring investor sentiment.
The Nikkei dropped 0.2 percent to 16,884.76 points by midmorning, after rising 4.1 percent last week.
Japan's economy expanded by a scant 0.2 percent on an annualised basis in the April-June quarter, less than a median market forecast for a 0.7 percent increase and a marked slowdown from a revised 2.0 percent increase in January-March, Cabinet Office data showed.
-
07:11
Options levels on monday, August 15, 2016:
EUR/USD
Resistance levels (open interest**, contracts)
$1.1302 (4929)
$1.1248 (3344)
$1.1213 (2202)
Price at time of writing this review: $1.1159
Support levels (open interest**, contracts):
$1.1105 (2267)
$1.1049 (3787)
$1.0975 (5814)
Comments:
- Overall open interest on the CALL options with the expiration date September, 9 is 49594 contracts, with the maximum number of contracts with strike price $1,1250 (4929);
- Overall open interest on the PUT options with the expiration date September, 9 is 55028 contracts, with the maximum number of contracts with strike price $1,1000 (5814);
- The ratio of PUT/CALL was 1.11 versus 1.12 from the previous trading day according to data from August, 12
GBP/USD
Resistance levels (open interest**, contracts)
$1.3204 (2168)
$1.3106 (1269)
$1.3010 (946)
Price at time of writing this review: $1.2919
Support levels (open interest**, contracts):
$1.2792 (2312)
$1.2695 (1049)
$1.2597 (728)
Comments:
- Overall open interest on the CALL options with the expiration date September, 9 is 31321 contracts, with the maximum number of contracts with strike price $1,3300 (2496);
- Overall open interest on the PUT options with the expiration date September, 9 is 25391 contracts, with the maximum number of contracts with strike price $1,2800 (2312);
- The ratio of PUT/CALL was 0.81 versus 0.82 from the previous trading day according to data from August, 12
* - The Chicago Mercantile Exchange bulletin (CME) is used for the calculation.
** - Open interest takes into account the total number of option contracts that are open at the moment.
-
06:34
Japan: Industrial Production (MoM) , June 2.3% (forecast 1.9%)
-
06:34
Japan: Industrial Production (YoY), June -1.5% (forecast -1.9%)
-
01:52
Japan: GDP, y/y, Quarter II 0.2% (forecast 0.7%)
-
01:52
Japan: GDP, q/q, Quarter II 0.0% (forecast 0.2%)
-
00:30
Commodities. Daily history for Aug 12’2016:
(raw materials / closing price /% change)
Oil 44.69 +0.45%
Gold 1,341.70 -0.11%
-
00:29
Stocks. Daily history for Aug 12’2016:
(index / closing price / change items /% change)
Nikkei 225 16,919.92 +184.80 +1.10%
Shanghai Composite 3,051.02 +48.38 +1.61%
S&P/ASX 200 5,530.91 +22.90 +0.42%
FTSE 100 6,916.02 +1.31 +0.02%
CAC 40 4,500.19 -3.76 -0.08%
Xetra DAX 10,713.43 -29.41 -0.27%
S&P 500 2,184.05 -1.74 -0.08%
Dow Jones Industrial Average 18,576.47 -37.05 -0.20%
S&P/TSX Composite 14,747.45 -48.61 -0.33%
-
00:28
Currencies. Daily history for Aug 12’2016:
(pare/closed(GMT +3)/change, %)
EUR/USD $1,1160 +0,18%
GBP/USD $1,2919 -0,30%
USD/CHF Chf0,9745 -0,08%
USD/JPY Y101,24 -0,66%
EUR/JPY Y113,05 -0,43%
GBP/JPY Y130,84 -0,17%
AUD/USD $0,7649 -0,63%
NZD/USD $0,7195 -0,17%
USD/CAD C$1,2955 -0,25%
-
00:00
Schedule for today, Monday, Aug 15’2016
(time / country / index / period / previous value / forecast)
04:30 Japan Industrial Production (MoM) (Finally) June -2.6% 1.9%
04:30 Japan Industrial Production (YoY) (Finally) June -0.4% -1.9%
06:00 France Bank holiday
07:15 Switzerland Producer & Import Prices, m/m July 0.1%
07:15 Switzerland Producer & Import Prices, y/y July -1%
12:30 U.S. NY Fed Empire State manufacturing index August 0.55 2
14:00 U.S. NAHB Housing Market Index August 59 60
20:00 U.S. Net Long-term TIC Flows June 41.1
20:00 U.S. Total Net TIC Flows June -11.0
-