Noticias del mercado
-
23:57
Schedule for today, Thursday, Jun 22’2017 (GMT0)
06:00 Switzerland Trade Balance May 1.97 2.44
08:00 Eurozone ECB Economic Bulletin
10:00 United Kingdom CBI industrial order books balance June 9 7
12:30 Canada Retail Sales, m/m April 0.7% 0.2%
12:30 Canada Retail Sales YoY April 6.9%
12:30 Canada Retail Sales ex Autos, m/m April -0.2% 0.7%
12:30 U.S. Continuing Jobless Claims 1935 1928
12:30 U.S. Initial Jobless Claims 237 240
13:00 U.S. Housing Price Index, m/m April 0.6% 0.4%
14:00 Eurozone Consumer Confidence (Preliminary) June -3.3 -3
14:00 U.S. Leading Indicators May 0.3% 0.4%
14:00 U.S. FOMC Member Jerome Powell Speaks
18:00 United Kingdom MPC Member Forbes Speaks
-
23:00
New Zealand: RBNZ Interest Rate Decision, 1.75% (forecast 1.75%)
-
22:06
Major US stock indexes completed the session in different directions

Major US stock indices showed mixed dynamics on Wednesday, as the growth of shares in the health sector was countered by the fall in quotations of the main materials sector.
In addition, as it became known, in May, home sales in the secondary market in the US unexpectedly rose to the third highest monthly level in a decade, and the chronic shortage of stocks pushed the median price of housing to a record level. The National Association of Realtors said that home sales in the secondary market grew by 1.1% to 5.62 million units, taking into account seasonal fluctuations last month. Economists predicted that sales would fall to 5.55 million.
Oil prices fell by more than 2%, the reason for which were the continuing concerns about the oversaturation of the market. Since the beginning of this year, oil futures have lost about 20% of their value, which is the worst result for the first six months of the year since 1997. Compliance with the agreement between OPEC and other producers to reduce production by 1.8 million barrels per day reached the highest level in May since the signing of this pact, namely 106%. This means that they cut production more than necessary. Compliance with the agreement by OPEC members was 108%, and among non-OPEC countries, it was 100%. Nevertheless, the global reserves of crude oil and petroleum products remain significantly higher than their long-term average values.
Most components of the DOW index recorded a decline (18 out of 30). Most fell shares of Caterpillar Inc. (CAT, -3.46%). Leader of the growth were shares of NIKE, Inc. (NKE, + 1.80%).
Most sectors of the S & P index showed a decline. Most of all fell the sector of basic materials (-1.1%). The leader of growth was the healthcare sector (+ 1.3%).
At closing:
DJIA -0.24% 21.415.23 -51.91
Nasdaq + 0.74% 6.233.95 +45.92
S & P -0.06% 2.435.66 -1.37
-
21:00
DJIA -0.21% 21,422.93 -44.21 Nasdaq +0.71% 6,232.26 +44.23 S&P -0.03% 2,436.32 -0.71
-
18:00
European stocks closed: FTSE 100 -24.92 7447.79 -0.33% DAX -40.53 12774.26 -0.32% CAC 40 -19.39 5274.26 -0.37%
-
16:37
U.S. commercial crude oil inventories decreased by 2.5 million barrels from the previous week
U.S. commercial crude oil inventories (excluding those in the Strategic Petroleum Reserve) decreased by 2.5 million barrels from the previous week. At 509.1 million barrels, U.S. crude oil inventories are in the upper half of the average range for this time of year.
Total motor gasoline inventories decreased by 0.6 million barrels last week, but are above the upper limit of the average range. Finished gasoline inventories decreased while blending components inventories increased last week.
Distillate fuel inventories increased by 1.1 million barrels last week and are above the upper limit of the average range for this time of year. Propane/propylene inventories increased by 1.8 million barrels last week but are in the lower half of the average range. Total commercial petroleum inventories decreased by 1.9 million barrels last week.
-
16:30
U.S.: Crude Oil Inventories, June -2.451 (forecast -2.18)
-
16:17
US existing-home sales rebounded in May following a notable decline in April
Existing-home sales rebounded in May following a notable decline in April, and low inventory levels helped propel the median sales price to a new high while pushing down the median days a home is on the market to a new low, according to the National Association of Realtors. All major regions except for the Midwest saw an increase in sales last month.
Total existing-home sales,, which are completed transactions that include single-family homes, townhomes, condominiums and co-ops, climbed 1.1 percent to a seasonally adjusted annual rate of 5.62 million in May from a downwardly revised 5.56 million in April. Last month's sales pace is 2.7 percent above a year ago and is the third highest over the past year
-
16:00
U.S.: Existing Home Sales , May 5.62 (forecast 5.55)
-
15:41
Option expiries for today's 10:00 ET NY cut
EURUSD: 1.1100 (760m) 1.1140-50 (1.1bln) 1.1180 (710m) 1.1200-10 (1.9bln) 1.1280 (560m) 1.1300 (540m)
USDJPY: 110.30 (USD 250m) 110.50 (500m) 111.25-305 (1.2bln) 111.50 (200m) 112.00 (345m) 113.00 (270m)
EURGBP: 0.8745-50 (EUR 360m)
AUDUSD: 0.7440-50 (AUD 360m) 0.7475 (285m) 0.7500 (255m) 0.7600 (255m) 0.7635-45 (785m)
USDCAD: 1.3300 (USD 180m)
NZDUSD: 0.7125 (NZD 421m) 0.7150 (520m) 0.7300 (236m)
-
15:34
U.S. Stocks open: Dow +0.08%, Nasdaq +0.29%, S&P +0.12%
-
15:26
Before the bell: S&P futures -0.03%, NASDAQ futures +0.10%
U.S. stock-index futures were flat as investors decided to take a breath after the market was on a roller coaster ride earlier this week.
Stocks:
Nikkei 20,138.79 -91.62 -0.45%
Hang Seng 25,694.58 -148.46 -0.57%
Shanghai 3,156.38 +16.36 +0.52%
S&P/ASX 5,665.72 -91.53 -1.59%
FTSE 7,436.36 -36.35 -0.49%
CAC 5,263.50 -30.15 -0.57%
DAX 12,770.38 -44.41 -0.35%
Crude $43.72 (+0.48%)
Gold $1,244.70 (+0.10%)
-
14:59
Wall Street. Stocks before the bell
(company / ticker / price / change ($/%) / volume)
ALTRIA GROUP INC.
MO
77.3
-0.03(-0.04%)
5035
Amazon.com Inc., NASDAQ
AMZN
996.04
3.45(0.35%)
18108
American Express Co
AXP
82.7
0.19(0.23%)
675
Apple Inc.
AAPL
145.38
0.37(0.26%)
57936
AT&T Inc
T
38.9
0.24(0.62%)
759
Barrick Gold Corporation, NYSE
ABX
15.65
0.07(0.45%)
36168
Boeing Co
BA
198.6
0.27(0.14%)
800
Caterpillar Inc
CAT
106.8
-0.24(-0.22%)
6485
Chevron Corp
CVX
105.9
-0.58(-0.54%)
18543
Cisco Systems Inc
CSCO
31.86
0.01(0.03%)
3557
Citigroup Inc., NYSE
C
64.03
0.12(0.19%)
11432
Facebook, Inc.
FB
152.37
0.12(0.08%)
14494
FedEx Corporation, NYSE
FDX
206.55
-2.40(-1.15%)
71457
Ford Motor Co.
F
11.17
0.05(0.45%)
16734
Freeport-McMoRan Copper & Gold Inc., NYSE
FCX
11.38
0.14(1.25%)
31306
General Electric Co
GE
28.15
0.02(0.07%)
4965
Goldman Sachs
GS
224.7
-0.40(-0.18%)
2663
Intel Corp
INTC
34.35
-0.51(-1.46%)
536031
JPMorgan Chase and Co
JPM
87.56
0.04(0.05%)
2939
McDonald's Corp
MCD
154.5
0.43(0.28%)
1005
Microsoft Corp
MSFT
70.1
0.19(0.27%)
8469
Nike
NKE
52.14
0.58(1.12%)
56348
Procter & Gamble Co
PG
89.5
-0.13(-0.15%)
7736
Tesla Motors, Inc., NASDAQ
TSLA
374.5
2.26(0.61%)
51053
Twitter, Inc., NYSE
TWTR
16.93
0.02(0.12%)
25284
Verizon Communications Inc
VZ
45.99
0.05(0.11%)
560
Visa
V
94.74
0.36(0.38%)
1357
Walt Disney Co
DIS
104
0.06(0.06%)
2227
Yandex N.V., NASDAQ
YNDX
26.31
0.06(0.23%)
4100
-
14:53
German fin min Schaeuble says have to minimise damage from Brexit for both sides, will find solutions
-
Isolation, protectionism never right answers, confident for pragmatic solutions at G20
-
-
14:46
Iran says OPEC may decide to make further oil-output cuts @zerohedge
-
14:40
Analyst coverage initiations before the market open
General Motors (GM) initiated with a Neutral at Guggenheim
Ford Motor Co. (F) initiated with a Neutral at Guggenheim
-
14:39
Downgrades before the market open
Intel (INTC) downgraded to Neutral from Buy at BofA/Merrill
Chevron (CVX) downgraded to Neutral from Outperform at Macquarie
-
14:02
Orders
EUR/USD
Offers: 1.1140-1.1150 1.1165 1.1180 1.1200 1.1230 1.1250
Bids: 1.1120 1.1100 1.1080 1.1050 1.1030 1.1000
GBP/USD
Offers: 1.2760 1.2780 1.2830 1.2850 1.2880 1.2900
Bids: 1.2680 1.2650 1.2630 1.2600-10
EUR/JPY
Offers: 124.20 124.50 124.80 125.00
Bids: 123.50 123.00 122.80 122.50 122.00
EUR/GBP
Offers: 0.8850-55 0.8885 0.8900 0.8930 0.8950
Bids: 0.8820 0.8800 0.8780 0.8750 0.8720 0.8700
USD/JPY
Offers: 111.35 111.50 111.65 111.80 112.00 112.30 112.50
Bids: 111.00 110.80 110.50 110.30 110.00
AUD/USD
Offers: 0.7580 0.7600 0.7620 0.7635 0.7650
Bids: 0.7550 0.7520 0.7500 0.7480 0.7450
-
13:59
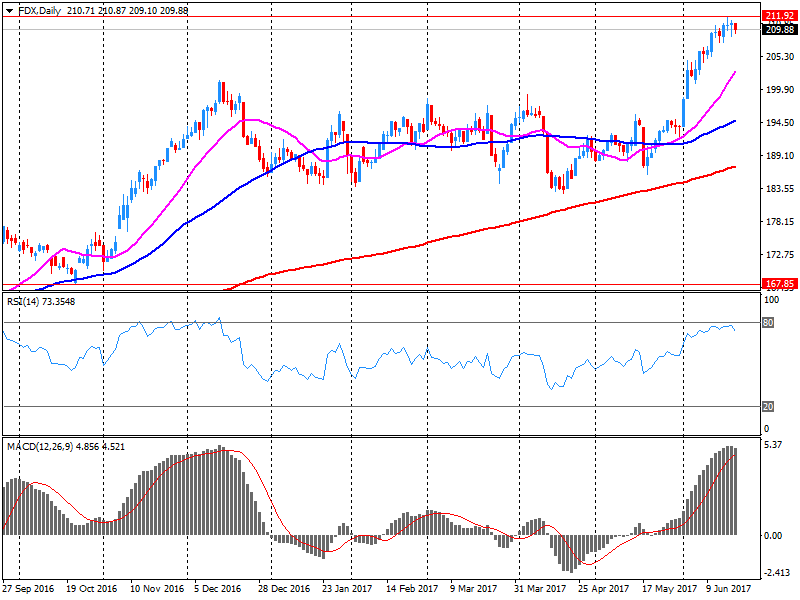
Company News: FedEx (FDX) Q4 EPS beat analysts’ estimate
FedEx (FDX) reported Q4 FY 2017 earnings of $4.25 per share (versus $3.30 in Q4 FY 2016), beating analysts' consensus estimate of $3.88.
The company's quarterly revenues amounted to $15.700 bln (+21% y/y), generally in line with analysts' consensus estimate of $15.560 bln.
The company also issued in-line guidance for FY 2018, projecting EPS of $13.20-14.00 versus analysts' consensus estimate of $13.58. Its CapEx is expected to amount to $5.9 bln in FY 2018, in line with analysts' expectations.
FDX fell to $208.30 (-0.31%) in pre-market trading.
-
12:47
French conservative lawmaker Solere says forming splinter group in parliament, separate from main republicans party
-
11:58
Germany's Merkel says Europe must take its fate into its own hands, not just on security but also on economy
-
11:58
German 30-year bond yield hits two-month low of 1.034 percent, down nearly 4 bps on day
-
10:37
UK public sector net borrowing decreased by £0.1 billion to £16.1 billion in the current financial year-to-date
Public sector net borrowing (excluding public sector banks) decreased by £0.1 billion to £16.1 billion in the current financial year-to-date (April 2017 to May 2017), compared with the same period in 2016; this is the lowest year-to-date net borrowing since 2008.
The Office for Budget Responsibility (OBR) forecast that public sector net borrowing (excluding public sector banks) will be £58.3 billion during the financial year ending March 2018.
Public sector net borrowing (excluding public sector banks) decreased by £0.3 billion to £6.7 billion in May 2017, compared with May 2016; this is the lowest May borrowing since 2007.
Public sector net debt (excluding public sector banks) was £1,737.3 billion at the end of May 2017, equivalent to 86.5% of gross domestic product (GDP); an increase of £121.6 billion (or 2.9 percentage points as a ratio of GDP) on May 2016.
Central government net cash requirement decreased by £14.3 billion; from £7.4 billion (deficit), to a surplus of £6.9 billion in the current financial year-to-date (April 2017 to May 2017), compared with the same period in 2016; this is the lowest year-to-date central government net cash requirement since 2000.
-
10:30
United Kingdom: PSNB, bln, May -5.99 (forecast -7)
-
10:19
ECB says Fed's careful policy tightening appears to have eased the risk of a disorderly tightening of global financial conditions
-
Global growth risks have diminished but remain tilted to the downside
-
12 pct of cspp bonds have been bought at negative yields but above depo rate
-
Chinese vulnerabilities over medium term remain elevated
-
55 pct of corp bonds purchased so far are german or french
-
-
10:02
Forex option contracts rolling off today at 14.00 GMT:
EURUSD: 1.1100 (760m) 1.1140-50 (1.1bln) 1.1180 (710m) 1.1200-10 (1.9bln) 1.1280 (560m) 1.1300 (540m)
USDJPY: 110.30 (USD 250m) 110.50 (500m) 111.25-305 (1.2bln) 111.50 (200m) 112.00 (345m) 113.00 (270m)
EURGBP: 0.8745-50 (EUR 360m)
AUDUSD: 0.7440-50 (AUD 360m) 0.7475 (285m) 0.7500 (255m) 0.7600 (255m) 0.7635-45 (785m)
USDCAD: 1.3300 (USD 180m)
NZDUSD: 0.7125 (NZD 421m) 0.7150 (520m) 0.7300 (236m)
-
09:54
BoJ Gov Kuroda: appropriate to continue with strong easing, still distant from inflation target
-
Japan's economy is on firmer footing, output and exports are rising
-
Expect consumer price gains to pick up pace
-
Still need to closely monitor consumer price trend
-
-
09:31
Major European stock markets trading in the red zone: FTSE 7461.31 -11.40 -0.15%, DAX 12753.83 -60.96 -0.48%, CAC 5248.86 -44.79 -0.85%
-
09:30
BoJ's Kuroda: yield curve has been moving in line with BoJ's market operations - Reuters
-
08:56
Negative start of trading expected on the main European stock markets: DAX -0.3%, CAC 40 -0.3%, FTSE 100 -0.3%
-
08:34
Bank of Japan april meeting minutes: members agreed JGB purchases will fluctuate somewhat under YCC
-
Members agreed such fluctuations cause no problem for the BoJ's market operations guidance
-
Members agreed inflation expectations remain weak
-
One member said JGB purchases cannot be maintained next year unless boj starts reducing purchases now
-
Members agreed that gains in industrial production will continue
-
One member said consumer spending is starting to rise in line with gains in incomes
-
Members agreed there is high chance exports will continue to show solid gains
-
-
08:31
Reuters corporate survey: only 12 pct of Japan firms aim to boost China investment over next 3 years, only 18 pct aim to lift U.S. investment
-
48 pct of Japan firms plan to expand domestic capex over next 3 years, 46 pct to keep it at current rates
-
40 pct of Japan firms say domestic demand is biggest headache over next 3 years, 34 pct say labour shortage is main concern
-
-
08:29
Saudi prince Mohammed Bin Nayef pledges allegiance to crown prince Mohammed Bin Salman - SPA
-
Saudi Arabia extends Eid al-Fitr religious holiday by a week
-
-
08:22
German chancellor Merkel's conservatives widen their lead over social democrats to 16 pct points - Forsa poll
-
08:20
While I greatly appreciate the efforts of President Xi & China to help with North Korea, it has not worked out. At least I know China tried! @realDonaldTrump
-
08:20
Options levels on wednesday, June 21, 2017
EUR/USD
Resistance levels (open interest**, contracts)
$1.1348 (1886)
$1.1267 (2546)
$1.1193 (4320)
Price at time of writing this review: $1.1131
Support levels (open interest**, contracts):
$1.1074 (876)
$1.0991 (981)
$1.0902 (657)

Comments:
- Overall open interest on the CALL options and PUT options with the expiration date July, 7 is 69772 contracts (according to data from June, 20) with the maximum number of contracts with strike price $1,1100 (7825);
GBP/USD
Resistance levels (open interest**, contracts)
$1.2834 (2392)
$1.2770 (1105)
$1.2725 (254)
Price at time of writing this review: $1.2617
Support levels (open interest**, contracts):
$1.2539 (1337)
$1.2467 (1757)
$1.2383 (1442)
Comments:
- Overall open interest on the CALL options with the expiration date July, 7 is 28950 contracts, with the maximum number of contracts with strike price $1,2800 (2392);
- Overall open interest on the PUT options with the expiration date July, 7 is 27697 contracts, with the maximum number of contracts with strike price $1,2700 (2883);
- The ratio of PUT/CALL was 0.96 versus 0.97 from the previous trading day according to data from June, 20

* - The Chicago Mercantile Exchange bulletin (CME) is used for the calculation.
** - Open interest takes into account the total number of option contracts that are open at the moment.
-
07:33
Global Stocks
European stocks ended lower Tuesday, reversing gains as oil prices sank toward bear-market territory, taking energy-related shares with them. The Stoxx Europe 600 Oil and Gas Index SXEP, -2.18% was shoved 2.2% lower, losing the most since November as West Texas Intermediate oil futures CLN7, -1.95% and Brent crude futures LCOQ7, -0.17% swung lower by about 3%.
U.S. stocks finished lower Tuesday as investors dumped energy shares after crude-oil prices sank into bear-market territory. The S&P 500 SPX, -0.67% dropped 16.43 points, or 0.7%, to close at 2,437.03, with nine of the 11 main sectors trading lower. The energy sector was down 1.3%, topping the losers.
Stocks were lower across the Asia-Pacific region early Wednesday, as global price declines for oil hurt energy companies, though mainland markets were resilient after MSCI Inc. said it would include Chinese stocks in its emerging-markets index. Oil prices returned to bear-market territory overnight and the U.S. benchmark has fallen 20% from its last high point, with cuts by the Organization of the Petroleum Exporting Countries offset by increasing production elsewhere.
-
03:01
Australia: Leading Index, May 0.0%
-
00:37
Commodities. Daily history for Jun 20’2017:
(raw materials / closing price /% change)
Oil 43.34 -0.39%
Gold 1,244.30 +0.06%
-
00:32
Stocks. Daily history for Jun 20’2017:
(index / closing price / change items /% change)
Nikkei +162.66 20230.41 +0.81%
TOPIX +11.18 1617.25 +0.70%
Hang Seng -81.51 25843.04 -0.31%
CSI 300 -7.18 3546.49 -0.20%
Euro Stoxx 50 -18.92 3560.66 -0.53%
FTSE 100 -51.10 7472.71 -0.68%
DAX -74.16 12814.79 -0.58%
CAC 40 -17.07 5293.65 -0.32%
DJIA -61.85 21467.14 -0.29
S&P 500 -16.43 2437.03 -0.67
NASDAQ -50.98 6188.03 -0.82
S&P/TSX -116.44 15149.60 -0.76
-
00:28
Currencies. Daily history for Jun 20’2017:
(pare/closed(GMT +2)/change, %)
EUR/USD $1,1134 -0,13%
GBP/USD $1,2623 -0,89%
USD/CHF Chf0,9747 -0,07%
USD/JPY Y111,44 -0,11%
EUR/JPY Y124,08 -0,23%
GBP/JPY Y140,67 -0,99%
AUD/USD $0,7577 -0,25%
NZD/USD $0,7237 +0,12%
USD/CAD C$1,3265 +0,35%
-