Noticias del mercado
-
20:43
DJIA 26829.72 +101.57 +0.38%, NASDAQ 8126.99 +10.16 +0.13%, S&P 500 2982.92 +6.92 +0.23%
-
18:21
European stocks closed: FTSE 7282.34 +11.17 +0.15%, DAX 12191.73 +64.95 +0.54%, CAC 5603.99 +10.62 +0.19%
-
15:35
U.S. Stocks open: Dow +0.16%, Nasdaq +0.03% S&P +0.06%
-
15:25
Before the bell: S&P futures +0.31%, NASDAQ futures +0.18%
U.S. stock-index futures rose on Friday, despite the release of mixed jobs report, which showed a greater-than-expected slowdown in domestic job growth in August and a strong wage gain.
Global Stocks:
Index/commodity
Last
Today's Change, points
Today's Change, %
Nikkei
21,199.57
+113.63
+0.54%
Hang Seng
26,690.76
+175.23
+0.66%
Shanghai
2,999.60
+13.74
+0.46%
S&P/ASX
6,647.30
+34.10
+0.52%
FTSE
7,272.43
+1.26
+0.02%
CAC
5,595.30
+1.93
+0.03%
DAX
12,181.47
+54.69
+0.45%
Crude oil
$55.24
-1.88%
Gold
$1,525.50
0.00%
-
14:59
Wall Street. Stocks before the bell
(company / ticker / price / change ($/%) / volume)
3M Co
MMM
164.5
0.27(0.16%)
848
ALCOA INC.
AA
19.72
0.10(0.51%)
8214
ALTRIA GROUP INC.
MO
44
0.15(0.34%)
18168
Amazon.com Inc., NASDAQ
AMZN
1,839.50
-1.22(-0.07%)
37918
Apple Inc.
AAPL
213.65
0.37(0.17%)
171351
AT&T Inc
T
35.83
-0.06(-0.17%)
11672
Boeing Co
BA
361
0.70(0.19%)
13979
Caterpillar Inc
CAT
123.7
0.71(0.58%)
7294
Chevron Corp
CVX
117.04
-0.60(-0.51%)
2019
Cisco Systems Inc
CSCO
48.72
0.30(0.62%)
16120
Citigroup Inc., NYSE
C
66.35
0.01(0.02%)
7591
Exxon Mobil Corp
XOM
70.29
0.02(0.03%)
979
Facebook, Inc.
FB
189.51
-1.39(-0.73%)
102349
FedEx Corporation, NYSE
FDX
164.38
0.65(0.40%)
957
Ford Motor Co.
F
9.36
0.02(0.21%)
16904
Freeport-McMoRan Copper & Gold Inc., NYSE
FCX
9.5
-0.03(-0.31%)
22431
General Electric Co
GE
8.82
0.01(0.11%)
110495
Goldman Sachs
GS
206.5
-0.55(-0.27%)
610
Google Inc.
GOOG
1,208.50
-2.88(-0.24%)
4334
Home Depot Inc
HD
228.26
0.11(0.05%)
3168
Intel Corp
INTC
50.2
0.10(0.20%)
18682
International Business Machines Co...
IBM
141.18
0.21(0.15%)
457
Johnson & Johnson
JNJ
128.37
-0.21(-0.16%)
3290
JPMorgan Chase and Co
JPM
112.38
0.01(0.01%)
3706
McDonald's Corp
MCD
219.06
-0.43(-0.20%)
435
Merck & Co Inc
MRK
86.45
0.35(0.41%)
426
Microsoft Corp
MSFT
139.91
-0.14(-0.10%)
71445
Nike
NKE
88.37
-0.05(-0.06%)
2174
Pfizer Inc
PFE
36.45
0.11(0.30%)
785
Procter & Gamble Co
PG
122.99
0.23(0.19%)
523
Starbucks Corporation, NASDAQ
SBUX
95.6
0.04(0.04%)
3258
Tesla Motors, Inc., NASDAQ
TSLA
228.65
-0.93(-0.41%)
44575
The Coca-Cola Co
KO
55.29
0.17(0.31%)
3131
Travelers Companies Inc
TRV
152
0.26(0.17%)
106
Twitter, Inc., NYSE
TWTR
45.25
-0.05(-0.11%)
61424
United Technologies Corp
UTX
133
-0.03(-0.02%)
671
UnitedHealth Group Inc
UNH
230.24
0.65(0.28%)
512
Verizon Communications Inc
VZ
58.51
-0.08(-0.14%)
2594
Visa
V
185
0.27(0.15%)
5760
Wal-Mart Stores Inc
WMT
115.7
0.26(0.23%)
6903
Walt Disney Co
DIS
138.96
0.12(0.09%)
3859
Yandex N.V., NASDAQ
YNDX
38.06
-0.02(-0.05%)
133
-
14:44
Downgrades before the market open
Bank of America (BAC) downgraded to Mkt Perform from Outperform at Keefe Bruyette; target lowered to $29
-
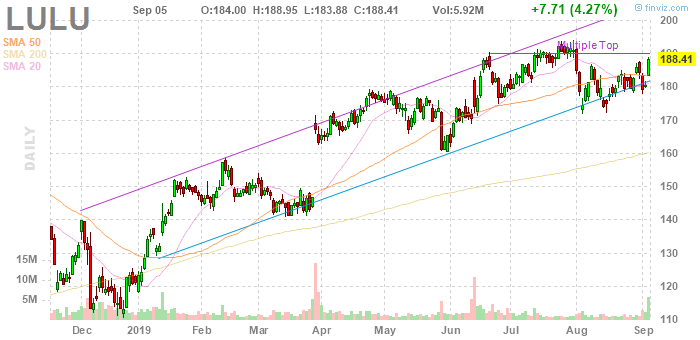
14:17
Company News: Lululemon Athletica (LULU) quarterly results beat analysts’ forecasts
Lululemon Athletica (LULU) reported Q2 FY 2019 earnings of $0.96 per share (versus $0.71 in Q2 FY 2018), beating analysts’ consensus estimate of $0.89.
The company’s quarterly revenues amounted to $0.883 bln (+22.1% y/y), beating analysts’ consensus estimate of $0.845 bln.
The company also issued guidance for Q3, projecting EPS of $0.90-0.92 (versus analysts’ consensus estimate of $0.90) and revenues of $0.880-0.890 bln (versus analysts’ consensus estimate of $0.865 bln).
For FY2019, the company forecasts EPS of $4.63-4.70 (versus analysts’ consensus estimate of $4.64) and revenues of $3.8-3.84 bln (versus analysts’ consensus estimate of $3.81 bln).
LULU rose to $200.00 (+6.15%) in pre-market trading.
-
02:30
Stocks. Daily history for Thursday, September 5, 2019
Index Change, points Closed Change, % NIKKEI 225 436.8 21085.94 2.12 Hang Seng -7.7 26515.53 -0.03 KOSPI 16.22 2004.75 0.82 ASX 200 60.2 6613.2 0.92 FTSE 100 -40.09 7271.17 -0.55 DAX 101.74 12126.78 0.85 Dow Jones 372.68 26728.15 1.41 S&P 500 38.22 2976 1.3 NASDAQ Composite 139.95 8116.83 1.75 -