- uk100 4h time frame chart
Notícias do Mercado
17 novembro 2017
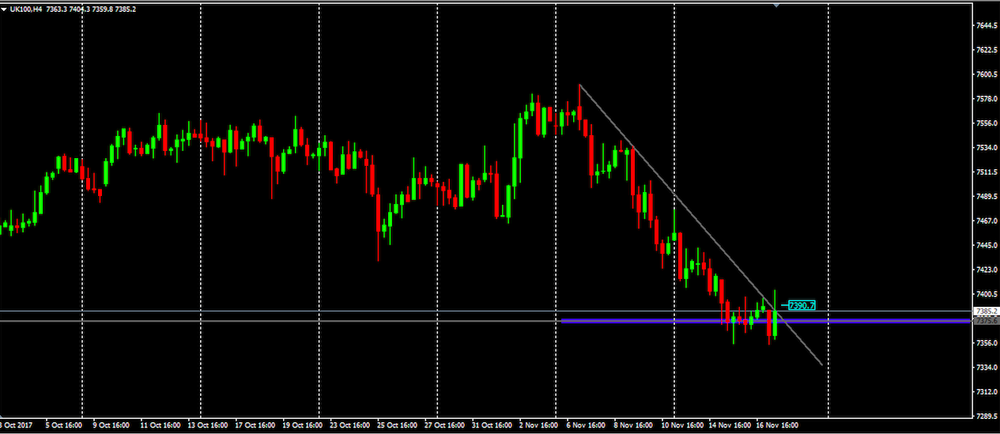
uk100 4h time frame chart
Uk100 has been following a downside trend which we can see on 4-hour time frame chart, however, the price is in a crucial zone to decide the next movement.
As we can see, this last 4hour candle tried to break the downside trend but without success.
On the other hand, we have a relatively important level of support which the price has shown some difficulties in breaking down.
Therefore, we can expect a bearish movement once this support level is broken.
But if the price continues to reject the support level, it is also expected to see a slight correction of previous bearish movement.
O foco de mercado
Abrir Conta Demo e Página Pessoal