- USTECH 100 Daily analysis
Notícias do Mercado
7 dezembro 2017
USTECH 100 Daily analysis
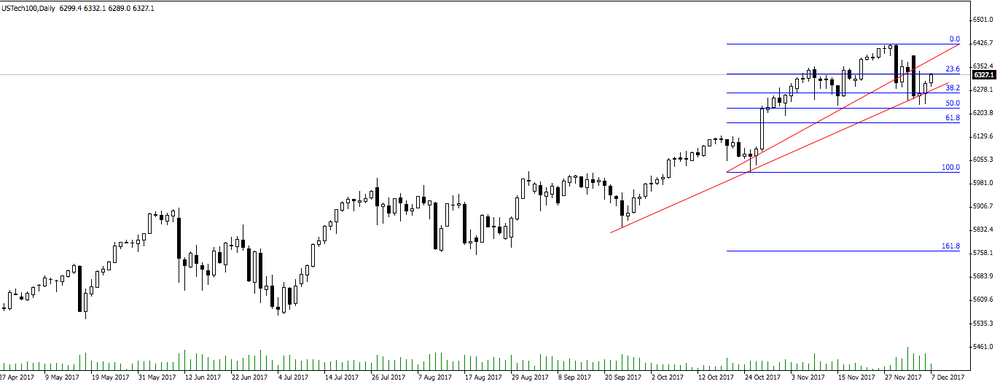
As we can see on daily time frame chart, the price looks like it might start a new bullish movement.
Also, we can see that the price just touched the upside trend line and it is rejecting the 38.2% of fibonacci's level.
In this scenario, we can expect a new higher high soon.
Also, we can see that the price just touched the upside trend line and it is rejecting the 38.2% of fibonacci's level.
In this scenario, we can expect a new higher high soon.
O foco de mercado
Abrir Conta Demo e Página Pessoal