- DAX Daily Time Frame Chart
Notícias do Mercado
14 dezembro 2017
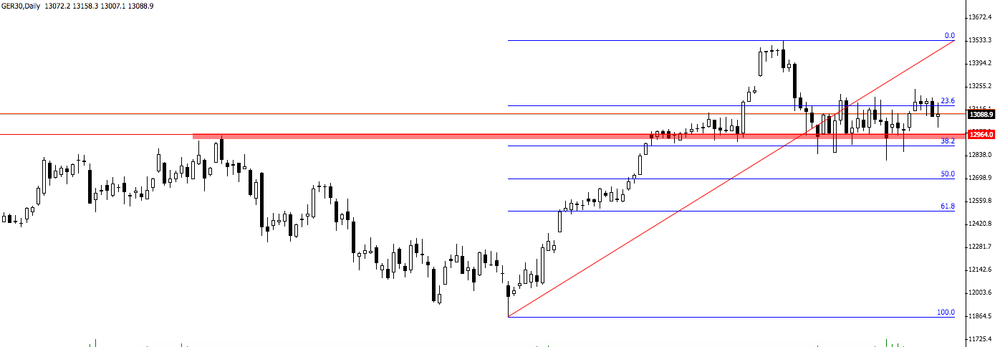
DAX Daily Time Frame Chart
On daily time frame chart we can see that the price still remains above the support zone and the fibonacci's level (38.2%).
In this scenario, we can expect a further bullish movement soon.
In this scenario, we can expect a further bullish movement soon.
O foco de mercado
Abrir Conta Demo e Página Pessoal